Grain-size dynamics beneath mid-ocean ridges: Implications for permeability and melt extraction
Abstract
Grain size is an important control on mantle viscosity and permeability, but is difficult or impossible to measure in situ. We construct a two-dimensional, single phase model for the steady-state mean grain size beneath a mid-ocean ridge. The mantle rheology is modelled as a composite of diffusion creep, dislocation creep, dislocation accommodated grain boundary sliding, and a plastic stress limiter. The mean grain size is calculated by the piezometric relationship of Austin and Evans (2007). We investigate the sensitivity of our model to global variations in grain growth exponent, potential temperature, spreading-rate, and mantle hydration. We interpret the mean mean grain-size field in the context of permeability. The permeability structure due to mean grain size may be approximated as a high permeability region beneath a low permeability region. The transition between high and low permeability regions forms a boundary that is steeply sloped toward the ridge axis. We hypothesise that such a permeability structure generated from the variability of the mean grain size may be able to focus melt towards the ridge axis, analogous to a Sparks and Parmentier (1991)-type focusing. This focusing may, in turn, constrain the region where significant melt fractions are observed by seismic or magnetotelluric surveys. This interpretation of melt focusing via the grain-size permeability structure is consistent with MT observation of the asthenosphere beneath the East Pacific Rise (Baba et al., 2006; Key et al., 2013).
1 Introduction
Mid-ocean ridges (MOR) are a fundamental feature of terrestrial plate tectonics and the simplest of the main tectono-volcanic systems. The asthenospheric dynamics beneath and near MORs are driven mostly by spreading of lithospheric plates, which is a consequence of far-field tectonic stresses (e.g. slab pull). The passive asthenospheric flow caused by imposed plate spreading is dominantly controlled by the material properties of the asthenosphere and, in particular, its viscosity. Furthermore, asthenospheric flow beneath a ridge causes melting; this melt segregates to fuel MOR volcanism and production of oceanic crust. Melt segregation is controlled by the permeability of the partially molten asthenosphere. Both mantle permeability and viscosity are sensitive to mantle grain size, a key property that has received little consideration in most previous models.
Grain size is a fundamental structural property of a polycrystalline material that can vary in response to conditions including stress, strain rate, temperature, and the presence of melt. Grain size growth and reduction are thought to be consequences of independent and simultaneous processes (e.g. Austin and Evans, 2007; Hall and Parmentier, 2003). In situations where these rates are balanced, a steady-state grain size can be established. However, predictions of grain dynamics are complicated by the non-linear relationships between the grain size, viscosity, and stress, which can lead to reinforcing feedbacks.
Ductile strain localisation is a well-studied example of a grain-size feedback (Poirier, 1980; Jessell and Lister, 1991; Drury et al., 1991; Jin et al., 1998; Braun et al., 1999; Montési and Hirth, 2003; Bercovici and Ricard, 2003). It occurs when the viscosity is positively correlated with grain size. Deformational work reduces the local grain size, which in turn reduces the viscosity. A decrease in viscosity allows the local strain-rate to increase, which further reduces the local grain size. This feedback mechanism is the basis for an instability that can emerge from an inhomogeneous initial viscosity and/or grain size field and lead to strain localisation. In the simple form discussed here, it does not rely on the presence of fluid or melt. However, strain localisation in the presence of melt may lead to the generation of melt bands, which can lead to additional feedbacks on the localization process (Katz et al., 2006; Rudge and Bercovici, 2014).
A second feedback in which grain size plays a role is associated with reactive flow of magma through a permeabile mantle matrix (Kelemen et al., 1995; Aharonov et al., 1995). Magma rising under buoyancy is undersaturated in SiO2 and hence dissolves pyroxene and precipitates olivine; this process leaves a dunite residue as evidence of extensive reaction (Morgan and Liang, 2003, 2005). If pyroxene is a pinning phase that limits the growth of olivine grains (Evans et al., 2001), then reactive dissolution may enable more rapid growth of olivine. Since permeability depends on the square of grain size (e.g. von Bargen and Waff, 1986), this would increase permeability, strengthening channelisation and reactive dissolution, and enabling further olivine grain growth (Braun, 2004).
These two examples of feedback mechanisms emphasise the importance of grain-size variations in time and space for controlling the dynamics of mantle processes. Unfortunately, there are no direct measurements of in situ grain size in the Earth’s mantle. Mantle xenoliths (Twiss, 1977; Ave Lallemant et al., 1980) and ophiolites (Braun, 2004) can provide estimates for the range of grain sizes in the upper mantle, however, such studies provide no information about spatial variations in grain size on the scale of mantle dynamics beneath a ridge axis. Moreover, it is difficult to assess how much these samples have evolved during emplacment, and thus how representative the recorded grain sizes are of normal mantle conditions. Similarly seismic attenuation, which is a strong function of grain size (Karato, 2003), typically cannot resolve grain size variations on the length-scales that are important for controlling ridge dynamics.
An alternative approach for assessing grain size variations in the mantle is to couple numerical models with experimentally derived flow laws and grain-size evolution models. Behn et al. (2009) used this approach to estimate grain size as a function of depth in the oceanic upper mantle. As part of their study they compared the models of Hall and Parmentier (2003) and Austin and Evans (2007) with experimental data for deformed wet and dry olivine. They found that the Austin and Evans (2007) model provided closer agreement with the laboratory experiments. Behn et al. (2009) modeled grain size in a one-dimensional vertical column with a composite rheology of dislocation and diffusion creep. The steady-state grain size was calculated under the assumption that a constant fraction of mechanical work acts to reduce grain size. They found that the mean grain-size reaches a minimum of 15-20 mm at a depth of approximately 150 km. They also found that the structure of mean grain size is a good fit to the low seismic shear-wave velocity zone in the upper oceanic mantle. They predicted that dislocation creep is the dominant deformation mechanism for all depths of the upper mantle. However, Behn et al. (2009) did not calculate the influence of mantle corner flow, and so the near-ridge strain-rate structure was over-simplified. Moreover, the assumption of a constant fraction of mechanical work reducing the mean grain size, as opposed to a fraction of dislocation work (Austin and Evans, 2007), removed a potentially important coupling between the deformation mechanism and mean grain size.
The goal of this study is to characterise the variations in grain-size beneath a mid-ocean ridge, with particular focus upon the implications for the permeability structure beneath the ridge. The permeability structure is an important control on melt migration and has been implicated as a key component in focusing of partial melt towards the ridge axis. In such focusing models (e.g. Sparks and Parmentier, 1991; Spiegelman, 1993; Ghods and Arkani-Hamed, 2000; Hebert and Montési, 2010), the cold thermal boundary of the lithosphere gives rise to a permeability barrier due to freezing of melt within the pore space of the mantle. The buoyancy-driven vertical transport of melt is inhibited beneath this barrier by a compaction pressure gradient of that balances the melt buoyancy. If the thermal boundary were perpendicular to the gravity vector, then melt would be trapped at this boundary. However, the thermal boundary layer is inclined towards the ridge axis, such that a component of the compaction pressure gradient, which acts normal to the permeability barrier, drives melt towards the ridge axis. However, permeability-based models of melt focusing have yet to consider the contribution of spatial variations in grain size beneath the ridge axis. This leaves open the question of whether a gradient in grain size can act as a permeability barrier and, if so, what effect would this have on melt transport beneath a mid-ocean ridge.
In this study we construct a two-dimensional, single phase model for the steady-state grain size beneath a mid-ocean ridge. The model employs a composite rheology of diffusion creep, dislocation creep, dislocation accommodated grain boundary sliding, and a plastic stress limiter. Our choice of rheology allows for a nonlinear coupling between the mean grain size and strain rate; the mean grain size is reduced by dislocation creep and grain boundary sliding, which then affects the strain rate of diffusion creep and grain boundary sliding. The mean grain size is calculated using the paleowattmeter model (Austin and Evans, 2007). The dynamics of the model are described by Stokes flow and the rheology is taken from experimental flow laws.
The manuscript is organised as follows. We develop the model in section 2. First the standard Stokes flow dynamics are briefly outlined, then the composite rheology and mean grain-size evolution model are presented in detail. Section 2 concludes by examining the sensitivity of the composite rheology to variations in experimentally determined parameters for two different grain boundary sliding parameterizations. In section 3 we present a reference case for grain-size dynamics beneath a mid-ocean ridge and explore the sensitivity of the model to grain boundary sliding parameters, water concentration, and parameter perturbations within the mean grain-size evolution equation. In section 4, we investigate the influence of mean grain size upon the permeability structure for an ultra-slow, slow, and fast spreading-rate ridge. The permeability structure due to mean grain size is then interpreted in the context of melt transport.
2 Model
We consider a model of incompressible, constant density, Stokes flow with variable viscosity. The viscosity is associated with a set of simultaneously active creep mechanisms with rates that depend on pressure, temperature, strain rate and, distinct from most previous work, the mean grain size. All of these fields are allowed to vary spatially throughout the domain, however we examine only steady-state solutions.
2.1 Flow and thermal model
In this context, conservation of mass, momentum, and energy reduce to equations representing the incompressibility constraint, balance of viscous stress with the pressure gradient, and balance of heat flow by advection and diffusion. We neglect viscous dissipation of heat. The governing equations, written in terms of nondimensional symbols, are
| (1a) | ||||
| (1b) | ||||
| (1c) | ||||
where is the velocity, is the dynamic pressure, is the effective viscosity, is potential temperature, and is the strain rate tensor. The equations have been nondimensionalised with the characteristic scales: plate speed , domain height , viscosity , pressure , and mantle potential temperature . These scalings give rise to the dimensionless Peclet number , a measure of the relative importance of advective to diffusive heat transport ( is the thermal diffusivity). The viscosity is capped at a dimensional value of Pa-s to improve the efficiency of numerical solutions.
The domain is a rectangle with the left edge aligned vertically beneath the spreading axis and the top boundary coincident with the sea floor, perpendicular to the spreading axis. The velocity and temperature at the top boundary are set as and , where is the width of distributed extension by normal faulting at the ridge axis. Here, is taken to be 4 km. The temperature at the bottom boundary is set to one to represent adiabatic inflow of ambient mantle. The dynamic pressure is set to zero on the right boundary. All other boundary conditions enforce zero gradient normal to the relevant boundary. The reflection boundary conditions on the vertical boundary beneath the ridge axis represents an assumption of symmetry across the ridge axis. This assumption is invalid for ridges that migrate in a reference frame fixed on the deep mantle, but here we ignore complexities associated with ridge migration.
An explicit model for the viscosity is required to close the system of equations (1); this is developed in the following section.
2.2 Rheology
To derive an effective viscosity for equation (1b) we begin with the assumption that various deformation mechanism are simultaneously active, and that their individual strain rates sum to produce the total strain rate
| (2) |
where is an index corresponding to the deformation mechanism and is the strain rate tensor associated with the deformation mechanism. Each mechanisms is driven by the total deviatoric stress at a rate that is consistent with its own viscosity . Equation (2) can be rearranged to give the effective viscosity,
| (3) |
This harmonic sum represents the physical concept that deformation at a point in the mantle is dominated by the mechanism with the lowest viscosty, such that .
Here we consider four mechanisms of rock deformation: dislocation creep (), diffusion creep (), grain boundary sliding (), and a brittle plastic stress limiter () such that . The latter is described by a Drucker-Prager yield criterion that may be written as , where is the scalar yield stress, is the cohesion, is the total pressure and is the friction angle. The Drucker-Prager yield criterion can be rewritten as a viscosity by using (2) to give
| (4) |
The cohesion and friction angle are constants within the model presented and the yield criterion is assumed to be independent of grain size. The inclusion of a plastic deformation mechanism puts an upper limit on the amount of stress a volume can support. An increase in the percentage of plastic flow within a volume has the effect of reducing the viscosity of the volume, such that when , where is the second invariant of the deviatoric stress tensor .
A general formulation of the viscosity for dislocation creep, diffusion creep, and grain-boundary sliding includes an Arrhenius factor, a power-law dependence on mean grain size , a power-law strain-rate dependence, and a power-law dependence on water concentration ,
| (5) |
where is an experimentally determined prefactor for dry or wet conditions, is the activation energy, is the activation volume, is the universal gas constant, is the total pressure, is the second invariant of the composite strain-rate, , and is the water content in units of OHSi. The exponents , , and control the sensitivity to strain rate, grain size and water content, respectively. enforces a sensitivity to strain rate, and is associated with non-Newtonian viscosity. A full list of parameter values and units is provided in Table 1.
| Symbol | units | Description | Value |
|---|---|---|---|
| sec-1 MPa-n | Dislocation prefactor | ||
| sec-1 MPa-n | Dislocation prefactor for wet composition | ||
| J/mol | Dislocation activation energy | ||
| mmol | Dislocation activation volume | ||
| - | Dislocation Stress exponent | ||
| - | Dislocation Grain-size exponent | ||
| - | Dislocation water exponent | ||
| m3 sec-1 MPa-1 | Diffusion prefactor | ||
| m3 sec-1 MPa-1 | Diffusion prefactor for wet composition | ||
| J/mol | Diffusion activation energy | ||
| m3/mol | Diffusion activation volume | ||
| - | Diffusion Stress exponent | ||
| - | Diffusion Grain-size exponent | ||
| - | Diffusion water exponent | ||
| m3 sec-1 MPa-1 | GBS prefactor | ||
| J/mol | GBS activation energy | ||
| m3/mol | GBS activation volume | ||
| - | GBS Stress exponent | ||
| - | GBS Grain-size exponent | ||
| - | GBS water exponent | ||
| Pa | Cohesion | ||
| degrees | Friction angle |
Each of the three thermally activated deformation mechanisms has a distinct combination of . Diffusion creep is sensitive to mean grain size () but insensitive to strain rate (); dislocation creep is independent of grain-size but is non-Newtonian (); dislocation-accommodated grain-boundary sliding is both grain-size sensitive and non-Newtonian (). The creep flow law parameters are taken from laboratory experiments. In particular, we adopt values from Hirth and Kohlstedt (2003) for diffusion and dislocation creep; for grain-boundary sliding we consider parameter values from both Hirth and Kohlstedt (2003) and Hansen et al. (2011). Values are given in Table 1.
It is evident from Equation 5 that to compute the viscosity associated with diffusion creep and grain-boundary sliding we require, as an input, the spatial distribution of mean grain size . In the next section we describe a theory for dynamic grain size that completes our model.
2.3 Mean grain size
Following Behn et al. (2009), we adopt the theory for grain size evolution elaborated by Austin and Evans (2007). They assume that the rate of change of mean grain size equals the difference between the rate of normal grain growth and the rate of grain size reduction by recrystallization such that at steady-state, the grain growth rate is equal to the rate of grain size reduction. Below, we consider normal grain growth and dynamic recrystallisation in turn, and then discuss the combined theory.
2.3.1 Normal grain growth
Burke and Turnbull (1952) formulated a canonical model for normal grain-growth kinetics. They hypothesise that grain–grain boundaries migrate, changing grain sizes, due to the pressure difference between grains. On the scale of individual, neighbouring grains, pressure differences arise from differences in surface tension. Surface tension (and hence pressure) is inversely proportional to the radius of curvature of the grain boundary. The pressure difference between two grains at their boundary therefore causes atoms to preferentially migrate from smaller to larger grains. Mean grain size increases while the surface area of grain–grain boundaries decreases, leading to a reduction in the stored energy of the system.
Burke and Turnbull (1952) assumed that the free energy per unit area and the mobility of grain–grain boundaries are independent of grain size. The mean grain size therefore varies with time as , where is the grain growth exponent. Differentiating and eliminating gives the rate of grain growth . Since grain growth is also a thermally activated process, its rate may be written as
| (6) |
where is the constant of proportionality.
Following from the argument above, the theoretically determined value for the grain growth exponent is (Burke and Turnbull, 1952; Hillert, 1965; Atkinson, 1988, and references therein). Atkinson (1988) argued that is an idealised case for a single phase system. Experiments have found that environmental factors including temperature, crystal composition, and the presence of impurities, melt, and volatiles all may affect the grain-growth exponent (Atkinson, 1988; Evans et al., 2001, and references therein). In the present manuscript, we employ an empirically determined reference value (Evans et al., 2001; Behn et al., 2009) and consider the sensitivity of the results to different values of this exponent.
2.3.2 Grain-size reduction
In the Austin and Evans (2007) model of grain size reduction, the energy required to create new grain boundaries by dynamic recrystalisation is supplied by mechanical work. They postulate that some fraction of the work is reversibly transferred into surface energy of new grain boundaries, while the remainder is dissipated irreversibly as heat. The volumetric mechanical work may be written as and therefore the volumetric work rate is . In the steady-state limit, . Thus, the work rate per unit volume reduces to .
The change in internal energy per unit volume may be written as,
| (7) |
where is the surface energy per unit area of the grain-grain boundaries, and and are the surface area and volume of a grain with characteristic size . In this case, we can write and , thus the change in energy per unit volume associated with grain size reduction is , where is a dimensionless constant associated with the ratio of surface area to volume for a typical grain. For spherical and cubic grains or , respectively.
Of the total rate of mechanical work, , some fraction is accomplished by processes that depend on the movement of dislocations through the crystalline lattice (dislocation creep () and dislocation-accommodated grain boundary sliding ()). In particular,
| (8) |
where we have used equations (2) and (3) to write the work rate in terms of viscosities. Of the portion of the total work rate, some fraction goes into the grain size reduction and the rest, , is dissipated as an irreversible increase in entropy.
Using this approach Austin and Evans (2007) arrived at the rate equation for reduction of mean grain size due to the rate of mechanical work as
| (9) |
The quantity in the first set of parentheses represents the rate of work per unit volume acting to reduce mean grain size; the quantity in the second set of parentheses represents the energetic cost per unit volume of grain size reduction.
2.3.3 Evolution of mean grain size
Combining the rates of grain size growth (6) and reduction (9) additively (Austin and Evans, 2007) along trajectories of mantle flow gives the full equation for grain size evolution as
| (10) |
Equation (10) is put into non-dimensional form using the following characteristic scales: , , , , and . The mean grain size may vary over many orders of magnitude and therefore we make the substitution to improve numerical stability. With these modifications and assuming that grain size is in a quasi-steady state, equation (10) becomes
| (11) |
where
| (12) |
are the nondimensional coefficient of grain reduction and grain growth, respectively. All symbols in equation (11) are dimensionless except those in the Arrhenius exponent. Parameter values and units associated with the model for grain size evolution are given in table 2.
| Symbol | units | Description | Reference value |
|---|---|---|---|
| - | Fraction of dislocation work to grain size reduction | ||
| - | Geometric factor | ||
| J m-2 | Surface energy at grain–grain contacts | ||
| mp s-1 | Grain-growth prefactor | ||
| - | Grain-growth exponent | 3 | |
| J/mol | Grain-growth activation energy | ||
| m3/mol | Activation volume for grain growth |
The grain growth and reduction parameters are dimensionless numbers formed by taking the ratio of grain-growth and grain-reduction prefactors to the characteristic scale associated with grain size advection. Their size is not particularly meaningful, however, because viscosity, strain rate, temperature, and grain size vary drastically throughout the domain. Rates for grain growth and reduction are similarly variable and hence characteristic scales are not available. It is notable, however, that appears in the numerator of and in the denominator of . This suggests that with increasing spreading rates, grain size reduction should dominate over grain growth; we expect steady-state, mean grain size to decrease with increasing spreading rate.
2.4 Parameter values and deformation mechanisms
The governing partial differential equations (1) and (11) form a closed system with the rheological model of section 2.2. However, there is considerable uncertainty in the values of laboratory-derived parameters associated with dislocation accomodated grain-boundary sliding. In this section, we use deformation-mechanism maps to highlight the physical consequences that arise from the uncertainties in these parameters.
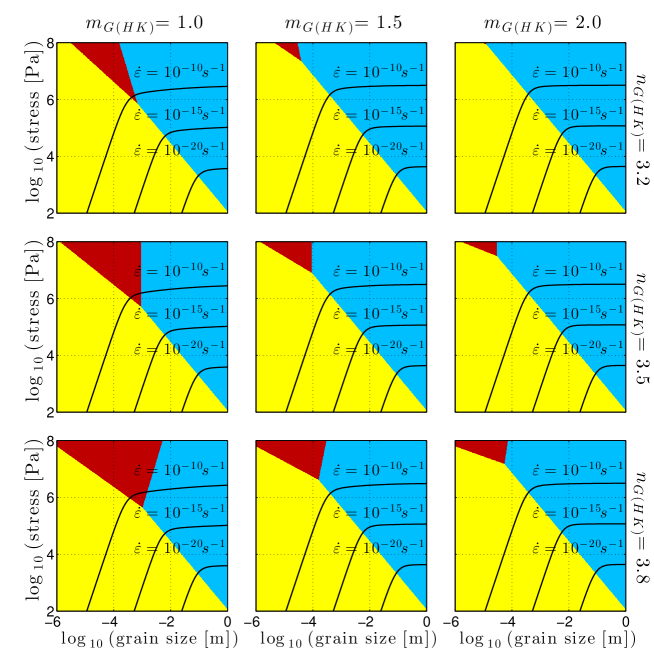
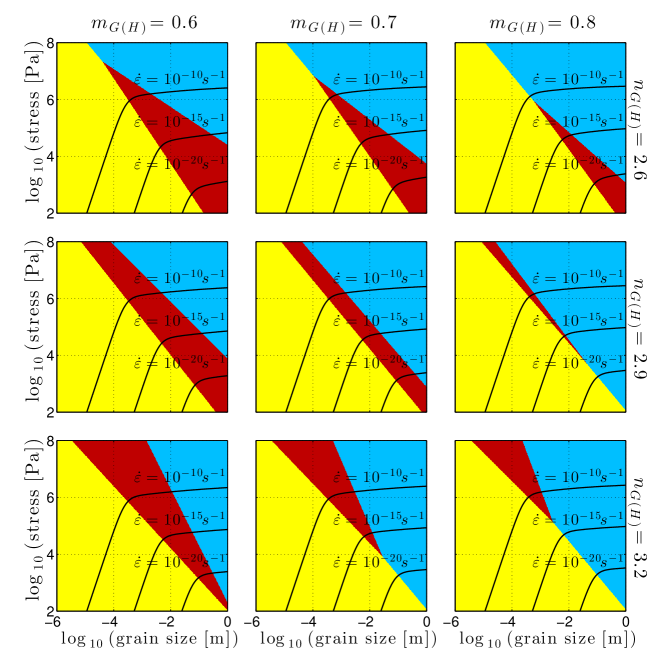
Hansen et al. (2011) and Hirth and Kohlstedt (2003) both estimated GBS parameter values from laboratory data and obtained different results. In particular, their values for the grain size exponent and the stress exponent are in disagreement. Hansen et al. (2011) obtained and . Hirth and Kohlstedt (2003) estimated and asserted that is between 1 and 2; we therefore consider three values and test the sensitivity of the dominant deformation mechanism to the grain size exponent in the GBS constitutive equation (5). Note that we use eqn. A4 in the appendix of Becker (2006) to account for the co-variation of the viscous prefactor with stress and/or grain exponent.
Figures 1 and 2 show maps of the dominant deformation mechanism (that with the largest contribution to the overall strain rate), as a function of stress and grain size, for parameter values obtained from Hirth and Kohlstedt (2003) and Hansen et al. (2011), respectively. Deformation mechanisms are computed at 1 GPa (about 30 km depth) and 1350 ∘C. Solid black lines are contours of constant strain rate appropriate for asthenospheric flow beneath mid-ocean ridges. Each plot is associated with a unique set , as labelled on the column and row of the plot. All other empirical values used in the flow law (5) are held constant, including all experimentally determined values for diffusion creep and dislocation creep. Regions dominated by diffusion creep, dislocation creep, and grain boundary sliding are shown in yellow, blue, and red, respectively.
For strain rates relevant for asthenospheric flow, the calculations based on Hirth and Kohlstedt (2003) predicted little contribution from GBS. Therefore, if the Hirth & Kohlstedt parameters are appropriate, we do not expect sub-ridge grain size and flow to be sensitive to the value of the GBS parameters used. However, based on the parameters from Hansen et al. (2011), GBS will be dominant over some range of stress–grain size conditions relevant to mid-ocean ridges. The details of its contribution will depend on the values of and that are chosen.
In constructing a reference model in the next section, we adopt the parameter values suggested by Hansen et al. (2011). The Hansen et al. (2011) parameters have the advantage that the values have been calibrated to a single experimental set-up, the activation energy was measured, and modern analytical techniques were used to measure grain size.
3 Results
3.1 Reference case
We use the model described above to investigate the grain-size dynamics beneath a mid-ocean ridge. We begin by considering how the mean grain-size field, and dependent variables, behave for the reference parameters shown in tables 1 & 2. For the reference case we use the grain boundary sliding values of Hansen et al. (2011) and a half spreading-rate of cm/a. A half rate of 2 cm/a is typical of slow-spreading ridges such as the mid-Atlantic ridge.
The mean grain size and associated fields are shown for the reference parameters in Figure 3. Panel (a) shows the mean grain size. The colour-bar has been truncated to highlight grain sizes of 4 mm to 4 cm. Panel (b) shows the rate of work per unit volume acting to reduce the mean grain size (); we call this the dislocation work-rate, as it denotes the fraction of work done by processes that depend on the movement of dislocations through the crystalline lattice. White lines display contours of potential temperature at 1250∘C and 600∘C. Panel (c) shows the second invariant of the strain-rate tensor. White lines are streamlines of the solid flow. Panel (d) shows the composite viscosity. For the purpose of explanation, the grain size field may be roughly separated into three regions (I, II, III), as shown in panel (a) of Figure 3. We now consider each region in turn.
Region I represents the conductively cooled lithosphere, which contains temperatures C. At such low temperatures (, where is the melting temperature) viscous creep mechanisms are not active, and the grain-size evolution model used here does not apply. In region I, cold temperatures drive both the grain growth and reduction rates to zero. Therefore advection of grain size becomes the dominant process. For negligible growth and reduction rates we expect and hence that grain size is approximately constant along streamlines. Streamlines in the lithosphere are horizontal, leading to constant grain size with distance from the ridge axis at depths where the thermal profile results in negligible growth and reduction rates. The typical grain size of region I is 1 cm with a minimum grain size of the order of 10 m near the surface.
Region II is an area of active deformation and contains the greatest average strain-rates. As such, the mean grain-size reduction term in equation (11) takes a maximum value in this region. The grain growth-rate varies across region II due to the temperature increase with depth. Generally, the temperature in region II is greater than 1250∘C, which results in a large grain growth rate. However, near the transition from region II to I, the temperature drops sharply while the dislocation work-rate remains high. This can be seen in panel (b) of Figure 3, where the colour indicates the magnitude of dislocation work-rate and the white contours display the 1250∘C and 600∘C isotherm. A combination of the dislocation work-rate structure and thermal structure leads to a vertical gradient to the mean grain-size within region II. The mean grain-size varies from approximately 2 cm at the transition between regions II & III to 6 mm at the transition between regions I & II. Note that the small grain sizes near the surface in region I are actually generated in region II. As immediately beneath the ridge axis the mantle flow must turn a tight corner, and so here the dislocation work-rate is high (Figure 3b).
Region III undergoes relatively slow deformation at high temperature. As a result, diffusion creep becomes increasingly significant with depth as both and decrease in the grain-size reduction term. The grain growth term remains uniformly high, due to a high potential temperature in region III. The combination of these effects allows the mean grain size to grow most rapidly in region III and achieve the largest mean grain size over the whole domain. The typical mean grain size for region III is of the order of 2 cm, ranging from approximately 1.5 cm to 4 cm.
As highlighted in Section 2.4, the parameters for grain boundary sliding are uncertain and we therefore consider the sensitivity of the reference model with respect to the grain boundary sliding parameters. Near the ridge axis, the consequences of such changes are subtle. Therefore, we use an extended domain to demonstrate the implications of different choices for the grain boundary sliding parameters at greater distances from the axis.
3.2 Grain boundary sliding parameters
Grain boundary sliding is the only deformation mechanism that gives rise to a direct coupling between mean grain size and strain rate within our model; it is therefore important to determine whether the mean grain-size field is sensitive to the choice of grain boundary sliding parameters. Here we investigate the dominant deformation mechanism as a function of space beneath a mid-ocean ridge for the grain boundary sliding parameters found by Hansen et al. (2011) and Hirth and Kohlstedt (2003). In addition, we evaluate and compare the strain rate of each deformation mechanism within our composite rheology. We also investigate the influence of grain boundary sliding parameters upon the predicted mean grain-size field.
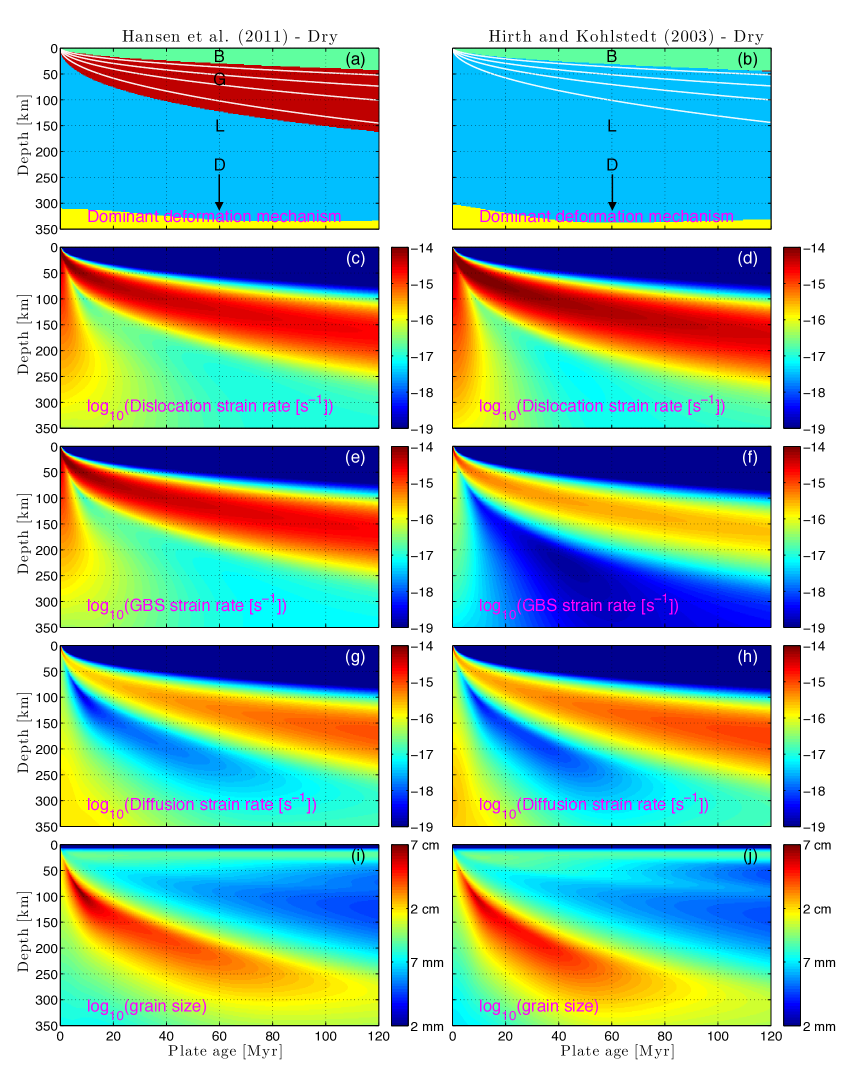
We consider a large domain of 350 km depth and 2400 km width from the ridge axis (corresponding, at cm/a to a maximum plate age of 120 Myr) in Figure 4. The two columns differ only by the grain boundary sliding parameters used: the left column uses the parameters determined by Hansen et al. (2011) and the right column uses the parameters from Hirth and Kohlstedt (2003). Panels (a) & (b) display the dominant deformation mechanism. Regions where plasticity (B), diffusion creep (D), dislocation creep (L) and grain boundary sliding (G) dominate are shown in green, yellow, blue and red respectively. Isotherms are shown for C in white. Panels (c)-(h) allow comparison between the magnitude of strain rate in each creep component; dislocation creep is shown in panels (c) & (d), grain boundary sliding is shown in panels (e) & (f), and diffusion creep is shown in panels (g) & (h). Panels (i) & (j) show the resulting mean grain size field.
Figure 4 shows that the regions characterised by plastic deformation and diffusion creep are unaffected by the grain boundary sliding parameters. Diffusion creep controls the rheology at depths greater than 300 km; plastic deformation dominates at temperatures less than 600∘C. At depths below the 600∘C isotherm and above 300 km depth, the dislocation-dependent deformation mechanisms determine the rheology. As expected based on section 2.4, the Hansen et al. (2011) parameters enhance grain boundary sliding, giving it a large region of dominance from the middle to the base of the lithosphere. This region is located between the 600∘C and 1200∘C isotherms. No such region is predicted from the Hirth and Kohlstedt (2003) parameters.
For the Hansen et al. (2011) parameters, the dislocation-related strain rate is split approximately evenly between dislocation creep and grain boundary sliding (Figure 4 panel (c) and (e)). In contrast, for the parameters of Hirth and Kohlstedt (2003), the dislocation creep rate is 1–2 orders of magnitude greater than that of grain boundary sliding. Moreover, under the Hirth and Kohlstedt (2003) parameters, our model predicts a greater strain rate for diffusion creep than grain boundary sliding in the the majority of the asthenospheric mantle beneath a mid-ocean ridge (Figure 4 panel (f) and (h)).
Despite these differences, the mean grain-size structure is relatively insensitive to the grain boundary sliding parameters in the range considered here. The maximum difference in mean grain size is less than 80% between models using the two parametrisations of grain boundary sliding. For comparison, the spatial variation of mean grain size within the domain for a single parametrisation is greater than three orders of magnitude. All of these results, however, are obtained under the assumption that the mantle is anhydrous. The presence of water in olivine is known to weaken creep deformation. In the next section we consider how inclusion of a mantle water content that depends only on depth influences the composite rheology and the flow.
3.3 The effects of water
An important effect of water is to lower the solidus temperature of the mantle, which allows partial melting to occur at a greater depth than for anhydrous mantle. During mantle melting, water behaves as an incompatible element (Hirth and Kohlstedt, 1996); the deepest, incipient melts are highly enriched in water. At depths where the upwelling mantle is above the anhydrous solidus, the solid residuum of melting is almost completely dehydrated. Given these considerations, the concentration of water in the mantle may be a simple function of depth, near the ridge axis (e.g. Braun et al., 2000). We parametrise the concentration of water in the mantle as
| (13) |
where is the maximum water concentration, is the depth at which the mantle crosses the wet solidus, and is the depth of the dry solidus.
The water concentration of the mantle beneath a mid-ocean ridge is constrained to be below 2000 OHSi, with current estimates being OHSi (Hirth and Kohlstedt, 1996). In this paper we will consider values of OHSi . These values approximately correspond to the mean and upper limit of water concentration estimates. Note that the dominant deformation mechanism of the upper mantle beneath a mid-ocean ridge is dislocation creep with a viscosity proportional to (see equation 5). Therefore, differences between and 1500 or and 810 OHSi are negligible.
As discussed above, among the deformation mechanisms considered here, the parameters for grain boundary sliding are the least well constrained. Currently there is no evidence that grain boundary sliding is affected by the presence of water (Hirth and Kohlstedt, 2003). Therefore, we set and . Consequently, grain boundary sliding becomes sub-dominant in regions where water is present.
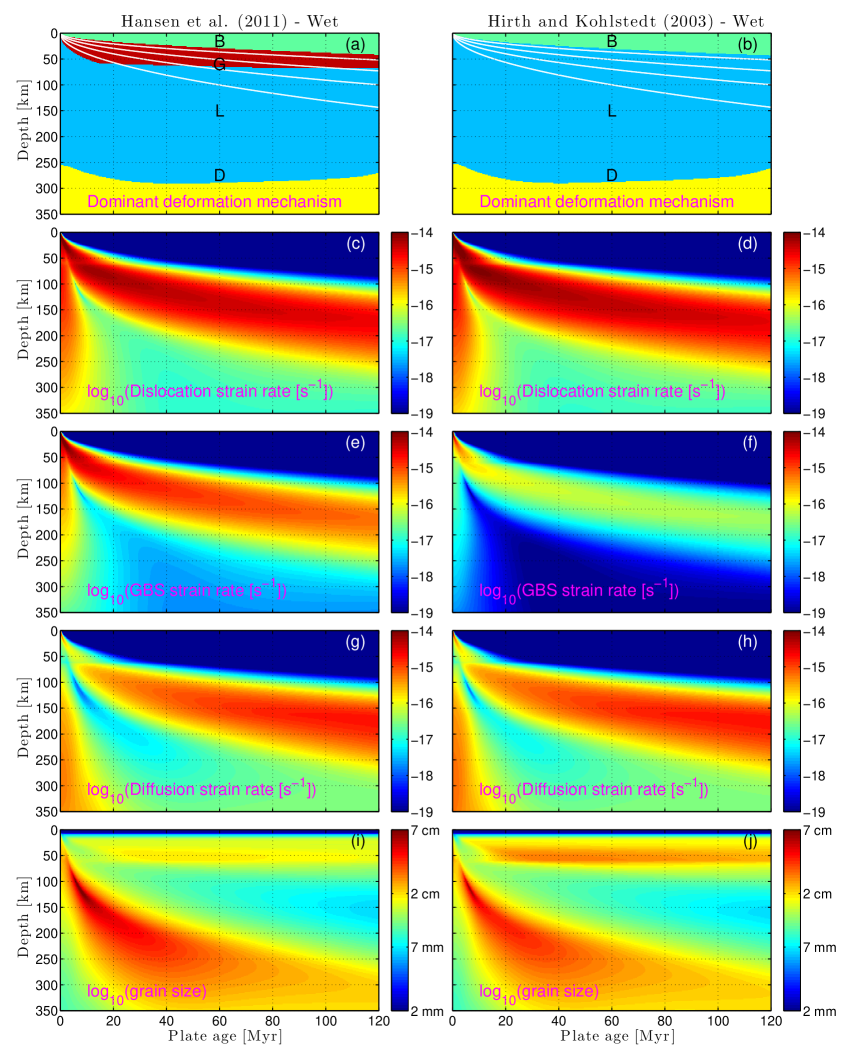
Figure 5 shows the effect of our water parametrisation upon the rheology and mean grain size field. The values of , , and are set as 57 km, 160 km and 1500 OHSi respectively. As before, the two columns of Figure 5 differ only by the grain boundary sliding parameters used; the left column uses Hansen et al. (2011) and the right column uses Hirth and Kohlstedt (2003). The modification of viscosity due to hydration results in accommodation of the plate-driven deformation at greater depth (i.e., below ); shallower than , the total strain rate decreases. The effective strain rate at depths less than are reduced by an order of magnitude for the hydrous model compared to the dry model (compare Figs. 4 and 5), leading to an increase in mean grain size at for the hydrous model. Furthermore, because the plate-driven deformation is accommodated at a greater depth, the region of large grain-size (III) approaches the ridge axis more closely. This could be significant for the transport of volatile rich partial melts.
3.4 Sensitivity to parameters
The preceding discussion explored grain-size dynamics with composite rheology and hydration. We next focus on the predictions these models make for global mid-ocean ridge spreading systems. Specifically, the ridge system is characterized by systematic variations in certain parameters (e.g., spreading rate and potential temperature (Gale et al., 2013; Dalton et al., 2014)) and others that are simply uncertain due to a lack of experimental or observational constraint (e.g., the grain-growth exponent and mantle water content).
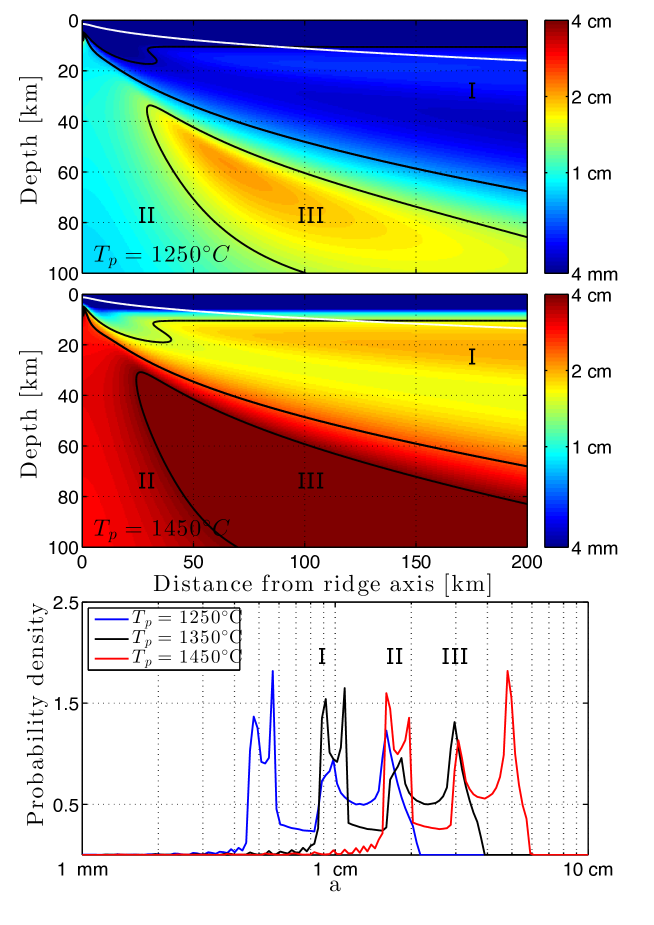
In this section we explore the sensitivity of the model to a subset of these parameters. We consider the sensitivity of the mean grain-size field to potential temperature, grain growth exponent, spreading rate, and water concentration. Except where stated otherwise, parameters used in the model are the same as for the reference case. The results are presented in terms of a probability density function of the asthenospheric grain size. The probability densities are constructed from a region 100 km in depth and 200 km in width, centered on the ridge axis, excluding places where the temperature is colder than C. This ensures that only regions of active creep are included but still provides approximately 68,000 grid points over which each probability density is calculated, for a grid spacing of 0.5 km.
We first examine the sensitivity of the mean grain-size field to variations in the potential temperature (Figure 6). The mean grain-size for the two extreme cases (1250∘C and 1450∘C) are presented in the top and middle panels with a white contour marking the 600∘C isotherm. The probability density for each case is shown in the bottom panel. The black curve corresponds to the reference potential temperature (corresponding to the reference case shown in Figure 3a) and potential temperatures of 1250∘C and 1450∘C are shown in blue and red, respectively. The Roman numerals between black contours in the top and middle panels correspond to equivalently labelled peaks of the probability density functions. However, the numerical values of grain size along these contours are not equal between the top and middle panels; rather, they correspond to equivalent spatial structures and relate to peaks of probability density for the reference case (black profile in bottom panel).
Variations in potential temperature approximately preserve the form of the grain-size probability density functions. The change in grain growth and reduction rates come from the Arrhenius dependence of grain-boundary mobility and dislocation creep, respectively. The present model uses an activation energy for grain boundary mobility of 350 kJ and for dislocation creep of 520 kJ; therefore the derivative of grain growth rate with respect to temperature is always greater than that of grain reduction. This difference results in a translation of the grain-size probability density to smaller or larger grain sizes for lower or higher potential temperatures, respectively.
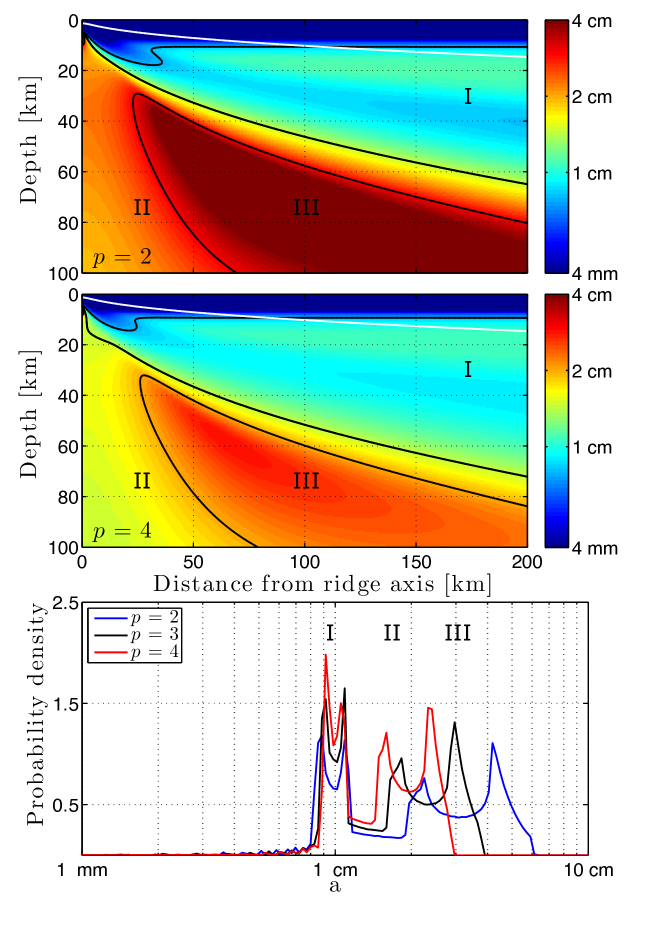
We next investigate the sensitivity of the mean grain size field to variations in the grain growth exponent (Figure 7). The mean grain size as a function of space is plotted for grain growth exponent in the top and middle panels, respectively. Again the white contour is the 600∘C isotherm. The probability densities for each value of are shown in the bottom panel of Figure 7, where the reference grain growth exponent is shown in black and are shown in blue and red, respectively. As before, Roman numerals associate structures in the spatial domain with peaks in the probability density functions.
The grain growth exponent determines the rate at which the mean grain size grows, according to the relationship . A larger grain growth exponent therefore leads to a decreased growth rate. The coupling between both grain reduction and growth rates through the mean grain size leads to an increase in mean grain size only for those regions where grain growth rate dominates. This is seen clearly in the effect of on the probability density functions in Figure 7. Specifically, in Region I where grain size reduction dominates, the peak of the distribution remains relatively fixed at cm. By contrast, in Regions II and III, where grain growth is enhanced, smaller values of lead to progressively larger grain sizes. This contrasts with the case of varying mantle potential temperature (Figure 6), in which the Arrhenius term for reduction and growth rates are altered in a complimentary fashion, and thus result in a translation (rather than a stretching) of the probability densities. Note that the prefactor for grain growth is co-variant upon the other parameter values, analogous to the viscous prefactor. We make the assumption that the rate of grain growth is unchanged for a reference grain size . Therefore, is rescaled as follows,
where is the reference grain growth prefactor and is the reference grain growth exponent.
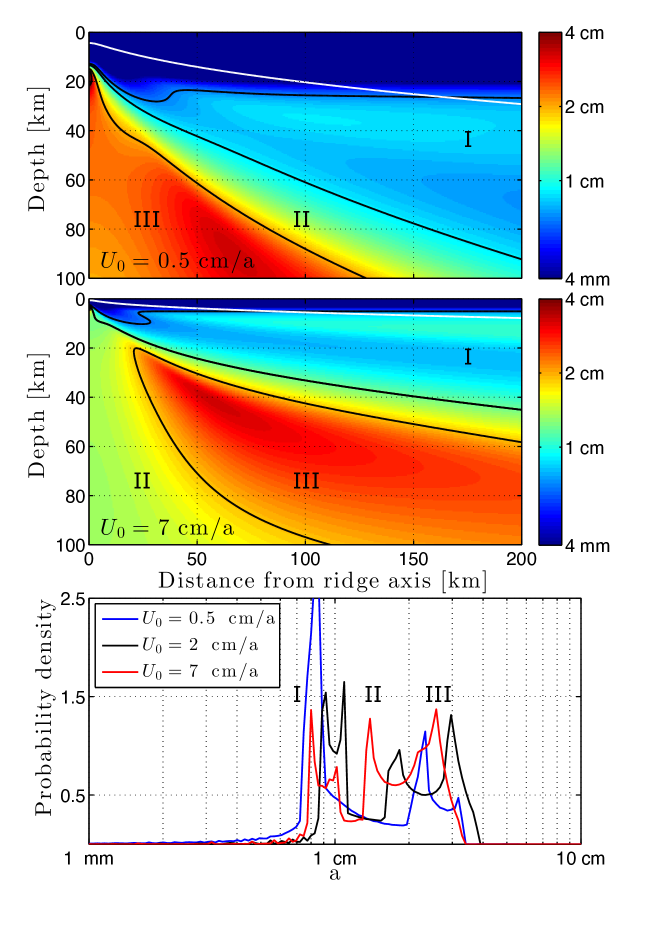
We next evaluate the sensitivity of the mean grain-size field to variations in spreading rate (Figure 8). The mean grain size for cm/a is shown in the top and middle panels, respectively, and their probability density functions are compared to the reference case with cm/a in the lower panel. The effect of spreading rate on the probability density can be predicted from the nondimensional parameters and (eqn. (12)). These parameters suggest that as the spreading rate is increased, the probability density will undergo a translation to smaller grain size. This behaviour is evident in a comparison of the probability densities of the slow and fast spreading ridges. To understand the slowest spreading rate, we recall that controls two fundamental properties of a mid-ocean ridge system: the thermal profile of the adjacent lithosphere and the magnitude of asthenospheric strain rates. A prediction based on and assumes that the variation of strain rate is of leading-order importance. This assumption is invalid for an ultra-slow spreading rate; in that case, changes associated with the thermal structure have a greater control on the distribution of mean grain sizes.
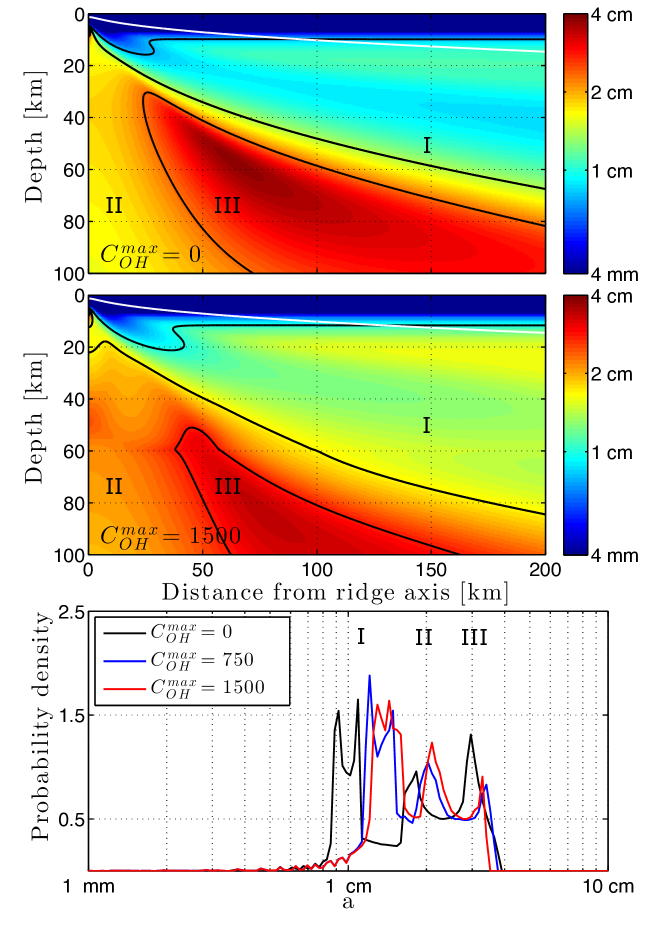
Lastly, we investigate the sensitivity of the mean grain-size field to variations in the deep-asthenospheric water concentration (Figure 9). The spatial distribution of mean grain size for OHSi is shown in the top and middle panels, respectively. The probability density funcitons are shown in the bottom panel, where OHSi are shown in black, blue, and red, respectively.
In our model, water content enters the grain-size evolution implicitly, by reduction of viscosity; therefore, only the grain-size reduction rate is altered by water. This is analogous to the sensitivity of grain size to , in that only a single rate prefactor in equation (11) is explicitly altered. Hence, one expects to see a contraction/dilation of the probability density at the small grain-size side of the distribution, which is indeed evident in the bottom panel of Figure 9.
The mean grain-size probability densities for and OHSi are very similar. This is to be expected, given the dominance of dislocation creep in the present models. Under dislocation creep, the stress exponent and water exponent are and , respectively. The dependence of dislocation creep rate on water concentration thus scales as . Therefore, the change in viscosity due to water content is greatest for the first few hundred ; viscosity is weakened to approximately 80% of its original value when the water concentration is increased from to or to OHSi.
4 Permeability of the partially molten region
A key objective of this paper is to predict the influence of mean grain size on the permeability structure of the mantle beneath a mid-ocean ridge. Mantle permeability at low melt fraction may be written as a function of mean grain size and melt fraction as , where and are empirically determined constants related to the geometry of the pore network (e.g. McKenzie, 1984; von Bargen and Waff, 1986). Recent work by Miller et al. (2014) indicates that and are appropriate for mantle conditions. This value for is significantly lower than previous estimates (Wark and Watson, 1998), except for that of Connolly et al. (2009), who found much higher permeability overall and suggested –. For consistency with previous work on two-phase magma dynamics, we choose and . It is straightforward to rescale these results for smaller ; permeability becomes larger overall.
The current model considers only a single-phase mantle, and hence does not offer an obvious means for computing melt fraction that is consistent with conservation of mass, momentum, and energy. Therefore, in order to estimate the dimensional permeability, we use the solidus parameterisation from Katz et al. (2003) (eqn. (4)) to determine the region in which temperature and pressure conditions are favourable for the stability of partial melt. Within this region, we make the simplifying assumption of a constant melt fraction to emphasize the contribution of grain size on the permeability structure. Outside of the region of partial melting, permeability is set to zero.
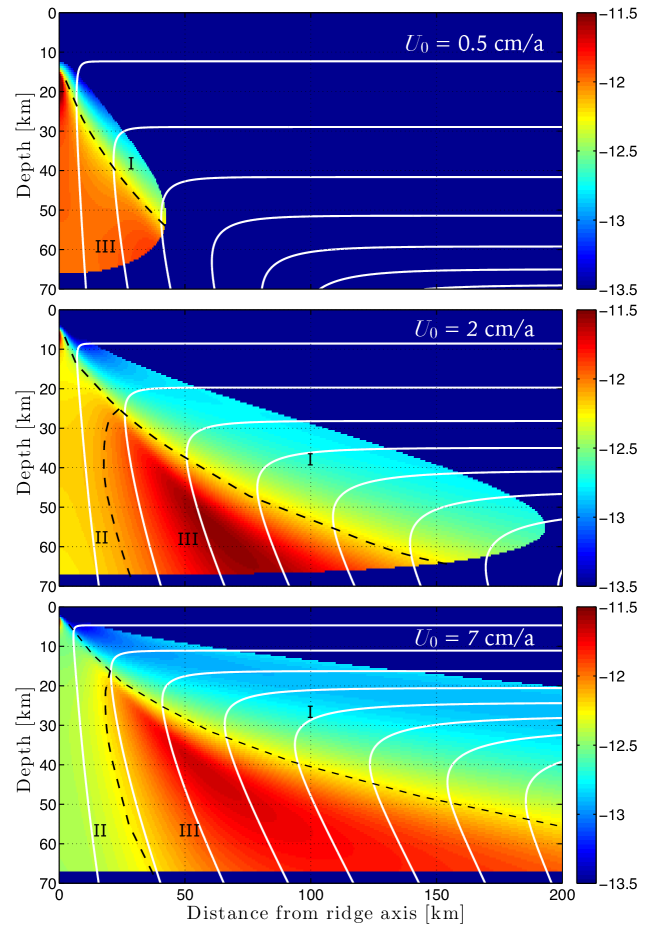
The predicted dimensional permeability for spreading rates of cm/a are shown in the top, middle, and bottom panels of Figure 10, respectively. The colour-bar is truncated to show a dimensional permeability of . Mantle streamlines are shown in white. For purposes of discussion, each panel has been split into three regions: region I has a low permeability compared to the rest of the melting regime; region II has intermediate permeability and is approximately columnar beneath the ridge axis; and region III has the largest permeability of the melt region. These regions are approximately the same as were used to describe grain size in section 3.4.
The middle panel of Figure 10 displays the permeability structure for the reference model. This may be broadly described as a higher permeability mantle (regions II & III) beneath lower permeability mantle (region I). The transition from high to low permeability follows a curve that slopes upward toward the ridge axis. The grain-size induced change of permeability across this transition is about one order of magnitude.
The top and bottom panels of Figure 10 show simulations for an ultra-slow ( cm/a) and fast ( cm/a) spreading rate, respectively. The primary effect of varying the spreading rate is to alter the thermal structure within the domain, which in turn alters the extent of the partially molten region. A secondary effect is to alter the magnitude of the maximum strain rate beneath the ridge, shifting the balance between grain growth and grain size reduction. The net result of thermal and strain-rate effects is to increase the significance of region I with increasing spreading rate. At faster spreading rate, the permeability of region I decreases and occupies a larger fraction of the partially molten region.
Vertical, extensional strain rates in the column of mantle beneath the ridge axis control the grain size and permeability of Region II. At slow spreading, extensional strain rates in this region are minimal, allowing grains to grow to large size and permeability to increase. Under these conditions, shown in the top panel of Fig. 10, region II is not discernable and essentially merges with region III. With increasing spreading rate, however, larger extensional strain rates lead to differentiation of region II from region III by reduction of grain size. The distinction between regions II and III is greatest at fast spreading rate (bottom panel Fig. 10).
Region III is evident at all spreading rates shown in Figure 10. This region is characterized by very slow deformation rates and high temperatures. The mean grain size is stabilized at its maximum values in this location, yielding the highest permeability there.
Although melt transport is not included in the present model, it is interesting to speculate on how modification of the permeability structure by variations in grain size might affect melt migration. Calculations shown in Katz (2008) provide a reference case for melt flow in a mid-ocean ridge setting with grain size assumed to be constant (see Fig. 4a of Katz (2008)). As predicted by Sparks and Parmentier (1991), melt tends to rise vertically under buoyancy until it reaches the permeability barrier associated with sub-solidus temperatures in the overlying lithosphere. At the permeability barrier, melt is deflected toward the ridge axis and travels through a high-permeability channel located immediately below the barrier. The key feature of the Sparks and Parmentier (1991) model is that there exists an upward transition from non-zero to zero permeability along a barrier that is sloping with respect to the horizontal. Spiegelman (1993) considered the efficiency of lateral deflection of melt in this context, relating it to the sharpness of the freezing front and the compaction length in the region below it.
The gradient in permeability at the bottom of region I in Figure 10 is not as sharp as that associated with the freezing front at the base of the lithosphere, but it may nonetheless function in an analogous way. At the base of region I, permeability is high and the compaction length (at ) is large, due to higher mean grain-size there. Above the transition, permeability is reduced (though note that there is no difference in potential temperature across the transition). Melt can penetrate across this gradient, but increasing Darcy drag and consequent compaction pressure associated with the lower permeability might deflect melt laterally toward the ridge axis, leading to preferential migration along the base of region I. Therefore, the grain-size induced transition of permeability may be thought of as a “soft” permeability barrier, giving rise to a variant of Sparks and Parmentier (1991)-type melt focusing.
Given the structure of mantle flow, melt production is more rapid below region I where mantle upwelling, and thus melt production rates, are greater. If the soft barrier at the base of region I is effective, melts could accumulate there, increasing porosity above the constant value of 1% assumed here. This would in turn increase permeability, potentially resulting in a sloping decompaction channel (Sparks and Parmentier, 1991). The presence of this channel would sharpen the permeability contast at base of region I, and its steep slope would resolve a large component of the buoyancy force along it (larger than that along the more shallowly sloping barrier at the bottom of the lithosphere).
If a “soft” permeability barrier associated with grain-size variations is capable of efficiently focusing magma toward the ridge axis, we would expect low porosity throughout region I of the model. In contrast, the mantle in the triangular zone above the dry solidus and below region I would host more melting and higher porosity. It might therefore stand out in seismic or magnetotelluric inversions as a steep-sided region of slow shear-wave speed or higher electrical conductivity. It is interesting to compare this hypothesis with recent magnetotelluric (MT) observations. MT studies by Baba et al. (2006) and Key et al. (2013) along the East Pacific Rise imaged triangular regions of high conductivity with sides sloping downward at about 45∘ to the (horizontal) spreading direction. The observed slope is signficantly greater than that calculated based on the porosity field computed in two-phase flow models (Katz, 2008), which predict a much shallower slope coinciding with the base of the oceanic thermal boundary layer. However, these MT observations could be explained by a soft permeability barrier associated with grain-size variations in the melting region. Specifically, a barrier formed at the base of region I for the fast-spreading case shown in Figure 10 would produce a steep sided, highly conductive triangle similar to that observed in the MT data. Future calculations that fully couple grain size evolution and two-phase flow are needed to explicitly test these predictions and determine whether the “soft” barrier would generate an efficient mechanism to channelise rising melts toward the ridge axis.
5 Conclusion
In this study we have presented a two-dimensional, single phase model for the steady-state mean grain size beneath a mid-ocean ridge. The model employs a composite rheology incorporating diffusion creep, dislocation creep, grain boundary sliding, and plasticity. Mean grain sizes were calculated using the paleowattmeter model of Austin and Evans (2007).
We investigated the robustness of the mean grain-size field to variations in the grain boundary sliding parameters by comparing the experimentally determined parameters of Hansen et al. (2011) and Hirth and Kohlstedt (2003). It was found that the structure of the mean grain-size field is generally insensitive to grain boundary sliding parameters.
We also investigated the robustness of the mean grain-size field to mantle hydration state. We imposed a one-dimensional parametrisation of mantle water concentration and coupled this concentration into the dynamics through the viscosity terms only. Interestingly, the presence of water had the greatest impact on the mean grain-size at depths less than approximately 60 km. This was due to a shift in the location of maximum strain rate to greater depth as a consequence of the more compliant, hydrated mantle below the dehydration boundary.
We considered the sensitivity of the mean grain-size field to variations of parameters in the grain evolution model. If a parameter influences both the growth and reduction-rate prefactors, then the mean grain-size probability density may undergo a translation to larger or smaller grain sizes. This was observed for the case of potential temperature, and when comparing the slow spreading rate with a fast spreading rate. In contrast, for parameter variations that only influence either the growth or reduction rate prefactor, we obtain a stretching of the mean grain-size probability density at the large or small grain-size side of the distribution. This was seen in the case of the grain growth exponent and water concentration.
Finally, we studied the impact of the mean grain-size field on the permeability structure for a half spreading-rate of cm/a. We assumed a uniform melt fraction of 1% within the expected melt region and found that, for all spreading rates, the permeability structure due to mean grain size may be approximated as a high permeability region beneath a low permeability region. The transition between high and low permeability regions forms a boundary that is steeply sloped toward the ridge axis. This is, to some extent, analogous to the permability barrier often hypothesized to form at the base of the lithosphere and we suggest that it may similarly focus melt towards the ridge axis. This focusing may, in turn, constrain the region where significant melt fractions are observed by seismic or magnetotelluric surveys. This interpretation of melt focusing via the grain-size permeability structure is consistent with MT observation of the asthenosphere beneath the East Pacific Rise (Baba et al., 2006; Key et al., 2013).
We emphasize that these predictions for permeability and melt focusing beneath mid-ocean ridges are based on results from a single-phase model formulation for solid mantle flow. The incorporation of a liquid magmatic phase is expected to alter the results. Due to the more complex coupling between viscosity, flow, melting, porosity, grain-size, and permeability under two-phase flow, it is difficult to predict how such a model would differ from the results and predictions obtained here. A more detailed investigation of mid-ocean-ridge grain-size dynamics, in the context of two-phase, coupled magma/mantle dynamics, is the focus of forthcoming work.
6 Acknowledgements
The authors acknowledge helpful discussions with Brian Evans, Lars Hansen, Kerry Key, Tobias Keller, Sander Rhebergen, and John Rudge. The research leading to these results has received funding from the European Research Council under the European Union’s Seventh Framework Programme (FP7/2007-2013) / ERC grant agreement number 279925. Katz is grateful for additional support from the Leverhulme Trust. Parameter values used to produce the numerical results are provided in Tables 1, 2, and in the text.

| Symbol | Units | Description |
|---|---|---|
| cm a-1 | velocity | |
| Pa | Dynamic Pressure | |
| Pa | Total Pressure | |
| Pa s | Viscosity | |
| s-1 | strain-rate tensor | |
| s-1 | second invariant of strain-rate | |
| Pa | deviatoric stress tensor | |
| Pa | second invariant of deviatoric stress | |
| Pa s-1 | stress-rate tensor | |
| K | Temperature | |
| km | Ridge width | |
| - | deformation mechanism index | |
| Pa | Yield stress | |
| s | time | |
| J s-1 | work-rate | |
| m3 | Volume | |
| m2 | Surface area | |
| J m-3 | Energy per unit volume | |
| cm a-1 | Spreading-rate | |
| ∘C | Potential temperature | |
| OHSi | Water concentration |
References
- Aharonov et al. [1995] E. Aharonov, J.A. Whitehead, P.B. Kelemen, and M. Spiegelman. Channeling instability of upwelling melt in the mantle. J. Geophys. Res., 1995.
- Atkinson [1988] H.V. Atkinson. Overview no. 65: Theories of normal grain growth in pure single phase systems. Acta Metallurgica, 36:469–491, 1988.
- Austin and Evans [2007] N. J. Austin and B. Evans. Paleowattmeters: A scaling relation for dynamically recrystallized grain size. Geology, 35:343, 2007.
- Ave Lallemant et al. [1980] H. G. Ave Lallemant, J.-C. C. Mercier, N. L. Carter, and J. V. Ross. Rheology of the upper mantle: Inferences from peridotite xenoliths. Tectonophysics, 70:85–113, 1980.
- Baba et al. [2006] K. Baba, A. D. Chave, R. L. Evans, G. Hirth, and R. L. Mackie. Mantle dynamics beneath the East Pacific Rise at S: Insights from the Mantle Electromagnetic and Tomography (MELT) experiment. Journal of Geophysical Research (Solid Earth), 111:B02101, 2006.
- Becker [2006] T. W. Becker. On the effect of temperature and strain-rate dependent viscosity on global mantle flow, net rotation, and plate-driving forces. Geophysical Journal International, 167:943–957, November 2006.
- Behn et al. [2009] Mark Behn, Greg Hirth, and James Elsenbeck. Implications of grain size evolution on the seismic structure of the oceanic upper mantle. Earth Plan. Sci. Lett., 282(1-4):178–189, 2009. doi: 0.1016/j.epsl.2009.03.014.
- Bercovici and Ricard [2003] David Bercovici and Yanick Ricard. Energetics of a two-phase model of lithospheric damage, shear localization and plate-boundary formation. Geophysical Journal International, 152:581–596, 2003.
- Braun et al. [1999] J. Braun, J. Chéry, A. Poliakov, D. Mainprice, A. Vauchez, A. Tomassi, and M. Daignières. A simple parameterization of strain localization in the ductile regime due to grain size reduction: A case study for olivine. J. Geophys. Res., 104:25167, 1999.
- Braun [2004] M.G. Braun. Petrologic and Microstructural Constraints on Focused Melt Transport in Dunites and Rheology of the Shallow Mantle. PhD thesis, MIT/WHOI Joint Program, 2004. URL http://www.dtic.mil/dtic/tr/fulltext/u2/a426948.pdf.
- Braun et al. [2000] MG Braun, G Hirth, and EM Parmentier. The effects of deep damp melting on mantle flow and melt generation beneath mid-ocean ridges. Earth Plan. Sci. Lett., 176(3-4):339–356, 2000.
- Burke and Turnbull [1952] J. Burke and D. Turnbull. Recrystallization and grain growth. Progress in Metal Physics, 3:220–292, 1952.
- Connolly et al. [2009] James A D Connolly, Max W Schmidt, Giulio Solferino, and Nikolai Bagdassarov. Permeability of asthenospheric mantle and melt extraction rates at mid-ocean ridges. Nature, 462(7270):209, 2009. doi: 10.1038/nature08517.
- Dalton et al. [2014] CA Dalton, CH Langmuir, and A Gale. Geophysical and Geochemical Evidence for Deep Temperature Variations Beneath Mid-Ocean Ridges. Science, 2014. doi: 10.1126/science.1250551.
- Drury et al. [1991] M. R. Drury, R. L. M. Vissers, D. van der Wal, and E. H. Hoogerduijn Strating. Shear localisation in upper mantle peridotites. Pure and Applied Geophysics, 137:439–460, 1991.
- Evans et al. [2001] B. Evans, J. Renner, and G. Hirth. A few remarks on the kinetics of static grain growth in rocks. International Journal of Earth Sciences, 90:88–103, 2001.
- Gale et al. [2013] Allison Gale, Colleen A Dalton, Charles H Langmuir, Yongjun Su, and Jean Guy Schilling. The mean composition of ocean ridge basalts. Geochem. Geophys. Geosys., 2013. doi: 10.1029/2012GC004334.
- Ghods and Arkani-Hamed [2000] A. Ghods and J. Arkani-Hamed. Melt migration beneath mid-ocean ridges. Geophys. J. Int., 140:687–697, 2000.
- Hall and Parmentier [2003] C. E. Hall and E. M. Parmentier. Influence of grain size evolution on convective instability. Geochemistry, Geophysics, Geosystems, 4:1029, 2003.
- Hansen et al. [2011] L. N. Hansen, M. E. Zimmerman, and D. L. Kohlstedt. Grain boundary sliding in San Carlos olivine: Flow law parameters and crystallographic-preferred orientation. Journal of Geophysical Research (Solid Earth), 116:B08201, 2011.
- Hebert and Montési [2010] L. B. Hebert and L. G. J. Montési. Generation of permeability barriers during melt extraction at mid-ocean ridges. Geochemistry, Geophysics, Geosystems, 11:Q12008, 2010.
- Hillert [1965] M. Hillert. On the theory of normal and abnormal grain growth. Acta Metallurgica, 13:227–238, 1965.
- Hirth and Kohlstedt [2003] G. Hirth and D. Kohlstedt. Rheology of the upper mantle and the mantle wedge: A view from the experimentalists. In Inside the Subduction Factory, volume 138 of AGU Geophysical Monograph. 2003.
- Hirth and Kohlstedt [1996] G. Hirth and D.L. Kohlstedt. Water in the oceanic upper mantle: implications for rheology, melt extraction and the evolution of the lithosphere. Earth Plan. Sci. Lett., 144(1–2):93–108, 1996.
- Jessell and Lister [1991] M. W. Jessell and G. S. Lister. Strain localization behaviour in experimental shear zones. Pure and Applied Geophysics, 137:421–438, 1991.
- Jin et al. [1998] D. Jin, S.-I. Karato, and M. Obata. Mechanisms of shear localization in the continental lithosphere: inference from the deformation microstructures of peridotites from the Ivrea zone, northwestern Italy. Journal of Structural Geology, 20:195–209, 1998.
- Karato [2003] S.-i. Karato. Mapping water content in the upper mantle. Washington DC American Geophysical Union Geophysical Monograph Series, 138:135–152, 2003.
- Katz [2008] R.F. Katz. Magma dynamics with the enthalpy method: Benchmark solutions and magmatic focusing at mid-ocean ridges. J. Petrology, 2008. doi: 10.1093/petrology/egn058.
- Katz et al. [2003] R.F. Katz, M. Spiegelman, and C. Langmuir. A new parameterization of hydrous mantle melting. Geochem. Geophys. Geosys., 2003. doi: 10.1029/2002GC000433.
- Katz et al. [2006] R.F. Katz, M. Spiegelman, and B. Holtzman. The dynamics of melt and shear localization in partially molten aggregates. Nature, 442, 2006. doi: 10.1038/nature05039.
- Kelemen et al. [1995] P.B. Kelemen, N. Shimizu, and V.J.M. Salters. Extraction of mid-ocean-ridge basalt from the upwelling mantle by focused flow of melt in dunnite channels. Nature, 375(6534):747–753, 1995.
- Key et al. [2013] K. Key, S. Constable, L. Liu, and A. Pommier. Electrical image of passive mantle upwelling beneath the northern East Pacific Rise. Nature, 495:499–502, 2013.
- McKenzie [1984] D. McKenzie. The generation and compaction of partially molten rock. J. Petrol., 25, 1984.
- Miller et al. [2014] K.J. Miller, W.-L. Zhu, L.G.J. Montési, and G.A. Gaetani. Experimental quantification of permeability of partially molten mantle rock. Earth Plan. Sci. Lett., 388:273–282, 2014. doi: 10.1016/j.epsl.2013.12.003.
- Montési and Hirth [2003] L. G. J. Montési and G. Hirth. Grain size evolution and the rheology of ductile shear zones: from laboratory experiments to postseismic creep. Earth and Planetary Science Letters, 211:97–110, 2003.
- Morgan and Liang [2003] Z Morgan and Y Liang. An experimental and numerical study of the kinetics of harzburgite reactive dissolution with applications to dunite dike formation. Earth Plan. Sci. Lett., 214(1-2):59–74, 2003.
- Morgan and Liang [2005] Zachary Morgan and Yan Liang. An experimental study of the kinetics of lherzolite reactive dissolution with applications to melt channel formation. Contributions to Mineralogy and Petrology, 150(4):369–385, 2005.
- Poirier [1980] J. P. Poirier. Shear localization and shear instability in materials in the ductile field. Journal of Structural Geology, 2:135–142, 1980.
- Rudge and Bercovici [2014] J.F. Rudge and D. Bercovici. Melt-band instabilities with two-phase damage. Geophys. J. Int., 2014. In revision.
- Sparks and Parmentier [1991] D.W. Sparks and E.M. Parmentier. Melt extraction from the mantle beneath spreading centers. Earth Plan. Sci. Lett., 105, 1991.
- Spiegelman [1993] M. Spiegelman. Physics of melt extraction: theory, implications, and applications. Phil. Trans. R. Soc. London A, 342, 1993.
- Twiss [1977] R. J. Twiss. Theory and applicability of a recrystallized grain size paleopiezometer. Pure and Applied Geophysics, 115:227–244, 1977.
- von Bargen and Waff [1986] N. von Bargen and H.S. Waff. Permeabilities, interfacial-areas and curvatures of partially molten systems - results of numerical computation of equilibrium microstructures. J. Geophys. Res., 91, 1986.
- Wark and Watson [1998] D.A. Wark and E.B. Watson. Grain-scale permeabilities of texturally equilibrated, monomineralic rocks. Earth Plan. Sci. Lett., 164, 1998.