Fermi surface of IrTe2 in the valence-bond state as determined by quantum oscillations
Abstract
We report the observation of the de Haas-van Alphen effect in IrTe2 measured using torque magnetometry at low temperatures down to 0.4 K and in high magnetic fields up to 33 T. IrTe2 undergoes a major structural transition around K due to the formation of planes of Ir and Te dimers that cut diagonally through the lattice planes, with its electronic structure predicted to change significantly from a layered system with predominantly three-dimensional character to a tilted quasi-two dimensional Fermi surface. Quantum oscillations provide direct confirmation of this unusual tilted Fermi surface and also reveal very light quasiparticle masses (less than 1 ), with no significant enhancement due to electronic correlations. We find good agreement between the angular dependence of the observed and calculated de Haas-van Alphen frequencies, taking into account the contribution of different structural domains that form while cooling IrTe2.
Transition metal dichalcogenides are layered metallic compounds which have rich electronic properties. They often exhibit signatures of unusual electronic behaviour, such as charge density wave (CDW) Rossnagel (2011) and superconductivity Morosan et al. (2006); Kiss et al. (2007); Castro Neto (2001). The CDW instability has often been explained as caused by a partial nesting of the Fermi surface Rossnagel (2011); Inosov et al. (2008) or, alternatively, the direct effect of lattice distortions with unexpected local modulations Dai et al. (2014). Recently, it has been found that IrTe2 shows a structural transition at 280 K Fang et al. (2013), which can be suppressed by doping (for example, Pt or Pd) and a superconducting state is found with a maximum close to 3 K Ootsuki et al. (2012); Pyon et al. (2012); Yang et al. (2012). There have been numerous scenarios proposed to explain the nature of the structural transition in IrTe2 linked to the possible Ir charge modulation Yang et al. (2012); Kudo et al. (2013); Matsumoto et al. (1999), anionic depolymerisation Oh et al. (2013), crystal field effects Fang et al. (2013), the disappearance of a van Hove singularity close to the Fermi level Qian et al. (2013) or, similar to other CDW dichalcogenides, associated with the partial Fermi surface nesting Ootsuki et al. (2012, 2013). However, both optical spectroscopy Fang et al. (2013) and angle resolved photoemission spectroscopy (ARPES) Ootsuki et al. (2013); Qian et al. (2013) find no evidence of the expected energy gap, and NMR spectra see no CDW behaviour, instead suggesting a lattice-driven transition Mizuno et al. (2002). Furthermore, under applied pressure increases whereas decreases Kiswandhi et al. (2013), opposite to what is expected for a CDW system Castro Neto (2001).
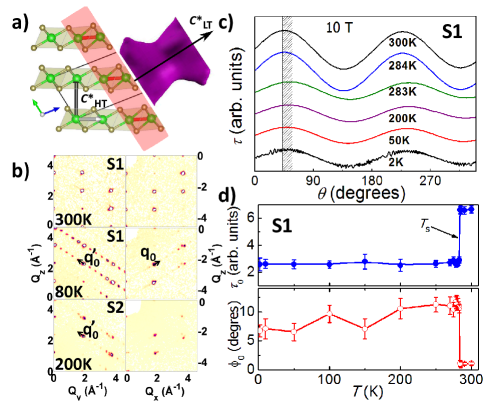
An alternative scenario for the significant electronic, magnetic and structural changes at in IrTe2 is based on detailed understanding of the lattice effects as a function of temperature Pascut et al. (2014). These studies suggest that the low temperature (LT) phase of IrTe2 is an unexpected valence-bond state (VBS) Pascut et al. (2014) with a highly non-sinusoidal structural modulation with fundamental vector Yang et al. (2012); Oh et al. (2013); Cao et al. (2013); Hsu et al. (2013). The predicted electronic structure of the low temperature modulated phase is strongly influenced by Ir (and, to a lesser extent, Te) dimerization. These dimers form planes that cut diagonally through the structural IrTe6 octahedral planes, with reduced density of states at the Fermi level (see Fig. 1a). This dimerization is predicted to cause a significant change in the electronic structure, from a predominantly quasi-three-dimensional (Q3D) Fermi surface in the high temperature phase (HT) to a highly unusual quasi-two dimensional (Q2D) Fermi surface tilted away from the lattice planes in the low temperature (LT) phase below Pascut et al. (2014); Toriyama et al. (2014). This LT phase is a unique electronic structure among metal dichalocogenides.
Experimental knowledge of the Fermi surface is vital if we are to conclusively address these predictions and understand the novel phenomena of valence-bond formation in IrTe2. ARPES measurements of IrTe2 at room temperature consistently find agreement with the Fermi surfaces predicted from first-principle calculations Ootsuki et al. (2013); Qian et al. (2013), but fail to provide a clear picture of the changes that occur below . Two of the challenges which are likely to impede these experiments significantly are: i) the unusual tilting of the proposed Q2D Fermi surface away from the cleaving plane Ootsuki et al. (2014a, b); ii) domain formation due to the lowering in symmetry through the structural transition. In this Letter we present a de Haas-van Alphen (dHvA) study in the valence-bond state of IrTe2, which provides direct experimental evidence for the unusual tilted Q2D Fermi surface. The experimentally measured effective masses are relatively light, and do not show any significant enhancement above the band mass, suggesting that electronic correlations do not play a major role in this metallic system. We find that in order to fully account for the observed data, the domain formation through the structural transition must be considered.
IrTe2 crystals were grown using Te flux, as reported previously Pyon et al. (2013). X-ray data were taken on different single crystals as a function of temperature, using an Agilent SuperNova Diffractometer, fitted with liquid nitrogen open-flow cooling (Oxford Cryosystems). The torque measurements were carried out using piezo-resistive, self sensing cantilevers, on more than four single crystals with sizes usually smaller than m3 (also characterized using X-rays) down to 0.3 K, in static magnetic fields up to 18 T in Oxford and 33 T at the HFML in Nijmegen. Throughout this paper, is defined as the angle between the magnetic field direction and the crystallographic -axis in the HT rhombohedral structure (spacegroup ) within the plane, such that corresponds to (along axis), to (along axis) and to . We calculated the band-structure using the linear augmented plane wave method, with generalised gradient approximations implemented in WIEN2k Blaha et al. (2001) using the structural parameters from Ref.Pascut et al. (2014) 111The cutoff for plane wave expansion in the interstitials was (convergence is reached for ) and 5472 k-points were used in the first Brillouin zone.. Spin-orbit coupling was included for all calculations. The extremal Fermi surface areas for the triclinic symmetry were calculated using SKEAF Rourke and Julian (2012).
Figure 1b) (top panels) shows two typical sets of diffraction patterns above , for two different samples S1 and S2, indexed using a HT hexagonal unit cell. The diffraction patterns measured below , show additional superstructure peaks at =(0,−1/5,1/5) and =(1/5, 0, 1/5) [see Figure 1b) middle and bottom panels]. These extra reflections are visible between the main diffraction spots of the HT unit cell, in both the and planes for sample S1, indicating the presence two domains, but they are present in only one direction for sample S2, suggesting that it contains a single domain Oh et al. (2013); Pascut et al. (2014). STM measurements found that different crystals of IrTe2 could display additional charge modulations, =, over a large temperature range Hsu et al. (2013). However our low temperature X-ray measurements, performed well below , show only the presence of 1/5 modulation in both samples S1 and S2 (as also found in Ref.Toriyama et al. (2014)), and we find further evidence of domain formation in our torque measurements.
Magnetic torque is caused by magnetic susceptibility anisotropy, measuring the misalignment of the magnetization with respect to a uniform applied field, . It is given by where is the bulk magnetization. For IrTe2, if and lie in the () plane, then -)= -), where is the susceptibility anisotropy between the (HT rhombohedral) -axis and -axis and is the angle shift that arises due to change in symmetry and tilting of the axis relative to the HT structure [see also Fig.1a)]. Fig. 1c) shows the angular dependence of torque for a single crystal of IrTe2 (S1), at different temperatures, in a constant applied magnetic field of 10 T. Using the above expression for , we fitted the data in Fig. 1d) for sample S1, and found that there is large reduction of amplitude, 40 %, through the structural transition at (proportional to ) and a significant phase shift. The decrease in amplitude at is likely to be caused by the change in susceptibility anisotropy as the system lowers it symmetry, but the change in electronic susceptibility Matsumoto et al. (1999), caused by a decrease in the density of states at the Fermi level Fang et al. (2013) could also play a role. We observe an angular shift of , while cooling through , [Fig.1d)], which is likely to be associated with the tilting of the axis below such that it is no longer perpendicular to the lattice planes, as expected in the VBS (shown schematically in Fig.1a) Pascut et al. (2014); Toriyama et al. (2014)).
Torque magnetometry in metallic systems at low temperatures allows access to anisotropic Fermi surfaces through the observation of quantum oscillations (de Haas-van Alphen effect) and has been successfully used to measure the Fermi surface of other dichalocgenides, such as 2H-NbSe2 Steep et al. (1995). Fig.1c) shows clear quantum oscillations at 2 K superimposed on a background signal, as measured for sample S1. In Fig. 2a) we show the field dependence of torque for sample S2 measured at 1.4 K for different orientations in magnetic field. Quantum oscillations are clearly observed in the raw torque signal over a wide angular range in different single crystals of IrTe2. The oscillation frequencies were extracted using a fast Fourier transform (FFT) of the raw data (after subtracting a low order polynomial to correct for background torque). Each of these frequencies are related to the extremal cross-section areas of the Fermi surface by the Onsager relation, , for a particular field orientation, as shown in Fig.2b). The spectra close to are dominated by multiple frequencies below 1 kT that are observed over a large angular range. In high magnetic fields (above 15 T) we can also detect the presence of additional, higher frequencies around 1.5–4 kT, but no further frequencies were observed in fields up to 33 T and temperatures down to 0.3 K.
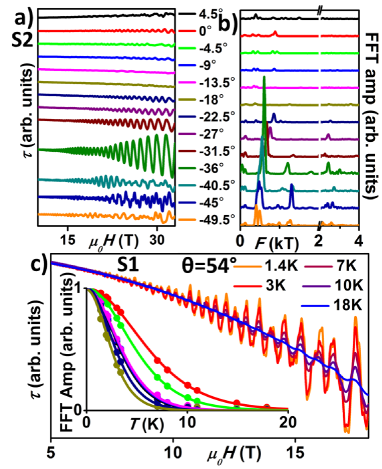
Fig. 2c) shows the temperature dependence of the quantum oscillations for sample S1 that are visible up to 20 K for . The inset shows the temperature dependence of the corresponding FFT amplitudes fitted to the Lifshitz-Kosevich expression Lifshitz and Kosevich (1956) in order to extract the effective masses corresponding to each individual frequency. The extracted values of the effective masses for different orientations in magnetic field are listed in Table 1. We find similar values of frequencies and masses for different samples when the magnetic field is aligned along the axis in the HT phase. All masses were small, below , suggesting that they originate from rather wide and bands with Ir and Te character Pascut et al. (2014); Fang et al. (2013).
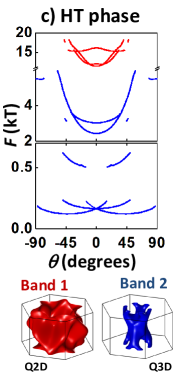
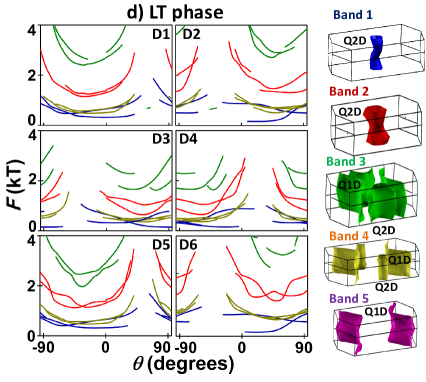
In order to be able to determine the shape of the Fermi surface we need to understand the overall angular dependence of the observed frequencies in IrTe2. Figs. 3a) and b) show detailed angular dependence of the observed dHvA frequencies plotted as a colour map of the FFT amplitude for samples S1 and S2, respectively. We observe that the frequencies are periodic over , but have no further symmetry. In the case of a Q2D Fermi surface, one would expect frequency branches with minima at and an dependence, which would disappear before reaching [see Fig. 3c)]. We have calculated the expected frequencies for the HT rhombohedral Q3D Fermi surface that is composed of a strongly corrugated cylindrical Fermi surface dominated by the Ir orbitals [band 1 in Fig. 3c)] and a complex inner band of predominantly Te orbital character (band 2 in Fig. 3c). The outer band 1 produces frequencies in excess of 10 kT [see Fig. 3c)] and rather heavy masses (1.5 to 1.8 ) that are much larger than those observed experimentally. However, the inner band shows a mixture of Q2D Fermi surfaces with frequencies below 5 kT, and Q3D ones with frequencies below 1 kT that extend over the entire angular range, shown in Fig. 3c). The calculated frequencies and masses for the inner band (band 2) are in a similar range to those we observe experimentally, but the number of frequencies, their angular dependence and the lack of symmetry around suggest that the Fermi surface of IrTe2 in the LT phase is quite different to that of the HT phase, and originates from a lower symmetry structure. Moreover, our frequency spectra have minima away from the rhombohedral axes, either close to or for S1 [indicated by the dashed lines in Fig. 3a) and b)], suggesting that the in the LT phase axis is tilted relative to that of the HT phase. The most likely reason for this behaviour is the unusual electronic structure resulting from the -modulated triclinic structure Pascut et al. (2014) (Fig. 1a)), also suggested by our X-ray diffraction data on the same crystals [Fig. 1b)]. The predicted Fermi surface in the LT phase is shown in Fig.3d), and is composed of multiple Q2D bands as well as Q1D bands (the latter would not give any quantum oscillation signal due to the lack of closed extremal orbits for any orientation of the magnetic field). As the symmetry axis for the quasi-two dimensional bands is tilted away from the HT direction, we would expect the location of the minima in frequency to be significantly shifted, as we see in experiments.
While cooling through the phase transition at , single crystals of IrTe2 are prone to domain formation, as the direction of dimerisation must be chosen while changing symmetry Pascut et al. (2014). The rhombohedral space group has twelve symmetry operations, while the triclinic has two; upon cooling from to six possible domains can form [see Supplementary Material (SM)]. Using the bandstructure calculations for the dimerized state of IrTe2 Pascut et al. (2014), we have calculated the predicted dHvA frequencies for the different domains, as shown in Fig. 3d). We find that the simulated spectra of frequencies show local minima in different locations for different domains, and this helps us to identify which domains are present in our crystals.
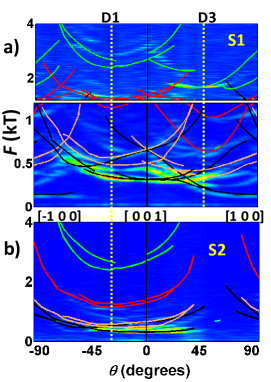
In Fig. 3a) we compare the measured frequencies for sample S1 with those calculated for each domain, and a good fit is found by considering two domains [domain D1 with local minima in frequency at and domain D3 with local minima at , indicated by the dotted lines in Fig.3a)]. The torque data for Sample S2 can be described by the presence of a single domain, domain D1, as shown in Fig.3b), in good agreement with the X-ray data shown in Fig. 1b). However, in sample S1 the two domains revealed by the torque measurements were also present in the low temperature x-ray measurements [Fig. 1b)].
Comparisons of calculated frequencies and effective masses with our experimental data for different orientations are listed in Table 1. The calculated values of the frequencies and masses are in the same range as those measured for sample S1. We find that the smallest measured orbit of 120 T matches well with the smallest possible calculated orbit of 190 T in the structure and there is overall good agreement between the measured and calculated values. No significant mass enhancement above the band mass is detected, as shown in Table 1. We can account for all four Q2D sheets of the Fermi surface in the LT phase, but we notice that the measured frequencies of band 4 are consistently T smaller than simulations, suggesting that this Q2D cylinder is slightly smaller than those predicted by calculations; this effect may be due to small variation in the lattice parameters, as calculations are considering a LT structure at 220 K Pascut et al. (2014) and further variations in amplitudes for sample S2 as compared with sample S1 are due to the smaller crystal size 222For large and , the exponential damping of the dHvA signal due impurity scattering will hamper the observation of those dHvA oscillations, as compared with small and . Any small misalignment of the samples could cause small shifts in the positions of the dHvA frequencies. The presence of a quasi-two dimensional Fermi surface tilted away from the main cleaving planes is likely to have a detrimental effect on surface sensitive probes, such as ARPES, where the underlying Fermi surface of IrTe2 in the VBS would be obscured due to the strong dispersion Qian et al. (2013).
| calculations | experiment | calculations | experiment | |||||
| (T) | () | (T) | () | (T) | () | (T) | () | |
| 1a | 318 | 0.27 | 303(1) | 0.34(1) | 194 | 0.33 | 164(2) | 0.50(1) |
| 1b | 655 | 0.59 | 689(7) | 0.56(1) | 461 | 0.34 | 357(1) | 0.34(1) |
| 4a | 508 | 0.29 | 420(1) | 0.31(1) | 354 | 0.27 | 246(9) | 0.27(1) |
| 4b | 667 | 0.42 | 588(3) | 0.47(1) | 523 | 0.38 | - | - |
| 2a | 1305 | 0.73 | 1266(4) | 0.72(5) | 640 | 0.55 | 607(1) | 0.48(1) |
| 2b | 1426 | 0.88 | 1530(10) | 0.89(2) | 1032 | 0.58 | 1024(6) | 0.66(2) |
| 3a | 2705 | 0.77 | - | - | 658 | 0.58 | 674(10) | 0.47(1) |
| 3b | 2911 | 1.20 | 2968(8) | 0.98(1) | 1742 | 0.53 | 1688(8) | 0.57(1) |
To summarize, we have experimentally determined the Fermi surface of IrTe2 in the valence-bond state as being quasi-two dimensional with the symmetry axis tilted away from that of the high temperature layered structure, in good agreement with the first-principles band structure calculations. The measured effective masses are very light and close to the the calculated band masses, suggesting that electronic correlations do not play an important role in IrTe2. To fully describe our data the contribution of different domains, which form through the structural phase transition, needs to be considered. These results confirm that below the structural transition IrTe2 becomes a weakly correlated metal with a tilted quasi-two dimensional electronic structure in its valence-bond state.
We thank Robert Schoonmaker for computational support. This work was supported by EPSRC (EP/L001772/1, EP/I004475/1, EP/I017836/1) and part of the work was performed at the HFML/RU-FOM, member of the European Magnetic Field Laboratory (EMFL). AIC acknowledges an EPSRC Career Acceleration Fellowship. G.L.P. was supported by the NSF under Grant No. DMR-1004568, and V.K. by NSF DMREF Grant No. 12-33349.
References
- Rossnagel (2011) K. Rossnagel, Journal of Physics: Condensed Matter 23, 213001 (2011).
- Morosan et al. (2006) E. Morosan, H. W. Zandbergen, B. S. Dennis, J. W. G. Bos, Y. Onose, T. Klimczuk, A. P. Ramirez, N. P. Ong, and R. J. Cava, Nature Physics 2, 544 (2006).
- Kiss et al. (2007) T. Kiss, T. Yokoya, A. Chainani, S. Shin, T. Hanaguri, M. Nohara, and H. Takagi, Nature Physics 3, 720 (2007).
- Castro Neto (2001) A. Castro Neto, Phys. Rev. Lett. 86, 4382 (2001).
- Inosov et al. (2008) D. S. Inosov, V. B. Zabolotnyy, D. V. Evtushinsky, A. A. Kordyuk, B. Buechner, R. Follath, H. Berger, and S. V. Borisenko, NEW JOURNAL OF PHYSICS 10 (2008), 10.1088/1367-2630/10/12/125027.
- Dai et al. (2014) J. Dai, E. Calleja, J. Alldredge, X. Zhu, L. Li, W. Lu, Y. Sun, T. Wolf, H. Berger, and K. McElroy, Phys. Rev. B 89, 165140 (2014).
- Fang et al. (2013) A. Fang, G. Xu, T. Dong, P. Zheng, and N. Wang, Sci. Rep. 3, 1153 (2013).
- Ootsuki et al. (2012) D. Ootsuki, Y. Wakisaka, S. Pyon, K. Kudo, M. Nohara, M. Arita, H. Namatame, M. Taniguchi, N. Saini, and T. Mizokawa, Phys. Rev. B 86, 014519 (2012).
- Pyon et al. (2012) S. Pyon, K. Kudo, and M. Nohara, J. Phys. Soc. Jpn. 81, 053701 (2012).
- Yang et al. (2012) J. J. Yang, Y. J. Choi, Y. S. Oh, A. Hogan, Y. Horibe, K. Kim, B. I. Min, and S. W. Cheong, Phys. Rev. Lett. 108, 116402 (2012).
- Kudo et al. (2013) K. Kudo, M. Kobayashi, S. Pyon, and M. Nohara, J. Phys. Soc. Jpn. 82, 085001 (2013).
- Matsumoto et al. (1999) N. Matsumoto, T. Kouji, R. Endoh, H. Takano, and S. Nagata, J. Low Temp. Phys. 117, 1129 (1999).
- Oh et al. (2013) Y. S. Oh, J. J. Yang, Y. Horibe, and S. W. Cheong, Phys. Rev. Lett. 110, 127209 (2013).
- Qian et al. (2013) T. Qian, H. Miao, Z. J. Wang, X. Liu, X. Shi, Y. B. Huang, P. Zhang, N. Xu, P. Richard, M. Shi, M. H. Upton, J. P. Hill, G. Xu, X. Dai, Z. Fang, H. C. Lei, C. Petrovic, A. F. Fang, N. L. Wang, and H. Ding, (2013), arXiv:1311.4946 .
- Ootsuki et al. (2013) D. Ootsuki, S. Pyon, K. Kudo, M. Nohara, M. Horio, T. Yoshida, A. Fujimori, M. Arita, H. Anzai, H. Namatame, M. Taniguchi, N. Saini, and T. Mizokawa, J. Phys. Soc. Jpn. 82, 093704 (2013), arXiv:1207.2613v1 .
- Mizuno et al. (2002) K. Mizuno, K. Magishi, Y. Shinonome, T. Saito, K. Koyama, N. Matsumoto, and S. Nagata, Physica B 312, 818 (2002).
- Kiswandhi et al. (2013) A. Kiswandhi, J. S. Brooks, H. B. Cao, J. Q. Yan, D. Mandrus, Z. Jiang, and H. D. Zhou, Phys. Rev. B 87, 121107 (2013).
- Pascut et al. (2014) G. L. Pascut, K. Haule, M. J. Gutmann, S. A. Barnett, A. Bombardi, S. Artyukhin, D. Vanderbilt, J. J. Yang, S. W. Cheong, and V. Kiryukhin, Phys. Rev. Lett. 112, 086402 (2014), 1309.3548 .
- Cao et al. (2013) H. Cao, B. C. Chakoumakos, X. Chen, J. Yan, M. A. Mcguire, H. Yang, R. Custelcean, H. Zhou, D. J. Singh, and D. Mandrus, Phys. Rev. B 88, 115122 (2013).
- Hsu et al. (2013) P. J. Hsu, T. Mauerer, M. Vogt, J. J. Yang, S. Oh, S. W. Cheong, M. Bode, and W. Wu, Phys. Rev. Lett. 111, 266401 (2013).
- Toriyama et al. (2014) T. Toriyama, M. Kobori, T. Konishi, Y. Ohta, K. Sugimoto, J. Kim, A. Fujiwara, S. Pyon, K. Kudo, and M. Nohara, Journal of the Physical Society of Japan 83, 033701 (2014).
- Ootsuki et al. (2014a) D. Ootsuki, T. Toriyama, M. Kobayashi, S. Pyon, K. Kudo, M. Nohara, T. Sugimoto, T. Yoshida, M. Horio, A. Fujimori, M. Arita, H. Anzai, H. Namatame, M. Taniguchi, N. L. Saini, T. Konishi, Y. Ohta, and T. Mizokawa, J. Phys. Soc. Jpn. 83, 033704 (2014a), 1311.1199 .
- Ootsuki et al. (2014b) D. Ootsuki, T. Toriyama, M. Kobayashi, S. Pyon, K. Kudo, M. Nohara, K. Horiba, K. Ono, H. Kumigashira, T. Noda, T. Sugimoto, A. Fujimori, N. L. Saini, T. Konishi, Y. Ohta, and T. Mizokawa, Phys. Rev. B 89, 104506 (2014b).
- Pyon et al. (2013) S. Pyon, K. Kudo, and M. Nohara, Physica C: Superconductivity 494, 80 (2013).
- Blaha et al. (2001) P. Blaha, K. Schwarz, G. Madsen, D. Kvasnicka, and J. Luitz, “WIEN2k, An Augmented Plane Wave + Local Orbitals Program for Calculating Crystal Properties,” (2001).
- Note (1) The cutoff for plane wave expansion in the interstitials was (convergence is reached for ) and 5472 k-points were used in the first Brillouin zone.
- Rourke and Julian (2012) P. Rourke and S. Julian, Comp. Phys. Comm. 183, 324 (2012).
- Steep et al. (1995) E. Steep, S. Rettenberger, F. Meyer, A. Jansen, W. Joss, W. Biberacher, E. Bucher, and C. Oglesby, Physica B: Condensed Matter 204, 162 (1995).
- Lifshitz and Kosevich (1956) L. Lifshitz and A. Kosevich, Sov. Phys. JETP 2, 636 (1956).
- Note (2) For large and , the exponential damping of the dHvA signal due impurity scattering will hamper the observation of those dHvA oscillations, as compared with small and . Any small misalignment of the samples could cause small shifts in the positions of the dHvA frequencies.