Galaxy Evolution in the Mid-infrared Green Valley: a Case of the A2199 Supercluster
Abstract
We study the mid-infrared (MIR) properties of the galaxies in the A2199 supercluster at to understand the star formation activity of galaxy groups and clusters in the supercluster environment. Using the Wide-field Infrared Survey Explorer data, we find no dependence of mass-normalized integrated SFRs of galaxy groups/clusters on their virial masses. We classify the supercluster galaxies into three classes in the MIR color-luminosity diagram: MIR blue cloud (massive, quiescent and mostly early-type), MIR star-forming sequence (mostly late-type), and MIR green valley galaxies. These MIR green valley galaxies are distinguishable from the optical green valley galaxies, in the sense that they belong to the optical red sequence. We find that the fraction of each MIR class does not depend on virial mass of each group/cluster. We compare the cumulative distributions of surface galaxy number density and cluster/group-centric distance for the three MIR classes. MIR green valley galaxies show the distribution between MIR blue cloud and MIR SF sequence galaxies. However, if we fix galaxy morphology, early- and late-type MIR green valley galaxies show different distributions. Our results suggest a possible evolutionary scenario of these galaxies: 1) Late-type MIR SF sequence galaxies 2) Late-type MIR green valley galaxies 3) Early-type MIR green valley galaxies 4) Early-type MIR blue cloud galaxies. In this sequence, star formation of galaxies is quenched before the galaxies enter the MIR green valley, and then morphological transformation occurs in the MIR green valley.
Subject headings:
galaxies: clusters: individual (Abell 2199)–galaxies: groups: general–galaxies: evolution–infrared: galaxies1. Introduction
Color bimodality of galaxies appears in several wavelengths including the optical (Strateva et al., 2001; Baldry et al., 2004; Choi et al., 2007), ultraviolet (Wyder et al., 2007; Brammer et al., 2009), and mid-infrared (MIR) bands (Johnson et al., 2007; Walker et al., 2013). In optical color-magnitude diagrams galaxies are often separated into two classes: a red sequence and a blue cloud. The evolution between the two populations is one of the key issues in the recent study of galaxy formation and evolution (Faber et al., 2007; Tinker et al., 2013).
Galaxies in a region between the red sequence and the blue cloud (i.e., green valley) seem to be an important population to understand this evolution. They might be in a transition phase from the blue cloud toward the red sequence; the transition would occur during a short timescale less than 1 Gyr (Springel et al., 2005; Faber et al., 2007; Pan et al., 2013). Recently, Schawinski et al. (2014) suggested that the green valley galaxies are not in a single transitional state from the blue cloud toward the red sequence. They found that early- and late-type galaxies in the green valley of optical color-mass diagrams have significantly different ultravioletoptical colors. They pointed out that this color difference could be explained by different quenching timescales of star formation; quenching timescale for early-type galaxies ( Myr) is much shorter than that for late-type galaxies ( Gyr).
Galaxies can also be divided into several classes based on MIR colors such as AKARI (Shim et al., 2011; Ko et al., 2012) and Spitzer IRAC (Johnson et al., 2007; Walker et al., 2013). These MIR colors are useful indicators of specific star formation rates (Duc et al., 2002; Chung et al., 2011) and of mean stellar ages (Piovan et al., 2003; Temi et al., 2005; Ko et al., 2009). For example, Hwang et al. (2012a, hereafter H12) studied the galaxies of the A2199 supercluster in the color versus 12 luminosity diagram using the Wide-field Infrared Survey Explorer (WISE, Wright et al., 2010) data. They found that early- and late-type galaxies are well separated into two groups; late-type galaxies with MIR red colors form the “MIR star-forming (SF) sequence”, but early-type galaxies mainly form the “MIR blue cloud”.
As in the optical color-magnitude diagrams, galaxies with intermediate MIR colors seem to be transition populations (e.g., Shim et al. 2011; Ko et al. 2012, 2013). Recently, Alatalo et al. (2014) defined the infrared transition zone in the WISE color space, and suggested that the galaxies in this zone are in the late stages of transition across the optical green valley. However, how this transition differs depending on galaxy morphology is not well understood. This is the goal of this study; we define “MIR green valley” galaxies in the MIR color-luminosity diagram, and study their properties in connection to other populations.
On the other hand, galaxy properties including the star formation activity and the galaxy morphology are strongly affected by environment (Park et al., 2007; Blanton & Moustakas, 2009). Galaxy clusters are an ideal place to study this environmental dependence of galaxy properties, and several physical mechanisms in the cluster environment have been proposed to explain the dependence: ram pressure stripping (Gunn & Gott, 1972), thermal evaporation (Cowie & Songaila, 1977), strangulation (Larson et al., 1980), galaxy harassment (Moore et al., 1996), starvation (Bekki et al., 2002), and cumulative galaxy-galaxy hydrodynamic/gravitational interactions (Park & Hwang, 2009).
| ID | SDSS ObjID (DR7) | R.A. (J2000) | Decl. (J2000) | Morpha | |||||
|---|---|---|---|---|---|---|---|---|---|
| 1 | 587725992501969046 | 16:46:57.61 | 41:56:22.7 | 0.032715 | 2 | 9.703 | 1.075 | 1.288 | 1.257 |
| 2 | 587725992503017882 | 16:53:52.93 | 39:49:46.7 | 0.033889 | 1 | 9.816 | 2.543 | 0.035 | 1.655 |
| 3 | 587725992503017689 | 16:53:56.32 | 39:48:45.4 | 0.033287 | 1 | 10.794 | 2.876 | 0.049 | 1.961 |
| 4 | 587725992502820896 | 16:52:29.10 | 40:18:43.0 | 0.029247 | 1 | 10.765 | 2.857 | 0.140 | 2.006 |
| 5 | 587725993036939572 | 16:36:03.51 | 45:44:47.6 | 0.030912 | 2 | 10.524 | 2.027 | 1.188 | 1.750 |
Note. — a Morphology classification: 1- Early types (E/S0), 2- Late types (S/Irr). b Extinction-corrected
| ID | WISE ID | (S/N)12µm | MIRcla | logSFRWISE | (S/N)22µm | ||
|---|---|---|---|---|---|---|---|
| 1 | J164657.63+415622.9 | 1.389 | 8.564 | 21.60 | 3 | 0.683 | 6.30 |
| 2 | J165352.94+394946.7 | 7.680 | 1.40 | 0 | 0.255 | ||
| 3 | J165356.33+394845.4 | 8.106 | 8.40 | 1 | 0.404 | 3.30 | |
| 4 | J165229.09+401843.0 | 8.096 | 11.40 | 1 | 0.311 | 1.20 | |
| 5 | J163603.52+454447.8 | 0.406 | 8.753 | 34.20 | 3 | 0.739 | 7.70 |
Note. — a MIR classification: 0- (S/N), 1- MIR blue cloud galaxies, 2- MIR green valley galaxies, 3- MIR star-forming sequence galaxies.
Some cluster galaxies might have experienced the environmental effects even before they enter the cluster regions. For example, Zabludoff & Mulchaey (1998) suggested that massive early-type galaxies are formed by galaxy-galaxy mergers in group-scale environment, and then fall into clusters later. The galaxy interactions and mergers should be very frequent and effective because of low velocity dispersion of galaxies in the group environment (Hickson et al., 1992; Sohn et al., 2013). This “pre-processing” in groups is supported by numerical simulations (Fujita, 2004) and by observations (Koyama et al., 2011; Lemaux et al., 2012; Hess & Wilcots, 2013; Mahajan, 2013). Therefore, it is important to study the galaxies in galaxy groups to better understand the environment effects on galaxy properties.
Because superclusters of galaxies contain several clusters and groups, they can be excellent laboratories for studying the environmental dependence of galaxy properties in a full range of environment from cluster to field (e.g., Haines et al. 2011; Biviano et al. 2011). In this study, we use a multiwavelength catalog of the galaxies in the A2199 supercluster at to study the MIR properties of galaxies and their environmental dependence. The main goal is to examine how the galaxies in the MIR green valley differ from other populations as a function of environment.
§2 describes the observational data we use. We derive physical parameters of the groups and clusters in the A2199 supercluster in 3. We investigate the dependence of mass-normalized integrated star formation rates (SFRs) of galaxy groups and clusters on their virial masses in 4. We classify the galaxies in the MIR color-luminosity diagram, and study the environmental dependence of their MIR properties in 5. We discuss our results in 6, and conclude in 7. Throughout, we adopt flat CDM cosmological parameters: , , and .
2. Data
We used the galaxy catalog of the A2199 supercluster given by H12. H12 compiled the multi-wavelength data of the galaxies at from the Sloan Digital Sky Survey Data Release 7 (Abazajian et al., 2009) and the WISE data. The WISE provides all-sky survey data in four MIR bands (3.4, 4.6, 12, and 22 ) with a much better sensitivity than previous infrared surveyors. Thus, the data cover the entire region of the A2199 supercluster at ().
H12 selected member galaxies using the caustic method (Diaferio & Geller, 1997; Diaferio, 1999; Serra et al., 2011). They also compiled redshift data for the galaxies fainter than from other large spectroscopic surveys (Rines et al., 2002; Rines & Geller, 2008). However, these surveys cover only the central region ( arcmin) of the A2199 supercluster. Therefore, we did not use these faint galaxies, but used the galaxies at to have a galaxy sample with uniform depth in the entire supercluster region. The final sample contains 1529 member galaxies including 559 early-type (E/S0) and 970 late-type galaxies (S/Irr).
Galaxy morphology information is mainly from the Korea Institute for Advanced Study (KIAS) DR7 value-added galaxy catalog (Choi et al., 2010). The morphology information is based on the automatic classification by Park & Choi (2005), which uses color, color gradient, and −band concentration index. The completeness and reliability of this method are . H12 conducted an additional visual inspection to improve the classification results and to classify the galaxies not included in the KIAS DR7 value-added galaxy catalog. The detailed description of the galaxy catalog is in H12.
All the 1529 member galaxies are detected at the WISE 3.4 and 4.6 with signal-to-noise ratio . However, there are 1151 (75.3%) and 552 galaxies (36.1%) among the members detected at 12 and 22 with , respectively. We provide physical parameters of the member galaxies used in this paper. Table 1 lists SDSS-related parameters, and Table 2 lists WISE-related parameters.
3. Galaxy Groups and Clusters in the A2199 Supercluster
| R.A.2000 | Decl.2000 | |||||||
|---|---|---|---|---|---|---|---|---|
| System | (J2000) | (J2000) | [] | [] | [degree] | [Mpc] | [] | [] |
| A2199 | 16:28:38 | 39:33:05 | 9140135 | 67535 | 0.730.04 | 1.650.09 | 3.160.48 | 44.1 |
| A2197W | 16:27:41 | 40:55:40 | 9482144 | 53722 | 0.580.02 | 1.310.05 | 1.630.19 | 42.5 |
| A2197E | 16:29:43 | 40:49:12 | 8767 88 | 54322 | 0.590.02 | 1.320.05 | 1.680.20 | 42.4 |
| NRGs385 | 16:17:43 | 34:58:00 | 9321100 | 42621 | 0.460.02 | 1.040.05 | 0.830.12 | 42.8 |
| NRGs388 | 16:23:01 | 37:55:21 | 9399146 | 54933 | 0.600.04 | 1.340.08 | 1.740.30 | 42.3 |
| NRGs396 | 16:36:50 | 44:13:00 | 9507110 | 24433 | 0.260.04 | 0.600.08 | 0.170.07 | 42.0 |
| NGC 6159 | 16:27:25 | 42:40:47 | 9397 94 | 24331 | 0.260.03 | 0.590.08 | 0.160.06 | 42.3 |
The A2199 supercluster at contains several galaxy groups and clusters. Rines et al. (2001, 2002) identified seven galaxy systems including three clusters (A2199, A2197W/E) and four X-ray bright groups (NRGs385, NRGs388, NRGs396, and the NGC 6159 group). They derived the physical parameters of these systems. Figure 6 displays the spatial distribution of three clusters and groups. The A2199 supercluster covers a wide range of environment: e.g., if we define the environment by the galaxy surface number density (see §5.3 for details). The density range is wider than the range that we used in the study of A2255 (Shim et al., 2011).
A2199 is located in the center of the supercluster. It is a typical (rich and regular) cluster of galaxies in the nearby universe. The X-ray emission around A2199 is quite symmetric, suggesting that A2199 did not experience recent major merger (Rines et al., 2001). There is a cooling flow and a radio jet in A2199 (Markevitch et al., 1999; Johnstone et al., 2002; Kawano et al., 2003), which may be associated with a cD galaxy, NGC 6166 (Kelson et al., 2002).
Because we have recent redshift data for the supercluster, we recalculate some physical parameters of these systems. For example, we compute the mean redshifts, (biweight location of Beers et al. 1990), using the galaxies at Mpc of each system. The radius for computing the mean redshifts is small enough so that the galaxy systems do not overlap each other, as used in Rines et al. (2002). We also compute the projected velocity dispersions, (biweight scale of Beers et al. 1990), using the galaxies at Mpc. We use this radius, smaller than the one used in Rines et al. (2002) (i.e., 1.5 Mpc), to avoid the overlap between the systems. If we use Mpc aperture, changes within the uncertainty.
Our estimates of for the systems in the A2199 supercluster are in the range ; these agree well with previous measurements in Rines et al. (2002). On the other hand, our ranges from to ; these are on average smaller than previous measurements in Rines et al. (2002). This difference seems to result mainly from the difference in the data. For example, of A2199 in this study is . This is smaller than in Rines et al. (2002), but is similar to in Rines & Diaferio (2006) who used the same SDSS data. Table 3 lists our measurements of and for each system.
To estimate the size of each system, we convert into (approximately the virial radius) using the formula given in Carlberg et al. (1997). We then determine the virial mass () of each system using the relation given in Rines et al. (2013): . The derived values of and of A2199 are Mpc and , respectively. These values agree well with the estimates in Rines & Diaferio (2006): Mpc and ). The for other systems in the A2199 supercluster are in the range , similar to the masses of galaxy groups at (Rines & Diaferio, 2010). Table 3 lists and of the groups and clusters in the A2199 supercluster.
4. Integrated SFRs of Galaxy Systems in the A2199 Supercluster
| Galaxy | ||||||||||
|---|---|---|---|---|---|---|---|---|---|---|
| System | ||||||||||
| A2199 | 3 | 15 | 34 | |||||||
| A2197W | 0 | … | … | 12 | 33 | |||||
| A2197E | 1 | 12 | 37 | |||||||
| NRGs385 | 0 | … | … | 6 | 12 | |||||
| NRGs388 | 0 | … | … | 4 | 15 | |||||
| NRGs396 | 0 | … | … | 2 | 6 | |||||
| NGC 6159 | 0 | … | … | 2 | 2 | |||||
To study the dependence of the star formation activity of clusters on cluster mass, many studies have used the mass-normalized integrated SFRs of clusters (i.e., ) as a proxy for the global SFRs (e.g., Finn et al., 2005; Geach et al., 2006; Bai et al., 2007, 2009; Chung et al., 2010; Koyama et al., 2010; Shim et al., 2011; Biviano et al., 2011; Chung et al., 2011). In this section, we study this dependence for the galaxy systems in the A2199 supercluster using the WISE data.
To compute the integrated SFR of each system, we use the SFRs of galaxies converted from total IR () luminosities (). We compute the total IR luminosities of galaxies using the WISE 22 flux densities and the spectral energy distribution templates of Chary & Elbaz (2001). Following H12, we use the relation in Kennicutt (1998) for the conversion of the total IR luminosities into SFRs with the assumption of a Salpeter (1955) initial mass function with a power law index : . These IR-based SFRs () of galaxies agree well with those derived from the optical spectra (H12; Hwang et al. 2012b; J.C.Lee et al. 2013).
To have a fair comparison with other studies (e.g., Finn et al., 2005; Bai et al., 2007, 2009), we first use the same selection criteria adopted in other studies to compute the integrated SFRs (i.e., and ). We do not include active galactic nucleus (AGN)-host galaxies such as Seyferts, LINERs, Type I AGNs with broad Balmer lines (FWHM ) and MIR-selected AGNs (, H12) because their (based on the WISE 22 flux densities) can be dominated by AGN rather than by star formation (Brand et al., 2009; J.C.Lee et al., 2012). However, we include composite galaxies because the AGN contribution to the 22 flux densities in these galaxies is small () (J.C.Lee, 2012).
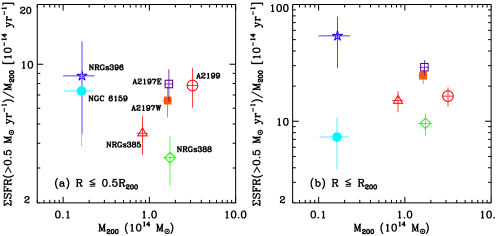
As listed in Table 4, we could obtain only for two galaxy systems: for A2199 and for A2197E in unit of . These values are similar to other clusters at similar redshifts (e.g., Coma and A1367, Bai et al., 2007). However, we could not determine for the other systems because there are no galaxies satisfying the selection criteria (i.e., and ). It also should be noted that for A2199 and A2197E are based only on a small number of galaxies (i.e., three and one galaxies for A2199 and A2197E, respectively).
Thus, we change the selection criteria to increase the sample size: and . Most galaxies with are detected at 22 with (94%), suggesting no significant bias due to incompleteness. This limit is much lower than the one used in a recent study based on similar WISE data (e.g., in Chung et al. 2011).
Table 4 lists and of each system based on samples of galaxies with . We derive the values for two cases: and . Figure 1(a) shows that for does not depend on . Similarly, for in panel (b) does not show dependence. The Spearman’s coefficient for the data in panel (a) is , while that in panel(b) is 0.07. In addition, the probability of obtaining the correlation by chance is over 70% in the both case. These results suggest that there is no significant correlation between and .
5. MIR Properties of Galaxies in Galaxy Systems of the A2199 Supercluster
To compare the star formation activity of galaxy systems in the A2199 supercluster in detail, we investigate the MIR properties of the galaxies in each system in this section. We first divide galaxies into three MIR classes in the MIR color-luminosity diagram (§5.1), and then compute the fraction of galaxies in each MIR class for the galaxy groups/clusters in the A2199 supercluster (§5.2). We also examine the environmental dependence of the MIR properties of galaxies in §5.3.
5.1. Galaxy Classification in the MIR color-luminosity Diagram
The MIR colors such as AKARI or WISE , are useful indicators of the specific SFRs and of the presence of intermediate-age stellar populations (e.g., M.G.Lee et al. 2009; Ko et al. 2009, 2012, 2013; Shim et al. 2011; Donoso et al. 2012,H12). WISE colors are also a good indicator of the specific SFRs because 3.4 and 12 luminosities, respectively, trace stellar masses and SFRs (Donoso et al., 2012; Hwang et al., 2012b). The other WISE colors including , , and can also be used. However, we use in this study because 3.4 probes the old stellar components better than than 4.6 , and 12 sensitivity is better than 22 .
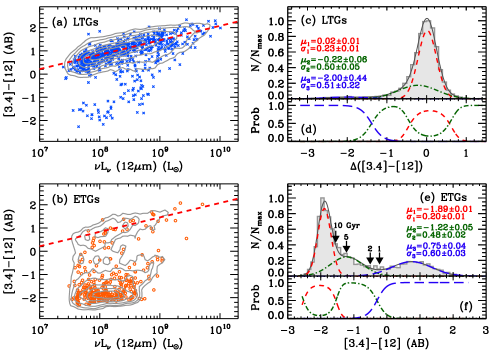
The left panels in Figure 2 show the distribution of galaxies in the versus 12 luminosity diagram. As shown in H12, late-type SF galaxies form a linear “MIR SF sequence”, while most early-type galaxies form a “MIR blue cloud” with low 12 luminosities. For robust classification of the galaxies in this diagram, we use a large sample of SDSS galaxies at including the A2199 supercluster galaxies. The contours in Figure 2(a) and (b) indicate the number density distributions of early- and late-type galaxies, respectively. The linear fit to this large galaxy sample gives a relation,
| (1) |
This relation is similar to the one derived in H12, but based on a much larger sample.
We plot the distribution of vertical offsets of late-type galaxies from the MIR SF sequence, , in panel (c). The histogram is negatively skewed. We use the Gaussian mixture modeling (GMM, Muratov & Gnedin, 2010) to decompose the histogram with multi-Gaussian functions. The histogram is well described by the sum of three Gaussians rather than the sum of two Gaussians. We overplot the three Gaussians with their sum, and list the mean and standard deviation of each Gaussian.
Figure 2(d) shows the probability distribution from the GMM that indicates which Gaussian galaxies should belong to. At , the probability that galaxies belong to the left Gaussian (long-dashed line) is larger than 50%. At , the probability that galaxies belong to the middle Gaussian is over 50%. We adopt to separate the galaxies in the left tail from the majority of late-type, SF galaxies.
On the other hand, the majority of early-type galaxies are distributed around , which is the MIR blue cloud. Some early-type galaxies have MIR colors, much redder than the MIR blue cloud. Figure 2(e) shows the distribution of colors for early-type galaxies at . The histogram is well described by the sum of three Gaussians. The Gaussian in the left covers a narrow color range centered at (i.e., MIR blue cloud). The Gaussians in the middle and right are for those in the green valley (to be defined in this section) and in the MIR SF sequence, respectively.
We overplot the predicted colors from the single stellar population models (SSP) of Piovan et al. (2003). This model considers the MIR emission from dusty circumstellar envelops of asymptotic giant branch stars when constructing spectral energy distribution of early-type galaxies. Four arrows indicate mean stellar ages of 1, 2, 5, and 10 Gyr (, , , and ). This suggests that the Gaussian in the left mainly traces the galaxies with stellar populations older than 10 Gyrs, while the Gaussian in the middle traces the galaxies with intermediate-age stellar populations.
To separate the early-type galaxies with intermediate and old stellar populations, we adopt a cut of that corresponds to the color of 10 Gyr stellar populations. This color cut is the one where the probability that the galaxies belong to the Gaussian in the left becomes larger than 50%, as shown in panel (f).
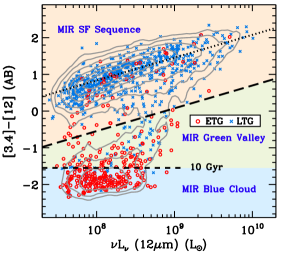
Based on the results in Figure 2, we divide the galaxies into three MIR classes in the MIR color-luminosity diagram as shown in Figure 3. We use two demarcation lines, from the MIR SF sequence and . We call the galaxies at from the MIR SF sequence “MIR SF sequence galaxies”, and those with “MIR blue cloud galaxies”. Then the galaxies between the two lines are “MIR green valley galaxies”.
Among 997 member galaxies in this diagram, the number of MIR SF sequence, MIR green valley, and MIR blue cloud galaxies are 678 (), 126 (), and 193 (), respectively. The majority (93%, 628/678) of MIR SF sequence galaxies are morphologically late types. In contrast, MIR blue cloud galaxies are mainly (90%, 174/193) early types. Two-thirds of MIR green valley galaxies are early-type galaxies (68%, 86/126), and one third of them are late types (40/126).
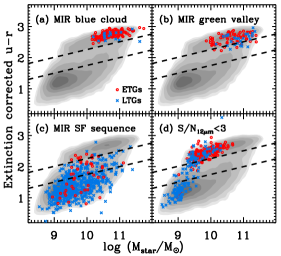
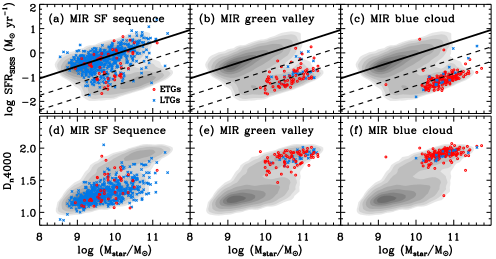
To compare the MIR classification with that in the optical bands, we plot the galaxies in each MIR class in the optical color-mass diagram. Figure 4 shows an extinction-corrected color as a function of stellar mass. To correct for dust extinction, we use E(B-V) values from the stellar continuum fits of Oh et al. (2011) and apply the reddening law of Cardelli et al. (1989). Grayscale contours indicate the number density of the SDSS galaxies at . Two dashed lines define the optical green valley adopted from Schawinski et al. (2014).
As expected, MIR SF sequence galaxies are mainly distributed in the optical blue cloud (see panel c). Some of them are in the optical green valley. MIR blue cloud galaxies are distributed in the optical red sequence (panel a). Interestingly, the majority of MIR green valley galaxies roughly follow the optical red sequence despite a scatter in color (panel b). These are consistent with the results in other studies (Ko et al., 2012; Walker et al., 2013).
The stellar mass range of MIR green valley galaxies is nearly the same as that of MIR blue cloud galaxies (). This means that the discrimination between MIR blue cloud and MIR green valley galaxies based only on optical parameters is difficult. It is interesting to note that the MIR green valley galaxies are not the same as the optical green valley galaxies. The optical green valley galaxies are included in the MIR SF sequence class. Panels (a-c) also show that the distributions of early- and late-type galaxies in each panel are not significantly different.
In panel (d) we plot the distribution of 12 undetected galaxies (i.e., ); they are not included in the MIR classification. They are distributed either in the optical blue cloud or in the red sequence. They appear to have stellar masses lower than other MIR classes in a fixed morphology. The majority () of the 12 undetected galaxies have no strong emission lines in their optical spectra; most of their spectral types are undetermined. These results suggest that they are a mixture of young galaxies with small stellar masses and of relatively massive galaxies that are quiescent; both of them have 12 flux densities, not high enough to be detected with WISE.
We also show the galaxies in each MIR class in the plot of SFR derived in the optical band and stellar mass (see top panels of Figure 5). We use adopted from the MPA/JHU DR7 value-added galaxy catalog (Brinchmann et al., 2004). The grayscale number density contours based on the galaxies at show two distinctive sequences. The upper sequence (solid lines) is for SF galaxies, which is called a “main sequence” of SF galaxies (Noeske et al., 2007; Elbaz et al., 2011). The lower sequence is for those with SFRs much smaller than the main sequence galaxies.
As expected, MIR SF sequence galaxies are well distributed along the main sequence (panel a). In contrast, MIR blue cloud galaxies are on the sequence in the bottom. Similarly, MIR green valley galaxies are mainly found on the sequence in the bottom. The SFRs of MIR green valley galaxies appear to be slightly higher than those for MIR blue cloud galaxies in a give stellar mass. However, the difference is not significant.
We also examine the distribution of for the three MIR classes in bottom panels. The is a useful measure of mean stellar age of galaxies (Balogh et al., 1999; Shim et al., 2011). Galaxies with contain young stellar populations with Gyr (Kauffmann et al., 2003). On the other hand, larger than 1.5 indicates mean stellar age larger than 1 Gyrs (Kranz et al., 2010). As expected, most MIR SF sequence galaxies have smaller than 1.5. In contrast, of the majority of the MIR green valley and MIR blue cloud galaxies is larger than 1.5. The mean of the MIR green valley galaxies () is not different significantly from that of the MIR blue cloud galaxies (). However, the rms of for the MIR green valley galaxies is larger () than that for the MIR blue cloud galaxies (), suggesting that the dispersion of mean stellar ages for the MIR green valley galaxies is larger than that for the MIR blue cloud galaxies. However, the difference in mean stellar ages between the two populations is more evident in the MIR color space.
5.2. Galaxies in groups/clusters and their MIR Classes
In this section we examine the spatial distribution of three MIR classes in the A2199 supercluster. We compute the fraction of each MIR class in galaxy groups/clusters, and examine the variation of the fraction with the mass of each system.
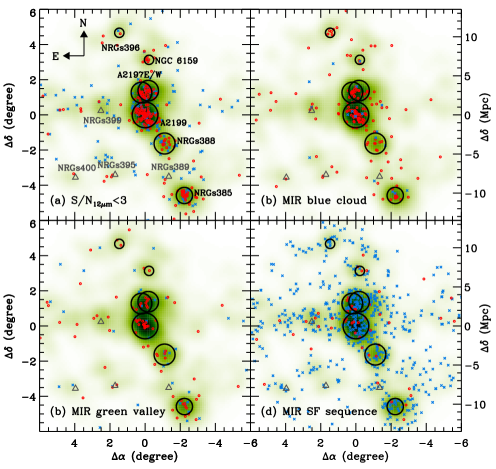
We first show the spatial distribution of galaxies in each MIR class over the entire region of the A2199 supercluster in Figure 6. We mark the positions of three clusters (A2199, A2197W/E) and four X-ray bright groups (NRGs385, NRGs388, NRGs396, and the NGC 6159 group) as thick circles. The size of circles is proportional to their virial radii (). We also mark the positions of four X-ray faint groups (NRGs389, NRGs395, NRGs399, and NRGs400, Rines et al., 2001) as triangles. To better show the clustering of galaxies, we overplot the grayscale galaxy number density map using all the member galaxies regardless of their MIR classes in each panel.
The 12 undetected galaxies (panel a) are mainly found in high-density regions. Early-type galaxies are highly concentrated in central regions of groups/clusters. Note that these early-type galaxies are in the optical red sequence with low stellar masses. Similarly, MIR blue cloud galaxies (panel b) and MIR green valley galaxies (panel c) are mainly found in groups and clusters. In contrast, MIR SF sequence galaxies are distributed over the entire supercluster region. Some of them are in groups and clusters, but they do not show a central concentration like MIR blue cloud and MIR green valley galaxies. Four X-ray faint groups do not show any significant clustering of galaxies.
We then calculate the fraction of each MIR class in the X-ray bright groups and clusters. We use the galaxies in the inner region () and in the outer region () separately. For comparison, we also calculate the fraction of each MIR class for the galaxies not associated with any group or cluster (i.e., ) in the supercluster region; these are the galaxies in “underdense regions”. We use only 12 detected galaxies for computing fractions. If we use all the galaxies to compute the fractions by including the 12 undetected galaxies, the results do not change much.
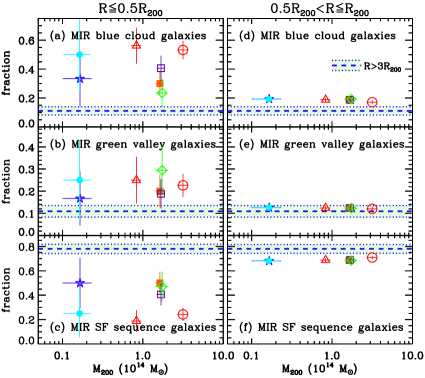
The left panels of Figure 7 show the fraction of each MIR class in the inner region as a function of of each galaxy system. The fractions of MIR blue cloud galaxies (panel a) and of MIR SF sequence galaxies (panel c) vary from to , but do not show any dependence on . The fractions of MIR green valley galaxies in the galaxy systems are similar ().
Similarly, the right panels for the galaxies in the outer region of groups/clusters show no dependence of the fraction on . One unique point is that the fraction of each MIR class is nearly the same for all groups and clusters. Although we calculate the fraction using the galaxies at of each group and cluster (i.e., sum of the left and right panels), the dependence of the fraction is not apparent.
On the other hand, panel (a) shows that the fractions of MIR blue cloud galaxies in the inner region of groups/clusters are significantly higher than in the underdense region (11.1%). However, the fractions in the outer region (panel d) are on average 18.5%, close to the fraction in the underdense region. The fraction of MIR green valley galaxies in the underdense region is 10.9% This value is smaller than those in the inner region (panel b), but is comparable to those in the outer region (panel e). The fractions of MIR SF sequence galaxies in the inner region (panel c) are much smaller than that in the underdense region (78%). However, the fractions in the outer region are close to the value in the underdense region (panel f).
Thus Figure 7 suggests that massive galaxies with low SFRs (i.e., MIR blue cloud galaxies and MIR green valley galaxies) are mainly in the inner regions of groups/clusters regardless of their . Some of them are found even in the low density regions (i.e., the underdense region), but their fraction is not significant (up to ).
5.3. Environmental Dependence based on and
To further examine the environmental dependence of the MIR classes in the A2199 supercluster, we use two environmental indicators in this section; the surface number density () and the cluster-(or group-)centric distance normalized by virial radius (). The surface number density, , is defined by , where is the projected distance to the 5th-nearest neighbor. The fifth-nearest neighbor to each galaxy is identified in the sample of A2199 supercluster member galaxies. We compare the cumulative distribution of each MIR class as function of two environmental indicators. We also use the Kolmogorov-Smirnov two-sample test to quantify the difference in the distribution if any.
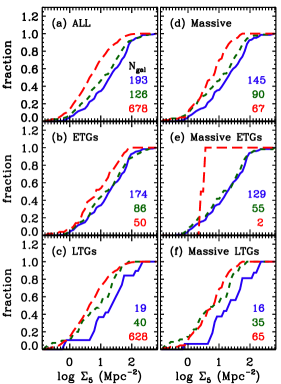
Figure 8 shows the cumulative distribution of each MIR class as a function of . Panel (a) shows the case for all the 12 detected galaxies. MIR SF sequence galaxies (red long dashed line) tend to be in low-density regions, and MIR blue cloud galaxies (blue solid line) prefer high-density regions. MIR green valley galaxies (green dashed line) are between the two. This result is consistent with the expectations from the morphology- and/or SFR-density relation (e.g., Dressler, 1980; Lewis et al., 2002; Park & Hwang, 2009; Hwang et al., 2010).
Panel (b) shows the same distribution of each MIR class, but only for early-type galaxies. It shows that the difference between MIR blue cloud and MIR green valley galaxies is noticeably reduced. The confidence level to reject the hypothesis that the two distributions are extracted from the same parent population changes from 92% in panel (a) into 52% in panel (b). This suggests that of MIR green valley early-type galaxies do not differ significantly from that of MIR blue cloud early-type galaxies. On the other hand, the cumulative distribution of MIR SF sequence early-type galaxies is still distinguishable from those of MIR blue cloud and MIR green valley early-type galaxies.
Figure 8(c) shows the cumulative distribution only for late-type galaxies. The confidence level to reject the hypothesis that the two distributions are extracted from the same parent population is 93% between MIR green valley and MIR blue cloud late-type galaxies, and is 97% between MIR green valley and MIR SF sequence late-type galaxies.
Because galaxy properties also strongly depend on stellar mass as well as on environment (Tasca et al., 2009; Hwang et al., 2010; Cucciati et al., 2010; Bolzonella et al., 2010; Peng et al., 2010; Sobral et al., 2011), we restrict our analysis to only massive galaxies with to reduce the mass effect on the MIR properties. Figure 8(d) shows the cumulative distribution for the massive galaxies with 12 detection. Although the number of galaxies in each MIR class is reduced, the result is similar to that in panel (a). Panel (e) shows the case of massive early-type galaxies. MIR blue cloud and MIR green valley galaxies again show similar distributions. However, the cumulative distribution of MIR green valley galaxies among the massive late-type galaxies (panel f) is still between MIR blue cloud and MIR SF sequence galaxies.
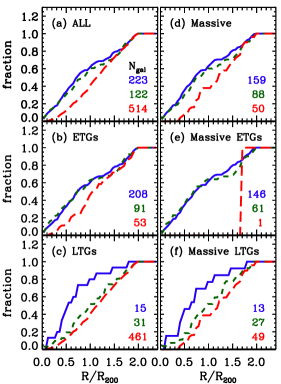
We perform similar analysis in Figure 9 using the normalized cluster/group-centric distance instead of . Panel (a) shows the cumulative distribution of each MIR class using all the 12 detected galaxies. The distribution of MIR SF sequence galaxies is significantly different from those of MIR blue cloud and MIR green valley galaxies; the hypothesis that the two distributions are extracted from the same parent population can be rejected at a confidence level of 99%. However, the distributions of MIR blue cloud and MIR green valley galaxies are very similar. They show similar distributions even if we consider only early-type galaxies in panel (b), massive galaxies in panel (d), and massive early-type galaxies in panel (e).
On the other hand, when we consider late-type galaxies, the similar distribution between MIR blue cloud and MIR green valley galaxies disappears. The confidence level to reject the hypothesis that the two distributions are extracted from the same parent population is 92% in panel (c) and is 73% in panel (f). The cumulative distribution of MIR green valley late-type galaxies appears to be similar to that of MIR SF sequence late-type galaxies, and be still between the MIR blue cloud and the MIR SF sequence galaxies (panels c and f).
Both Figures 8 and 9 give similar results. The cumulative distributions of and for MIR green valley galaxies are between those for MIR blue cloud galaxies and for MIR SF sequence galaxies. However, among early-type galaxies the difference between MIR blue cloud and MIR green valley galaxies disappears. In contrast, when considering only late-type galaxies, the MIR green valley galaxies are still between the MIR blue cloud and the MIR SF sequence galaxies.
6. Discussion
6.1. Star Formation Activity of Galaxy Systems and their Dependence on Virial Mass
We compare the star formation activity of X-ray bright galaxy groups and clusters in the A2199 supercluster using (§4) and the fraction of MIR SF sequence galaxies (§5.2). Interestingly, both and the fraction do not seem to depend on virial masses of galaxy systems (see Figures 1 and 7). This is seen both in inner () and outer regions ().
Our results are consistent with those in other studies. For example, Goto (2005) used the SDSS data for 115 nearby clusters, and found no dependence of and of blue/late-type galaxy fraction on cluster virial mass (see also Bai et al. 2009, 2010; Balogh & McGee 2010). A recent study based on WISE data for 69 clusters at also find no correlation between and (Chung et al., 2011).
No correlation between the fraction of passive (or red) galaxies and the halo masses of groups/clusters could result from a simultaneous increase in the number of member galaxies and of massive quiescent elliptical galaxies with increasing of the systems (De Lucia et al., 2012). No correlation between the two can also be explained by the pre-processing mechanism (Zabludoff & Mulchaey, 1998), which is that giant elliptical galaxies or cD galaxies are formed by galaxy-galaxy mergers in poor groups, and then fall into clusters later. This pre-processing occur in poor groups with . This results in no -dependence of the star formation activity in groups/clusters when the poor groups fall into more massive clusters with (Balogh & McGee, 2010); this covers the mass range of the galaxy systems in the A2199 supercluster.
On the other hand, some studies show that there is mass dependence of the star formation activity of galaxy groups/clusters. For example, Finn et al. (2005) and Koyama et al. (2010) found an anti-correlation between and for clusters at (see also Bai et al. 2007 and Poggianti et al. 2008). This anti-correlation is seen in clusters with that covers our galaxy systems in the A2199 supercluster. Furthermore, Popesso et al. (2012) used far-infrared Herschel data for nine clusters () and nine groups/poor clusters () at , and found that is higher for groups/poor clusters than for massive clusters at a given redshift. They suggested that this mass dependent star formation activity results from earlier quenching of the star formation activity in galaxies associated to more-massive halos (i.e., clusters).
Similarly, some studies show that the fraction of SF galaxies decreases with increasing cluster mass (e.g., Martínez et al. 2002; Rasmussen et al. 2012). Poggianti et al. (2006) used the clusters at low () and at high (), and found an anti-correlation between the fraction of SF galaxies and velocity dispersion () of the clusters; the anti-correlation is significant for low- clusters with (). Most galaxy systems in the A2199 supercluster have . However, the fraction of SF galaxies (i.e., MIR SF sequence galaxy fraction) in galaxy groups/clusters of the A2199 supercluster does not show any strong dependence on .
It seems that the mass dependence of star formation activity of groups/clusters is still inconclusive. Some previous studies used heterogeneous data with different wavelength, sky coverage, redshift and sensitivity (see Appendix of Bai et al. 2007). Finn et al. (2005) and Koyama et al. (2010) suggested that the mass dependence of appears due to the strong redshift dependence (high-z clusters have higher and smaller in their data). In addition, Poggianti et al. (2006) showed that their mass dependence of the fraction of SF galaxies becomes unclear when they used another cluster sample from Miller et al. (2005). Thus it still needs more efforts to examine whether cluster mass is a critical factor in determining their star formation activity or not.
If the star formation activity in groups/clusters indeed depends on , no -dependence for the galaxy systems in the A2199 supercluster indicates that there could be other mechanisms that have affected the star formation activity of the systems. One possible mechanism is the interaction between infall groups and the supercluster. If the star formation activity of group galaxies have gradually decreased through the gravitational and/or hydrodynamical interaction with the supercluster, the current star formation activity of the groups would depend on when the groups fell into the supercluster environment. Thus, the different infall time of the groups in the supercluster could explain the different star formation activity of groups at a given .
Similarly, the interaction between groups/clusters can change their star formation activity (Bekki, 1999; Owen et al., 2005; Miller, 2005; Ferrari et al., 2005; Johnston-Hollitt et al., 2008; Hwang & Lee, 2009). In fact, there are three clusters close to the central region of the A2199 supercluster: A2199, A2197E and A2197W. In particular, A2197E and A2197W overlap each other both on the sky and in redshift space; two clusters may be currently interacting. A2199 also seems to interact with A2197W/E and with another nearby group, NRGs388. Thus, the star formation activity of A2199, A2197W/E, and NRGs388 could be enhanced by the interaction among them. Note that the merging/interaction stages are also important to determine the star formation activity of galaxy groups/clusters (Hwang & Lee, 2009). Therefore, the different merging/interaction stages of the groups/clusters in the supercluster can add significant scatters to the anti-correlation between the star formation activity and , and can results in no correlation between the two.
6.2. Morphology Dependence of the Galaxies in the MIR Green Valley
In §5.3 we compare the cumulative distribution of and for different MIR classes. The different distributions between MIR blue cloud galaxies and MIR SF sequence galaxies are consistent with the expectations from the morphology- and SFR-density relations; most MIR blue cloud galaxies are morphologically early types with low SFRs, but MIR SF sequence galaxies are generally late-type galaxies with high SFRs (see Figure 5). Interestingly, the distribution of MIR green valley galaxies are between MIR blue cloud and MIR SF sequence galaxies in both environmental indicators. Because the environment strongly affects galaxy morphology and the star formation activity (Park et al., 2007; Blanton & Moustakas, 2009), the MIR green valley galaxies between MIR blue cloud and MIR SF sequence galaxies seem to be in a transition stage.
However, when we fix galaxy morphology, the behavior of the MIR green valley galaxies changes. The MIR green valley galaxies with early-type morphology show a distribution very similar to that of the early-type MIR blue cloud galaxies. However, the MIR green valley galaxies with late-type morphology still show a distribution between MIR blue cloud and MIR SF sequence galaxies. This trend is also apparent even if we use only massive galaxies with . The similarity between MIR green valley and the MIR blue cloud galaxies among the early types is also seen in their stellar masses: for MIR green valley early types and for MIR blue cloud early types.
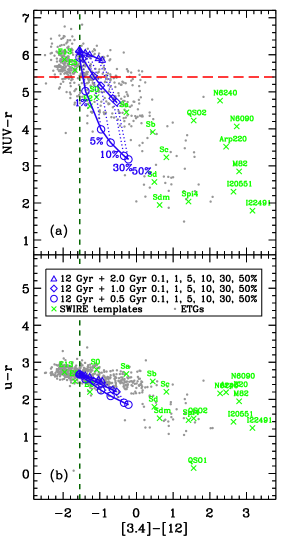
To better understand the physical meaning of the observed galaxy colors, we show NUV and colors of early-type galaxies as a function of WISE colors in Figure 10 (see also Ko et al. (2013)). We model that the MIR emission among early types (i.e., MIR green valley early-type galaxies) can be explained by the presence of a small fraction of young stellar population. Panel (a) shows the NUV versus color-color distribution of early-type member galaxies and the SWIRE templates of Polletta et al. (2007). We overplot the two-component SSP models of Piovan et al. (2003) with various combination of an old stellar population (12 Gyr) and young populations (0.5, 1, and 2 Gyr) with solar metallicity. The model grids indicate different fractions of a young population from 0.1% to 50%.
The plot shows that only of 0.5 Gyr or of 1 Gyr population can make colors green (). The plot also shows that about 50% of MIR green valley early-type galaxies have no NUV excess emission (NUV). Ko et al. (2013) suggested that young stellar populations with 0.5 and 1 Gyr can make the galaxies to have both MIR and NUV excess, but 2 Gyr population does not make any NUV excess. This means that half of MIR green valley early-type galaxies stop forming stars at least 2 Gyr ago. This Gyr old recent star formation is detected only in the MIR (neither in the NUV nor in the optical) because the MIR traces star formation over longer timescale ( Gyr) than NUV and optical bands (Ko et al., 2013; Schawinski et al., 2014).
Figure 10(b) displays the versus distribution of early-type member galaxies. The model grids show that colors change very little with increasing the fraction of young populations. This result is consistent with the results in Figures 4 and 5; the MIR green valley and MIR blue cloud early-type galaxies show similar optical properties.
The environmental dependence of these MIR classes and their optical properties shown in §5 suggest a possible evolutionary scenario of galaxies from late-type SF galaxies to early-type quiescent galaxies: 1) Late-type MIR SF sequence galaxies 2) Late-type MIR green valley galaxies 3) Early-type MIR green valley galaxies 4) Early-type MIR blue cloud galaxies. Because the timescale for the suppression of star formation activity is shorter than the timescale for morphological transformation (Blanton & Moustakas, 2009), we expect that the star formation activity of supercluster galaxies decreases first (12), and then the morphological transformation would be followed (23). Skibba et al. (2009) found that the color-density relation is more fundamental than the morphology-density relation. Bamford et al. (2009) also obtained a similar result, and suggested that the color transformation driven by environment should take place on shorter timescales than the morphological transformation. This agrees well with our scenario.
Masters et al. (2010) studied the environmental dependence of (optically) red (or passive) spiral galaxies that are considered as transition objects between normal blue spirals and red early-type galaxies. They showed that red spirals are mainly found in intermediate density regions and have higher stellar masses than blue spirals. These characteristics of red spirals are very similar to those of late-type MIR green valley galaxies (see Figures 5, 8, and 9). They also suggested that strangulation or starvation (removal of gas in outer halo and no further accretion of cold gas) is a plausible mechanism for producing red spirals. These mechanisms can explain quenching of star formation even in low-mass groups (Kawata & Mulchaey, 2008; Wetzel et al., 2013), which accounts for the presence of late-type MIR green valley located outside the cluster regions (see Figure 6). However, low-mass spirals cannot keep their spiral structures from the environmental processes (Bekki et al., 2002). This explains why late-type MIR green valley galaxies (red spirals) have higher stellar masses than late-type MIR SF sequence galaxies (normal blue spirals).
When galaxies enter the MIR green valley, they undergo morphological transformation from late types to early types. Early-type MIR green valley galaxies are more likely to exist in high density regions than late-type MIR green valley galaxies (see §5.3). This suggests that the environment can play a role in the morphological transformation in the MIR green valley. George et al. (2013) suggested that the observed morphological dependence of galaxies on environment cannot be fully explained by strangulation and disk fading (Quilis et al., 2000). Instead, galaxy mergers and close tidal interactions should be required for the morphological transformation. Park & Hwang (2009) also found that cumulative galaxy-galaxy gravitational/hydrodynamic interactions are the main drive for the morphological transformation in cluster environment. Bekki & Couch (2011) showed that the transformation in group environment can be driven by repetitive slow encounters with group members. These processes seem suitable for MIR green valley galaxies that are mainly in groups and clusters.
To summarize, the star formation of galaxies is quenched before the galaxies enter the MIR green valley, which is mainly driven by strangulation or starvation. Then, the morphological transformation from late types to early types occurs in the MIR green valley, especially, for massive late-type galaxies with . The main environmental mechanisms for the morphology transformation are galaxy-galaxy mergers and interactions. After the transformation, early-type MIR green valley galaxies stay for several Gyrs keeping the memory of their last star formation.
7. Summary and Conclusions
Using the multi-wavelength data covering the entire region of the A2199 supercluster, we study the star formation activity of galaxy groups/clusters in the supercluster and the MIR properties of the supercluster galaxies. We determine of groups and clusters using WISE 22 data, and find no dependence of on .
We classify galaxies into three MIR groups in the WISE color versus 12 luminosity diagram: MIR blue cloud galaxies, MIR SF sequence galaxies, and MIR green valley galaxies. MIR blue cloud galaxies are mostly (90%) early types, while MIR SF sequence galaxies are predominantly (93%) late types. MIR green valley galaxies consist of early- (68%) and late-type galaxies (32%). SFRs for MIR blue cloud and MIR green valley galaxies are similar, but much smaller than those for MIR SF sequence galaxies. It is important that the MIR green valley galaxies are distinguishable from the optical green valley galaxies, in the sense that they belong to the optical red sequence. Thus star formation quenching of galaxies occurs before the galaxies enter the MIR green valley.
We calculate the fraction of each MIR class in groups/clusters. We could not find any dependence of the fraction of each MIR class on , consistent with the trend of . These results suggest that group/cluster mass does not play an important role in controlling the global star formation activity of the systems. On the other hand, there could be other mechanisms affecting the global star formation activity of the systems. These include the interaction between infalling groups and the supercluster, and between groups/clusters.
We compare the cumulative distribution of and for the three MIR classes. MIR green valley galaxies show the distribution between MIR blue cloud and MIR SF sequence galaxies. When only considering early-type galaxies, the difference between MIR blue cloud and MIR green valley galaxies disappears. However, late-type galaxies in the MIR green valley still show the distribution between MIR blue cloud and MIR green valley galaxies. These results suggest a possible evolutionary scenario: 1) Late-type MIR SF sequence galaxies 2) Late-type MIR green valley galaxies 3) Early-type MIR green valley galaxies 4) Early-type MIR blue cloud galaxies. Thus the MIR green valley is the site where morphology transformation of galaxies mainly appears to occur.
References
- Abazajian et al. (2009) Abazajian, K. N., Adelman-McCarthy, J. K., Agüeros, M. A., et al. 2009, ApJS, 182, 543
- Alatalo et al. (2014) Alatalo, K., Cales, S. L., Appleton, P. N., et al. 2014, ApJ, 794, LL13
- Bai et al. (2010) Bai, L., Rasmussen, J., Mulchaey, J. S., et al. 2010, ApJ, 713, 637
- Bai et al. (2009) Bai, L., Rieke, G. H., Rieke, M. J., Christlein, D., & Zabludoff, A. I. 2009, ApJ, 693, 1840
- Bai et al. (2007) Bai, L., Marcillac, D., Rieke, G. H., et al. 2007, ApJ, 664, 181
- Baldry et al. (2004) Baldry, I. K., Glazebrook, K., Brinkmann, J., et al. 2004, ApJ, 600, 681
- Balogh et al. (1999) Balogh, M. L., Morris, S. L., Yee, H. K. C., Carlberg, R. G., & Ellingson, E. 1999, ApJ, 527, 54
- Balogh & McGee (2010) Balogh, M. L., & McGee, S. L. 2010, MNRAS, 402, L59
- Bamford et al. (2009) Bamford, S. P., Nichol, R. C., Baldry, I. K., et al. 2009, MNRAS, 393, 1324
- Beers et al. (1990) Beers, T. C., Flynn, K., & Gebhardt, K. 1990, AJ, 100, 32
- Bekki & Couch (2011) Bekki, K., & Couch, W. J. 2011, MNRAS, 415, 1783
- Bekki et al. (2002) Bekki, K., Couch, W. J., & Shioya, Y. 2002, ApJ, 577, 651
- Bekki (1999) Bekki, K. 1999, ApJ, 510, L15
- Biviano et al. (2011) Biviano, A., Fadda, D., Durret, F., Edwards, L. O. V., & Marleau, F. 2011, A&A, 532, A77
- Blanton & Moustakas (2009) Blanton, M. R., & Moustakas, J. 2009, ARA&A, 47, 159
- Bolzonella et al. (2010) Bolzonella, M., Kovač, K., Pozzetti, L., et al. 2010, A&A, 524, A76
- Brammer et al. (2009) Brammer, G. B., Whitaker, K. E., van Dokkum, P. G., et al. 2009, ApJ, 706, L173
- Brand et al. (2009) Brand, K., Moustakas, J., Armus, L., et al. 2009, ApJ, 693, 340
- Brinchmann et al. (2004) Brinchmann, J., Charlot, S., White, S. D. M., et al. 2004, MNRAS, 351, 1151
- Cardelli et al. (1989) Cardelli, J. A., Clayton, G. C., & Mathis, J. S. 1989, ApJ, 345, 245
- Carlberg et al. (1997) Carlberg, R. G., Yee, H. K. C., & Ellingson, E. 1997, ApJ, 478, 462
- Chary & Elbaz (2001) Chary, R., & Elbaz, D. 2001, ApJ, 556, 562
- Choi et al. (2007) Choi, Y.-Y., Park, C., & Vogeley, M. S. 2007, ApJ, 658, 884
- Choi et al. (2010) Choi, Y.-Y., Han, D.-H., & Kim, S. S. 2010, Journal of Korean Astronomical Society, 43, 191
- Chung et al. (2011) Chung, S. M., Eisenhardt, P. R., Gonzalez, A. H., et al. 2011, ApJ, 743, 34
- Chung et al. (2010) Chung, S. M., Gonzalez, A. H., Clowe, D., Markevitch, M., & Zaritsky, D. 2010, ApJ, 725, 1536
- Cowie & Songaila (1977) Cowie, L. L., & Songaila, A. 1977, Nature, 266, 501
- Cucciati et al. (2010) Cucciati, O., Iovino, A., Kovač, K., et al. 2010, A&A, 524, A2
- De Lucia et al. (2012) De Lucia, G., Fontanot, F., & Wilman, D. 2012, MNRAS, 419, 1324
- Diaferio (1999) Diaferio, A. 1999, MNRAS, 309, 610
- Diaferio & Geller (1997) Diaferio, A., & Geller, M. J. 1997, ApJ, 481, 633
- Donoso et al. (2012) Donoso, E., Yan, L., Tsai, C., et al. 2012, ApJ, 748, 80
- Dressler (1980) Dressler, A. 1980, ApJ, 236, 351
- Duc et al. (2002) Duc, P.-A., Poggianti, B. M., Fadda, D., et al. 2002, A&A, 382, 60
- Elbaz et al. (2011) Elbaz, D., Dickinson, M., Hwang, H. S., et al. 2011, A&A, 533, A119
- Faber et al. (2007) Faber, S. M., Willmer, C. N. A., Wolf, C., et al. 2007, ApJ, 665, 265
- Ferrari et al. (2005) Ferrari, C., Benoist, C., Maurogordato, S., Cappi, A., & Slezak, E. 2005, A&A, 430, 19
- Finn et al. (2005) Finn, R. A., Zaritsky, D., McCarthy, D. W., Jr., et al. 2005, ApJ, 630, 206
- Fujita (2004) Fujita, Y. 2004, PASJ, 56, 29
- Geach et al. (2006) Geach, J. E., Smail, I., Ellis, R. S., et al. 2006, ApJ, 649, 661
- George et al. (2013) George, M. R., Ma, C.-P., Bundy, K., et al. 2013, ApJ, 770, 113
- Goto (2005) Goto, T. 2005, MNRAS, 356, L6
- Gunn & Gott (1972) Gunn, J. E., & Gott, J. R., III 1972, ApJ, 176, 1
- Haines et al. (2011) Haines, C. P., Busarello, G., Merluzzi, P., et al. 2011, MNRAS, 412, 127
- Hess & Wilcots (2013) Hess, K. M., & Wilcots, E. M. 2013, AJ, 146, 124
- Hickson et al. (1992) Hickson, P., Mendes de Oliveira, C., Huchra, J. P., & Palumbo, G. G. 1992, ApJ, 399, 353
- Hwang et al. (2010) Hwang, H. S., Elbaz, D., Lee, J. C., et al. 2010, A&A, 522, A33
- Hwang et al. (2012a) Hwang, H. S., Geller, M. J., Diaferio, A., & Rines, K. J. 2012a, ApJ, 752, 64
- Hwang et al. (2012b) Hwang, H. S., Geller, M. J., Kurtz, M. J., Dell’Antonio, I. P., & Fabricant, D. G. 2012b, ApJ, 758, 25
- Hwang & Lee (2009) Hwang, H. S., & Lee, M. G. 2009, MNRAS, 397, 2111
- Hwang & Park (2009) Hwang, H. S., & Park, C. 2009, ApJ, 700, 791
- Johnson et al. (2007) Johnson, K. E., Hibbard, J. E., Gallagher, S. C., et al. 2007, AJ, 134, 1522
- Johnston-Hollitt et al. (2008) Johnston-Hollitt, M., Sato, M., Gill, J. A., Fleenor, M. C., & Brick, A.-M. 2008, MNRAS, 390, 289
- Johnstone et al. (2002) Johnstone, R. M., Allen, S. W., Fabian, A. C., & Sanders, J. S. 2002, MNRAS, 336, 299
- Kauffmann et al. (2003) Kauffmann, G., Heckman, T. M., White, S. D. M., et al. 2003, MNRAS, 341, 33
- Kawano et al. (2003) Kawano, N., Ohto, A., & Fukazawa, Y. 2003, PASJ, 55, 585
- Kawata & Mulchaey (2008) Kawata, D., & Mulchaey, J. S. 2008, ApJ, 672, L103
- Kelson et al. (2002) Kelson, D. D., Zabludoff, A. I., Williams, K. A., et al. 2002, ApJ, 576, 720
- Kennicutt (1998) Kennicutt, R. C., Jr. 1998, ARA&A, 36, 189
- Ko et al. (2009) Ko, J., Im, M., Lee, H. M., et al. 2009, ApJ, 695, L198
- Ko et al. (2012) Ko, J., Im, M., Lee, H. M., et al. 2012, ApJ, 745, 181
- Ko et al. (2013) Ko, J., Hwang, H. S., Lee, J. C., & Sohn, Y.-J. 2013, ApJ, 767, 90
- Ko et al. (2014) Ko, J., Hwang, H. S., Im, M., et al. 2014, ApJ, 791, 134
- Koyama et al. (2011) Koyama, Y., Kodama, T., Nakata, F., Shimasaku, K., & Okamura, S. 2011, ApJ, 734, 66
- Koyama et al. (2010) Koyama, Y., Kodama, T., Shimasaku, K., et al. 2010, MNRAS, 403, 1611
- Kranz et al. (2010) Kranz, W. D., Tran, K.-V. H., Giordano, L., & Saintonge, A. 2010, AJ, 140, 561
- Larson et al. (1980) Larson, R. B., Tinsley, B. M., & Caldwell, C. N. 1980, ApJ, 237, 692
- J.C.Lee (2012) Lee, J. C. 2012, Publication of Korean Astronomical Society, 27, 291
- J.C.Lee et al. (2012) Lee, J. C., Hwang, H. S., Lee, M. G., Kim, M., & Lee, J. H. 2012, ApJ, 756, 95
- J.C.Lee et al. (2013) Lee, J. C., Hwang, H. S., & Ko, J. 2013, ApJ, 774, 62
- M.G.Lee et al. (2009) Lee, M. G., Lee, H. M., Im, M., et al. 2009, AKARI, a Light to Illuminate the Misty Universe, 418, 241
- Lemaux et al. (2012) Lemaux, B. C., Gal, R. R., Lubin, L. M., et al. 2012, ApJ, 745, 106
- Lewis et al. (2002) Lewis, I., Balogh, M., De Propris, R., et al. 2002, MNRAS, 334, 673
- Mahajan (2013) Mahajan, S. 2013, MNRAS, 431, L117
- Markevitch et al. (1999) Markevitch, M., Vikhlinin, A., Forman, W. R., & Sarazin, C. L. 1999, ApJ, 527, 545
- Martínez et al. (2002) Martínez, H. J., Zandivarez, A., Domínguez, M., Merchán, M. E., & Lambas, D. G. 2002, MNRAS, 333, L31
- Masters et al. (2010) Masters, K. L., Mosleh, M., Romer, A. K., et al. 2010, MNRAS, 405, 783
- Miller (2005) Miller, N. A. 2005, AJ, 130, 2541
- Miller et al. (2005) Miller, C. J., Nichol, R. C., Reichart, D., et al. 2005, AJ, 130, 968
- Moore et al. (1996) Moore, B., Katz, N., Lake, G., Dressler, A., & Oemler, A. 1996, Nature, 379, 613
- Muratov & Gnedin (2010) Muratov, A. L., & Gnedin, O. Y. 2010, ApJ, 718, 1266
- Noeske et al. (2007) Noeske, K. G., Weiner, B. J., Faber, S. M., et al. 2007, ApJ, 660, L43
- Oh et al. (2011) Oh, K., Sarzi, M., Schawinski, K., & Yi, S. K. 2011, ApJS, 195, 13
- Owen et al. (2005) Owen, F. N., Ledlow, M. J., Keel, W. C., Wang, Q. D., & Morrison, G. E. 2005, AJ, 129, 31
- Pan et al. (2013) Pan, Z., Kong, X., & Fan, L. 2013, ApJ, 776, 14
- Park et al. (2007) Park, C., Choi, Y.-Y., Vogeley, M. S., et al. 2007, ApJ, 658, 898
- Park & Choi (2005) Park, C., & Choi, Y.-Y. 2005, ApJ, 635, L29
- Park & Hwang (2009) Park, C., & Hwang, H. S. 2009, ApJ, 699, 1595
- Peng et al. (2010) Peng, Y.-j., Lilly, S. J., Kovač, K., et al. 2010, ApJ, 721, 193
- Piovan et al. (2003) Piovan, L., Tantalo, R., & Chiosi, C. 2003, A&A, 408, 559
- Poggianti et al. (2008) Poggianti, B. M., Desai, V., Finn, R., et al. 2008, ApJ, 684, 888
- Poggianti et al. (2006) Poggianti, B. M., von der Linden, A., De Lucia, G., et al. 2006, ApJ, 642, 188
- Polletta et al. (2007) Polletta, M., Tajer, M., Maraschi, L., et al. 2007, ApJ, 663, 81
- Popesso et al. (2012) Popesso, P., Biviano, A., Rodighiero, G., et al. 2012, A&A, 537, A58
- Quilis et al. (2000) Quilis, V., Moore, B., & Bower, R. 2000, Science, 288, 1617
- Rasmussen et al. (2012) Rasmussen, J., Mulchaey, J. S., Bai, L., et al. 2012, ApJ, 757, 122
- Rines et al. (2013) Rines, K., Geller, M. J., Diaferio, A., & Kurtz, M. J. 2013, ApJ, 767, 15
- Rines et al. (2002) Rines, K., Geller, M. J., Diaferio, A., et al. 2002, AJ, 124, 1266
- Rines et al. (2001) Rines, K., Mahdavi, A., Geller, M. J., et al. 2001, ApJ, 555, 558
- Rines & Diaferio (2010) Rines, K., & Diaferio, A. 2010, AJ, 139, 580
- Rines & Diaferio (2006) Rines, K., & Diaferio, A. 2006, AJ, 132, 1275
- Rines & Geller (2008) Rines, K., & Geller, M. J. 2008, AJ, 135, 1837
- Salpeter (1955) Salpeter, E. E. 1955, ApJ, 121, 161
- Schawinski et al. (2014) Schawinski, K., Urry, C. M., Simmons, B. D., et al. 2014, MNRAS, 440, 889
- Serra et al. (2011) Serra, A. L., Diaferio, A., Murante, G., & Borgani, S. 2011, MNRAS, 412, 800
- Shim et al. (2011) Shim, H., Im, M., Lee, H. M., et al. 2011, ApJ, 727, 14
- Skibba et al. (2009) Skibba, R. A., Bamford, S. P., Nichol, R. C., et al. 2009, MNRAS, 399, 966
- Sobral et al. (2011) Sobral, D., Best, P. N., Smail, I., et al. 2011, MNRAS, 411, 675
- Sohn et al. (2013) Sohn, J., Hwang, H. S., Lee, M. G., Lee, G.-H., & Lee, J. C. 2013, ApJ, 771, 106
- Springel et al. (2005) Springel, V., Di Matteo, T., & Hernquist, L. 2005, ApJ, 620, L79
- Strateva et al. (2001) Strateva, I., Ivezić, Ž., Knapp, G. R., et al. 2001, AJ, 122, 1861
- Tasca et al. (2009) Tasca, L. A. M., Kneib, J.-P., Iovino, A., et al. 2009, A&A, 503, 379
- Temi et al. (2005) Temi, P., Mathews, W. G., & Brighenti, F. 2005, ApJ, 622, 235
- Tinker et al. (2013) Tinker, J. L., Leauthaud, A., Bundy, K., et al. 2013, ApJ, 778, 93
- Walker et al. (2013) Walker, L. M., Butterfield, N., Johnson, K., et al. 2013, ApJ, 775, 129
- Wetzel et al. (2013) Wetzel, A. R., Tinker, J. L., Conroy, C., & van den Bosch, F. C. 2013, MNRAS, 432, 336
- Wright et al. (2010) Wright, E. L., Eisenhardt, P. R. M., Mainzer, A. K., et al. 2010, AJ, 140, 1868
- Wyder et al. (2007) Wyder, T. K., Martin, D. C., Schiminovich, D., et al. 2007, ApJS, 173, 293
- Zabludoff & Mulchaey (1998) Zabludoff, A. I., & Mulchaey, J. S. 1998, ApJ, 496, 39