Six years of Fermi-LAT and Multi-wavelength Monitoring of the Broad-Line Radio Galaxy 3C 120: Jet Dissipation at Sub-parsec scales from the Central Engine
Abstract
We present multi-wavelength monitoring results for the broad-line radio galaxy 3C 120 in the MeV/GeV, sub-millimeter, and 43 GHz bands over six years. Over the past two years, Fermi-LAT sporadically detected 3C 120 with high significance and the 230 GHz data also suggest an enhanced activity of the source. After the MeV/GeV detection from 3C 120 in MJD 56240–56300, 43 GHz VLBA monitoring revealed a brightening of the radio core, followed by the ejection of a superluminal knot. Since we observed the -ray and VLBA phenomena in temporal proximity to each other, it is naturally assumed that they are physically connected. This assumption was further supported by the subsequent observation that the 43 GHz core brightened again after a -ray flare occurred around MJD 56560. We can then infer that the MeV/GeV emission took place inside an unresolved 43 GHz core of 3C 120 and that the jet dissipation occurred at sub-parsec distances from the central black hole, if we take the distance of the 43 GHz core from the central black hole as pc, as previously estimated from the time lag between X-ray dips and knot ejections (Marscher et al., 2002; Chatterjee et al., 2009). Based on our constraints on the relative locations of the emission regions and energetic arguments, we conclude that the rays are more favorably produced via the synchrotron self-Compton process, rather than inverse Compton scattering of external photons coming from the broad line region or hot dusty torus. We also derived the electron distribution and magnetic field by modeling the simultaneous broadband spectrum.
Subject headings:
radiation mechanisms: non-thermal — galaxies: active — galaxies: jets — gamma rays: galaxies — radio continuum: galaxies — galaxies: individual (3C 120)1. Introduction
The Fanaroff-Riley Class I radio galaxy (Walker et al., 1987) 3C 120 () is optically classified as a broad-line radio galaxy (BLRG). Its broadband spectrum is dominated by the non-thermal jet emission along with a thermal disk component, hence this BLRG is an ideal source to study the jet-disk connection. Indeed, Marscher et al. (2002) observed X-ray dips in 3C 120 followed by radio knot ejections through Very Long Baseline Array (VLBA) monitoring. This was naturally interpreted as disk material suddenly falling onto its central black hole (BH) with some fraction ejected as a jet (see also Chatterjee et al., 2009). This jet-cycle paradigm in 3C 120 has been confirmed independently by multi-epoch X-ray spectroscopy combined with simultaneous UV and radio observations (Lohfink et al., 2013).
The initial Fermi Large Area Telescope (LAT; Atwood et al., 2009) detection of 3C 120 was reported by Abdo et al. (2010). Kataoka et al. (2011) argued that the -ray emissions of LAT-detected BLRGs (3C 120, 3C 111 and Pictor A) are most likely produced in the inner nuclear jets rather than large-scale jet structures, because these sources contain brighter radio cores compared to other BLRGs not detected by the LAT (see also Grandi et al., 2012, for 3C 111). A major question is where the -ray emission is located relative to the central BH. It has been assumed that a measurement of the variability timescale directly constrains the location of the emission if the jet is conical and the emission region roughly corresponds to the cross-sectional radius of the jet. However, the detection of rapid day-scale TeV flaring observed in 2005 from M87 (Abramowski et al., 2012) was determined to arise from the pc-scale knot known as HST-1 located at a projected distance of 65 pc from the central BH rather than the VLBA core (Cheung et al., 2007). The recent detection of rapidly variable (doubling time of 10 minutes) sub-TeV emission from one of few TeV-emitting flat spectrum radio quasars 4C +21.35 also indicates that a very compact emission region of the order of 1014 cm is located at several pc from the BH to avoid annihilation with broad line region photons (Aleksić et al., 2011; Tanaka et al., 2011; Tavecchio et al., 2011). Therefore, the variability timescale does not necessarily directly relate to the jet dissipation location, and hence a multi-wavelength approach is crucial to determining the MeV/GeV -ray production site.
How powerful relativistic jets are launched from a supermassive BH is also a key issue regarding Active Galactic Nuclei (AGNs). A likely jet launching mechanism was presented by Blandford & Znajek (1977), who considered that BH rotational energy is extracted magnetically and converted to jet power. Magneto-centrifugal force is also thought to drive the jet in part (Blandford & Payne, 1982). Recent theoretical studies have shown that rapidly rotating BHs in magnetically arrested accretion can efficiently generate relativistic jets (e.g., Tchekhovskoy et al., 2011; McKinney et al., 2012; Sikora & Begelman, 2013).
In this Letter we present six years of Fermi-LAT monitoring results of 3C 120, together with Submillimeter Array (SMA) 230 GHz and VLBA 43 GHz light curves. We describe the observations and data reduction in §2. Based on the multi-wavelength results presented in §3, we discuss the location of the jet dissipation region as well as the MeV/GeV -ray emission mechanism in §4. The relation between the power in the jet and the disk is presented in §4.
2. Observations
2.1. Fermi-LAT
Six years of Fermi-LAT P7REP data from 2008 August 4 to 2014 August 4 were analyzed using the Fermi ScienceTools v9r33p3. We selected SOURCE class events using the instrument response functions P7REP_SOURCE_V15 within a 10∘ region of interest (ROI) centered at the radio position of 3C 120 (, ) in the energy range from 500 MeV to 100 GeV. The low energy threshold of 500 MeV was chosen to minimize the possible contamination of any nearby point sources. Based on the on-orbit performance111http://www.slac.stanford.edu/exp/glast/groups/canda/
lat_Performance.htm of Fermi-LAT, the 95% containment angle (i.e., the point spread function) for all normal incidence events at MeV is . The only known LAT source within 3.5∘ of 3C 120 is the blazar 2FGL J0426.6+0509c that is 1.63∘ away.
To model the ROI, we included the standard diffuse templates222gll_iem_v05_rev1.fit and iso_source_v05.txt, which are taken from http://fermi.gsfc.nasa.gov/ssc/data/access/lat/
BackgroundModels.html to model the Galactic and isotropic background, as well as all sources in the 2FGL catalog (Nolan et al., 2012) within 10∘ of 3C 120. Note that 3C 120 is not included in the 2FGL catalog.
The spectral shapes of the latter were fixed to their 2FGL values but the normalizations were set free. 2FGL sources within the annulus of 10∘–15∘ were also included, but all of their parameters were fixed to their 2FGL values. By performing gtlike for the six-year accumulated data, we first found a test statistic (see Mattox et al. (1996)), for 3C 120 with power-law index and 0.5–100 GeV flux photons cm-2 s-1, corresponding to 0.1–100 GeV flux of photons cm-2 s-1 when extrapolated down to 100 MeV by assuming . The large index compared to the average index of LAT-detected radio galaxies (Abdo et al., 2010; Inoue, 2011) might be due to the selection of the higher low-energy threshold of 500 MeV instead of 100 MeV. We determined the LAT source position for 3C 120 using gtfindsrc and obtained R.A.=68.287∘ and Decl.=5.381∘ (68% error circle radius 0.088∘) which is only 0.028∘ away from the radio position. A new LAT source was found with at , , away from 3C 120.
This source was included in the source model during the LAT analysis, in addition to the 2FGL sources.
Light curves and spectral data points were computed by dividing the data set in time bins (30 and 5 days) or energy bins (3 logarithmic bins from 0.5 to 100 GeV) and fixing the parameters of all background sources (except for the normalizations of two nearby sources which might be variable) and leaving the normalization of 3C 120 free. In both cases, the spectral index of 3C 120 and the two nearby background sources were fixed to the value obtained from the full six-year analysis. A gtlike analysis was then performed in each bin to determine the normalization of the 3C 120 power law. 90% upper limits were computed in any bin where the TS was less than 9.
2.2. Submillimeter
The 230 GHz (1.3 mm) light curve for 3C 120 was obtained using the SMA near the summit of Mauna Kea (Hawaii). 3C 120 is included in an ongoing SMA monitoring program to determine the flux densities of compact extragalactic radio sources that can be used as millimeter and submillimeter wavelength calibrators (Gurwell et al., 2007). The observations were obtained in the ‘compact’ array configuration with typical 3 resolution. Data from this program are updated regularly and are available on the SMA website333http://sma1.sma.hawaii.edu/callist/callist.html.
2.3. Radio
We retrieved all available 43 GHz VLBA data from the Boston University Monitoring Program from 2012 January to 2013 December and analyzed the calibrated data using DIFMAP. The intensity of the core was measured in images convolved with a common Gaussian beam of mas to avoid resolution effects. We found a clear enhancement at epoch , which was followed by an ejection of a new jet component and decreasing core intensity in subsequent epochs. Using the visibility-based model-fitting program in DIFMAP to model the intensity structures, we found the new component was unresolved from the core on , but was clearly identified on the subsequent two epochs (, 56398). This suggests its epoch of zero separation was around or slightly later.
3. -ray and Radio Correlation
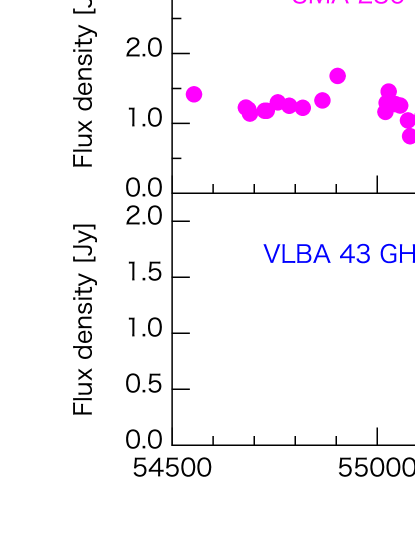
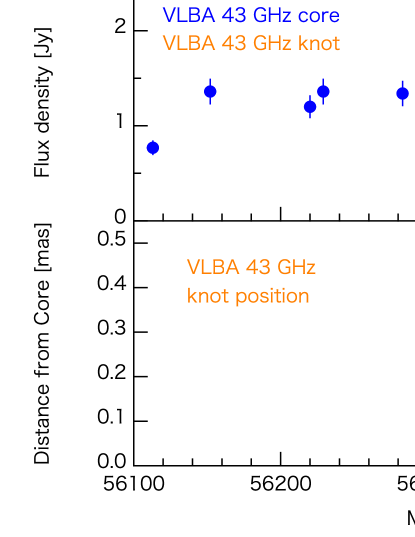
Fig. 1 shows the 30-day-bin 0.5–100 GeV flux of 3C 120, together with the 1-day-bin 230 GHz and VLBA 43 GHz core flux light curves. Here we assume that the SMA fluxes are dominated by the core. Fermi-LAT measured a from 3C 120 during the two most recent years, while the 230 GHz light curve indicates an enhanced activity of the source in the second half of the analyzed six years. In Fig. 2, we display enlarged views of the Fermi-LAT 0.5–100 GeV and VLBA 43 GHz light curves between MJD 56100 and 56500. In the 5-day binned Fermi-LAT light curve (see top panel), the largest values of and 7.5 are found in two bins, MJD 56247.7–56252.7 and 56272.7–56277.7, respectively.
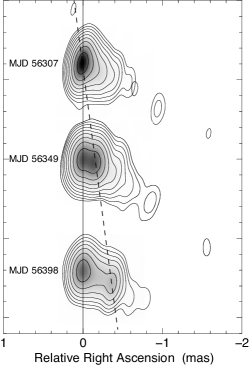
Fig. 3 shows the 43 GHz VLBA images at three epochs obtained after the Fermi-LAT detection of MeV/GeV rays. A bright radio knot clearly emerged from the core and propagated down the jet. The 43 GHz light curves of the core and the knot are shown in Fig. 2 along with the separation of the knot from the core as a function of time. We derived an apparent velocity of the knot as by fitting the first and second data points, because the low fluxes in the third and fourth points did not allow us to precisely determine the knot position. The apparent speed derived here is similar to past VLBA measurement of estimated from moving components with well-determined motions (Jorstad et al., 2005, Table 5 therein). Extrapolating the motion of the ejected knot linearly, we infer that it passed through the core at MJD 5631113, after the MeV/GeV flare occurred (see Fig. 2). During the passage, the 43 GHz core flux reached a maximum. Detailed VLBA analysis results will be reported elsewhere (Doi et al. in prep).
4. Discussion
Although we can not rule out coincidence, the fact that the -ray flares on MJD 56247.7-56252.7 and 56272.7-56277.7 were followed in close temporal proximity by the radio core brightening and superluminal radio ejection on MJD leads us to assume that they are physically related. In this regard, we also note that the 43 GHz core flux again increased after the third -ray flare occurred around MJD 56560 (see the lower panel in Fig. 1). This implies that a knot, responsible for the second -ray flare, was passing through the core and hence the 43 GHz core flux increased around MJD 56600, further supporting the physical connection between the -ray and radio phenomena. The distance from the central BH to the VLBA core was estimated to be pc by using the time lag between the X-ray dip and radio jet ejection (Chatterjee et al., 2009). The apparent speed of the knot of derived here and the time lags of days and days between the -ray and VLBA core brightenings allow us to infer the position of the -ray emission region under the assumption that these two phenomena are physically related. The knot moves a projected distance of and pc in the and days, respectively, while Chatterjee et al. (2009) derived a projected distance of 0.22 pc from the central BH to the 43 GHz VLBA core. Given the angle of between the jet axis and our line of sight (Jorstad et al., 2005), we found that the -ray emission region is located at and pc from the central BH. Here we assumed that the knot velocity is constant and if the acceleration of the knot takes place between the BH and VLBA core, as speculated by e.g., Marscher et al. (2008), the distance from the BH becomes larger, but still on the order of sub-pc.
It is difficult to precisely determine a source variability timescale from the Fermi-LAT data due to the relatively low flux. But since the Fermi-LAT sporadic detections are dominated by several 5-day bins (see top panel of Fig. 2), we assume here that the variability timescale is 5–10 days. The derived distance between the BH and -ray emission region, together with the assumed variability timescale of 5–10 days and previously-measured beaming factor (Jorstad et al., 2005), allow us to estimate the jet opening angle. The radius of the emission region is estimated as cm. By assuming a simple conical shape for the jet structure, the jet half opening angle () is estimated as , where the distance from the BH to the -ray emission region, pc is assumed by taking the average of the two distances derived above. This is consistent with the past estimate of the jet half opening angle of degree based on sequential VLBA observations (see Table 11 of Jorstad et al., 2005). The bulk Lorentz factor is estimated from the apparent speed of the knot of and viewing angle of 20.5∘. Hence, combined with (or 0.078 rad) derived here, we obtain , which is similar to the recently claimed result of from the MOJAVE study (Clausen-Brown et al., 2013).
Fig. 4 shows the Fermi-LAT spectrum of 3C 120 during the 60 day (MJD 56242.7–56302.7) -ray flaring period. The temporally closest measurements of the 43 GHz VLBA core and 230 GHz fluxes measured on MJD 56283 and 56280.2 are also plotted, together with the Swift/UVOT and XRT fluxes on MJD 56276. Note that this is the first truly simultaneous broadband spectrum for this source. The disk emission of 3C 120 is known to be bright (e.g., Kataoka et al., 2007) and the accretion rate is estimated to be as large as % of its Eddington luminosity (e.g., Chatterjee et al., 2009). This implies a possible contribution of an external photon field as targets for the inverse-Comptonization process. In the following, we constrain the possible target photon field through energetic arguments. The ratio between the external-radiation Compton (ERC) luminosity to SSC luminosity is , where and are the external and synchrotron photon energy density in the jet comoving frame, respectively (Stawarz et al., 2003). Here we consider only the circumnuclear hot dust region (HDR) as an external photon field (namely, ). Because the location of the MeV/GeV -ray emission region (0.1–0.3 pc, see §3) is well beyond the broad line region (BLR) radius of 0.019–0.024 pc (determined from reverberation mapping by Pozo Nuñez et al., 2014), we can neglect the possible contribution of BLR photons.
The energy density of the HDR emission in the jet comoving frame is . Here, the HDR radius is estimated as pc, using the disk flux of erg cm-2 s-1 (and hence erg s-1) in the UV band (see Fig. 4 and below). We also obtain the HDR luminosity as erg s-1, where is the fraction of the disk luminosity reprocessed in the inner region of the hot dust torus (% is usually assumed, Sikora et al. (2009)). The synchrotron photon energy density in the jet comoving frame is and the peak flux is roughly erg cm-2 s-1 (see Fig. 4 and below), hence erg s-1. Combining these, we obtained
Therefore, despite the bright disk and dusty torus, the SSC scenario may be favored over the ERC as the MeV/GeV -ray emission mechanism. Note the strong dependence of this estimate on the Doppler factor where we took the average derived by Jorstad et al. (2005) based on a VLBA kinematic study over 3 years. If we take the upper end of their average, instead of assumed above, the luminosity ratio increases to , which is closer to unity.
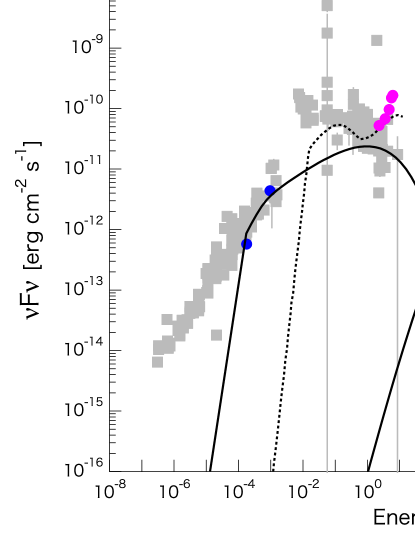
To derive the physical parameters at the emission site, we performed SED modeling for the 43 GHz VLBA, 230 GHz SMA, and Fermi-LAT data points. We assumed one-zone synchrotron and SSC emissions (Finke et al., 2008) by relativistic electrons of a single power-law distribution with exponential cutoff, , where is the normalization, is the electron spectral index, and is the cutoff electron Lorentz factor. We first fixed the following parameters, , , and cm (corresponding to days). Then we searched for a set of parameters well representing the simultaneous multi-wavelength data; minimum and maximum electron Lorentz factors and , , , , and comoving magnetic field . As a result, we obtained , electrons, , and Gauss. The synchrotron curve is largely unconstrained due to the sparse coverage with only 43 and 230 GHz measurements. However, van der Wolk et al. (2010) reported a significant jet contribution to the mid-IR flux, in agreement with the modeling presented here. These parameters derived from SED modeling lead to the jet powers in electrons () and magnetic field () of erg s-1 and erg s-1, respectively. Hence Poynting flux slightly dominates, , where and are comoving electron and magnetic energy density, assuming no dynamically relevant protons in the jet. The total radiated power () based on the SED modeling was calculated as erg s-1 by assuming and . This is larger than the summed and hence another source of power is required. A possible solution is to assume that the jet carries a cold proton component which has larger power than (e.g., Sikora & Madejski, 2000; Ghisellini et al., 2014). Indeed, there are some arguments justifying the need for a proton component (Celotti & Fabian, 1993; Ghisellini & Tavecchio, 2010, and references therein). If we assume that the total radiated power is about 10% of the jet power, as was found for AGN and Gamma-Ray Burst jets (Nemmen et al., 2012), we find the jet power is erg s-1. On the other hand, the accretion luminosity, defined as the total power of accreting plasma, is estimated as erg s-1 from the disk luminosity of erg s-1 and assuming a 10% radiative efficiency of the disk. Hence, we obtain , indicating that the jet launching and accelerating process is extremely efficient (see also e.g., Tanaka et al., 2011; Saito et al., 2013; Ghisellini et al., 2014). Simultaneous optical/UV and X-ray fluxes are above the jet component (see Fig. 4) and therefore originate from the disk even during the high -ray state. Indeed, the optical/UV/X-ray spectral shape is roughly consistent with accretion-related Seyfert-type emission (Koratkar & Blaes, 1999).
References
- Abdo et al. (2010) Abdo, A. A., Ackermann, M., Ajello, M., et al. 2010, ApJ, 720, 912
- Abramowski et al. (2012) Abramowski, A., Acero, F., Aharonian, F., et al. 2012, ApJ, 746, 151
- Aleksić et al. (2011) Aleksić, J., Antonelli, L. A., Antoranz, P., et al. 2011, ApJ, 730, L8
- Atwood et al. (2009) Atwood, W. B., Abdo, A. A., Ackermann, M., et al. 2009, ApJ, 697, 1071
- Blandford & Payne (1982) Blandford, R. D., & Payne, D. G. 1982, MNRAS, 199, 883
- Blandford & Znajek (1977) Blandford, R. D., & Znajek, R. L. 1977, MNRAS, 179, 433
- Celotti & Fabian (1993) Celotti, A., & Fabian, A. C. 1993, MNRAS, 264, 228
- Chatterjee et al. (2009) Chatterjee, R., Marscher, A. P., Jorstad, S. G., et al. 2009, ApJ, 704, 1689
- Cheung et al. (2007) Cheung, C. C., Harris, D. E., & Stawarz, Ł. 2007, ApJ, 663, L65
- Clausen-Brown et al. (2013) Clausen-Brown, E., Savolainen, T., Pushkarev, A. B., Kovalev, Y. Y., & Zensus, J. A. 2013, A&A, 558, A144
- Finke et al. (2008) Finke, J. D., Dermer, C. D., & Böttcher, M. 2008, ApJ, 686, 181
- Ghisellini & Tavecchio (2010) Ghisellini, G., & Tavecchio, F. 2010, MNRAS, 409, L79
- Ghisellini et al. (2014) Ghisellini, G., Tavecchio, F., Maraschi, L., Celotti, A., & Sbarrato, T. 2014, Nature, 515, 376
- Grandi et al. (2012) Grandi, P., Torresi, E., & Stanghellini, C. 2012, ApJ, 751, L3
- Gurwell et al. (2007) Gurwell, M. A., Peck, A. B., Hostler, S. R., Darrah, M. R., & Katz, C. A. 2007, in Astronomical Society of the Pacific Conference Series, Vol. 375, From Z-Machines to ALMA: (Sub)Millimeter Spectroscopy of Galaxies, ed. A. J. Baker, J. Glenn, A. I. Harris, J. G. Mangum, & M. S. Yun, 234
- Inoue (2011) Inoue, Y. 2011, ApJ, 733, 66
- Jorstad et al. (2005) Jorstad, S. G., Marscher, A. P., Lister, M. L., et al. 2005, AJ, 130, 1418
- Kataoka et al. (2007) Kataoka, J., Reeves, J. N., Iwasawa, K., et al. 2007, PASJ, 59, 279
- Kataoka et al. (2011) Kataoka, J., Stawarz, Ł., Takahashi, Y., et al. 2011, ApJ, 740, 29
- Koratkar & Blaes (1999) Koratkar, A., & Blaes, O. 1999, PASP, 111, 1
- Lohfink et al. (2013) Lohfink, A. M., Reynolds, C. S., Jorstad, S. G., et al. 2013, ApJ, 772, 83
- Marscher et al. (2002) Marscher, A. P., Jorstad, S. G., Gómez, J.-L., et al. 2002, Nature, 417, 625
- Marscher et al. (2008) Marscher, A. P., Jorstad, S. G., D’Arcangelo, F. D., et al. 2008, Nature, 452, 966
- Mattox et al. (1996) Mattox, J. R., Bertsch, D. L., Chiang, J., et al. 1996, ApJ, 461, 396
- McKinney et al. (2012) McKinney, J. C., Tchekhovskoy, A., & Blandford, R. D. 2012, MNRAS, 423, 3083
- Nemmen et al. (2012) Nemmen, R. S., Georganopoulos, M., Guiriec, S., et al. 2012, Science, 338, 1445
- Nolan et al. (2012) Nolan, P. L., Abdo, A. A., Ackermann, M., et al. 2012, ApJS, 199, 31
- Pozo Nuñez et al. (2014) Pozo Nuñez, F., Haas, M., Ramolla, M., et al. 2014, A&A, 568, A36
- Saito et al. (2013) Saito, S., Stawarz, Ł., Tanaka, Y. T., et al. 2013, ApJ, 766, L11
- Sikora & Begelman (2013) Sikora, M., & Begelman, M. C. 2013, ApJ, 764, L24
- Sikora & Madejski (2000) Sikora, M., & Madejski, G. 2000, ApJ, 534, 109
- Sikora et al. (2009) Sikora, M., Stawarz, Ł., Moderski, R., Nalewajko, K., & Madejski, G. M. 2009, ApJ, 704, 38
- Stawarz et al. (2003) Stawarz, Ł., Sikora, M., & Ostrowski, M. 2003, ApJ, 597, 186
- Tanaka et al. (2011) Tanaka, Y. T., Stawarz, Ł., Thompson, D. J., et al. 2011, ApJ, 733, 19
- Tavecchio et al. (2011) Tavecchio, F., Becerra-Gonzalez, J., Ghisellini, G., et al. 2011, A&A, 534, A86
- Tchekhovskoy et al. (2011) Tchekhovskoy, A., Narayan, R., & McKinney, J. C. 2011, MNRAS, 418, L79
- van der Wolk et al. (2010) van der Wolk, G., Barthel, P. D., Peletier, R. F., & Pel, J. W. 2010, A&A, 511, A64
- Walker et al. (1987) Walker, R. C., Benson, J. M., & Unwin, S. C. 1987, ApJ, 316, 546