Dust from Comet 209P/LINEAR during its 2014 Return:
Parent Body of a New Meteor Shower, the May Camelopardalids
Abstract
We report a new observation of the Jupiter-family comet 209P/LINEAR during its 2014 return. The comet is recognized as a dust source of a new meteor shower, the May Camelopardalids. 209P/LINEAR was apparently inactive at a heliocentric distance = 1.6 au and showed weak activity at 1.4 au. We found an active region of 0.001% of the entire nuclear surface during the comet’s dormant phase. An edge-on image suggests that particles up to 1 cm in size (with an uncertainty of factor 3–5) were ejected following a differential power-law size distribution with index . We derived a mass loss rate of 2–10 kg sec-1 during the active phase and a total mass of 5 107 kg during the 2014 return. The ejection terminal velocity of millimeter- to centimeter-sized particles was 1–4 m sec-1, which is comparable to the escape velocity from the nucleus (1.4 m sec-1). These results imply that such large meteoric particles marginally escaped from the highly dormant comet nucleus via the gas drag force only within a few months of the perihelion passage.
1 Introduction
The link between comets and meteor showers is important for better understanding of how pristine cometary materials have been delivered to the Earth. 209P/LINEAR (hereafter 209P) has an orbit typical of Jupiter-family comets, that is, a semimajor axis =2.932 au, eccentricity =0.692, inclination =19.4°, and Tisserand parameter with respect to Jupiter, , of 2.80. It was suggested that a swarm of dust from 209P might cause a meteor shower on UT 2014 May 24 (Jenniskens & Lyytinen, 2014). Ye & Wiegert (2014) has reported that 209P is relatively depleted in dust production, with a low level of activity around the perihelion passage in 2008–2009. This paper attempts to characterize the physical properties further through a new observation in 2014. We focus on the dust ejection properties (e.g., particle size and ejection terminal velocity), which are pivotal for linking the comet with the meteor shower via a dynamical model (see, e.g., Vaubaillon & Colas, 2005).
2 Observations and Date Analysis
The journal of these observations is summarized in Table 1. The first imaging observation was conducted on UT 2014 February 1 using a Tektronix 2048 2048 pixel CCD camera (Tek2k) on the University of Hawaii 2.24-m telescope (UH2.2m) atop Mauna Kea. We obtained optical images with a broadband Kron–Cousins R-band filter. We noticed that the comet appeared point-like even at a heliocentric distance = 1.57 au, where comets generally display comae and tails. Later, we made a network observation through the Optical and Infrared Synergetic Telescopes for Education and Research (OISTER), which is an inter-university observation network in the optical and infrared wavelengths. Among the OISTER network, we used four telescopes for the present study: the Nishi-Harima Astronomical Observatory Nayuta 2.0-m telescope (NHAO2m), the Ishigakijima Astronomical Observatory Murikabushi 1.0-m telescope (IAO1m), the Okayama Astrophysical Observatory 0.5-m reflecting telescope (OAO0.5m), and the Nayoro Observatory 1.6-m Pirka telescope of the Hokkaido University (NO1.6m). We employed the optical imaging cameras MINT (a back–illuminated 2048 2064 CCD chip with a 15-µm pixel pitch) with R- and I-band filters at NHAO2m, two sets of MITSuME (g′, R, and I-band simultaneous imaging system, a 1024 1024 CCD chip with a 24.0-µm pixel pitch) at IAO1m and OAO0.5m, and the MSI (a visible multispectral imager with a 512 512 CCD chip with a 16.0-µm pixel pitch(Watanabe et al., 2012) at NO1.6m. The two sets of MITSuME at IAO1m and OAO0.5m were designed identically, and each houses three front-illuminated CCD cameras. After early June 2014, 209P was unobservable from these observatories, which are located in the northern hemisphere. Instead, we observed the comet with the 0.6-m Transiting Planets and Planetesimals Small Telescope (TRAPPIST0.6m) with a 2048 2048 back-illuminated CCD chip with a 15-µm pixel pitch (Jehin et al., 2011). It covers 22′ 22′ with a resolution of 1.3″ pixel-1 using 22 binning. All telescopes were operated in a non-sidereal tracking mode so that the comet was stationary in the observed frames.
The observed data were analyzed in the standard manner for optical and near-infrared imaging data. We constructed median-stacked frames using 209P frames or dome flat images to correct for the effect of the pixel-to-pixel sensitivity variations across the detectors as well as optical vignetting (what is called the flat field image). The photometric zero levels were determined using Landolt photometric standard stars (Landolt, 1992) for UH88 and NO1.6m data and field stars listed in the USNO-A2.0 catalog (Mothé-Diniz et al., 2003) for the others. The images observed during a single night were combined to confirm the existence of a dust coma and further investigate the surface brightness profile of the dust tail (see Section 3.4).
3 Results
3.1 Appearance
We found no significant morphological differences between the g′-, R- and I-band images taken with MITSuME. The obtained color indices, =0.80.3 and =0.50.3, are consistent with those of the Sun, that is, ()=0.65 (Kim et al., 2012) and ()=0.33 (Holmberg et al., 2006), which implies that the reflected light from the nucleus and dust are the dominant light sources of the detected intensity. In addition, it is reported that the spectrum taken with the 8-m Gemini North telescope on April 9.25 UT did not reveal obvious emission lines attributable to sources such as C around 4500–5600Å and NH around 4900–6300Å (Schleicher, 2014). For these reasons, we ignored the contribution of gaseous emission in our R-band data and used the R-band magnitudes for the subsequent photometric analysis (see also Table 1).
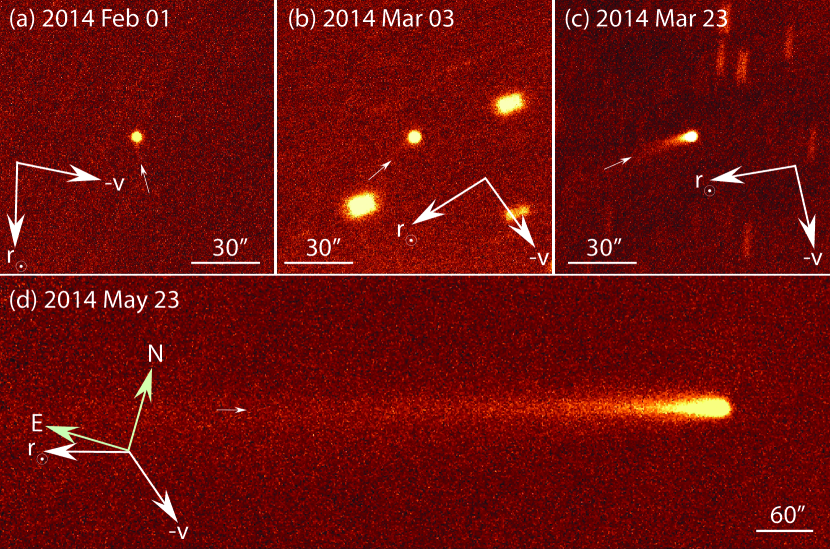
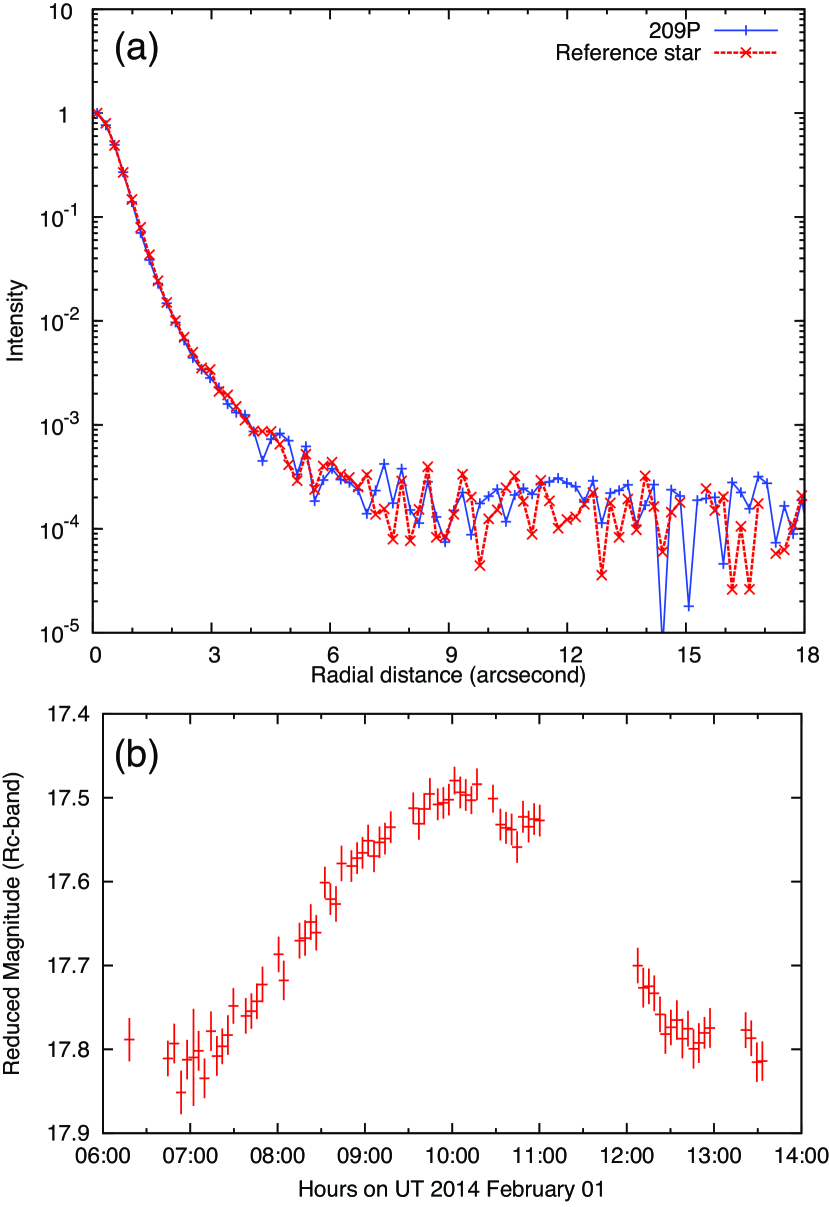
Figure 1 shows selected R-band images of 209P. In the first image, taken on UT 2014 February 1 (at =1.57 au), neither the coma nor the dust tail was visually apparent. An unclear tail-like feature extended to the position angle (the angle on the celestial plane measured from north through east) PA185°. It is not clear whether the feature was attributable to the cometary tail or an artifact such as a diffraction spike from the support vanes of the secondary mirror. The 1.05″–1.06″ full width at half-maximum (FWHM) of the field stars is in perfect agreement with the value of 1.05″ in the combined 209P image. In Figure 2 (a), we compare the radial profile of 209P in a composite image with that of a field star taken in sidereal tracking mode between the 209P exposures. We found that the surface brightness profiles coincided with one another at the 10-3– 10-2% level of the photocenter. The similarity suggests that the comet was highly dormant on that night (UT 2014 February 01). We set an upper limit of 0.01 for the parameter , which is defined as the ratio of the coma cross section to the nucleus cross section. Adopting a model in Luu & Jewitt (1992) and assuming the ejection of small dust particles (a radius of =0.5 µm) that are embedded in surface water ice, we obtained approximate estimates for the dust production rate 0.01 kg s-1 and the fractional active area 1 10-5 on UT 2014 February 1 (see also Ishiguro et al., 2011), The obtained value is significantly lower than those of the typical Jupiter-family comets (10-3, Tancredi et al., 2006).
In Figure 1 (b) (UT 2013 March 03 at =1.30 au), the comet still appeared point-like. However, a careful investigation revealed a faint tail-like structure extending to PA=1283°, which is close to the position angles of the Sun–comet radius vector (PA=123°) but deviates slightly to the negative heliocentric velocity vector (PA=216°). Since cometary dust tails usually appear between these two vectors, and the position angle does not align with the diffraction spike caused by the secondary mirror, we suspect that the extended structure might be a real cometary tail. In Figure 1 (c) (UT 2013 March 23), the cometary tail was clearly detected. It extended to PA=1054°, existing between the antisolar direction (PA=100°) and the negative heliocentric velocity vector (PA=193°). We detected an obvious tail in all the images after UT 2013 March 22. Figure 1 (d) was taken when the comet was viewed edge-on on UT 2013 May 23. Note that the image was rotated to align the projected orbital plane in the horizontal direction. The comet possessed a narrow tail extended to PA=1081°, which coincided with the position angle of the orbital plane projected on the sky (PA=107.4°). The tail extended out of the FOV (i.e., 13″). Further, the dust cloud extended sunward by 30″ (rightward in the image), probably because of the ejection of fresh dust particles toward the Sun. To obtain a crude estimate of the ejection velocity, we employed the formula , where is the apparent length of the sunward tail, is the terminal escape velocity of dust particles, is the ratio of the solar radiation pressure to the solar gravity, and is the solar gravity at the position of the comet (Jewitt & Meech, 1987). We obtained 1.1 m sec-1 assuming 1-cm particles and 3.4 m sec-1 assuming 1-mm particles. The order of magnitude estimate for is consistent with the result of another model described below (Section 3.4).
3.2 Properties of Nucleus
Figure 2 (b) shows the lightcurves of 209P measured from each image on UT 2014 February 1. The data were calibrated using Landolt photometric standard stars, ensuring an absolute magnitude accuracy of 0.05 mag or less (Landolt, 1992). The rotational lightcurve covered one peak and probably two troughs (both ends), suggesting that the rotational period is not shorter than the observational duration (7 h). The inferred rotational period is consistent with a report by Hergenrother in which he derived two alternative solutions of 10.9300.015 and 21.860.04 h (Green, 2014). We calculated the corresponding amplitude at = 0° using an empirical function (Zappala et al., 1990),
| (1) |
where and are the amplitudes at phase angles (Sun–comet–observer angles) of 0° and , respectively, and is a correction coefficient for the amplitude, which has different values for S-, C-, and M-type asteroids. We adopted = 0.015, the value for C-type asteroids, because the comet nucleus may have optical properties similar to those of C-type asteroids rather than S- or M-type asteroids. Substituting = 0.015 and 27.6°, we obtained an axis ratio of 1:1.25.
The magnitude is related to the effective (or mean) radius of the nucleus, , by
| (2) |
where is the geometric albedo in the R band; is the phase function; and are the heliocentric and geocentric distances, respectively, in au; and is the apparent R magnitude of the Sun. is often assumed to be = 10-0.4bα, where is a parameter characterizing the phase slope (Belskaya & Shevchenko, 2000). We assumed = 0.04 mag deg-1 and = 0.05, and obtained the R band absolute magnitude H=16.24 and =1.4 km, or the dimension of 2.5 3.2 km. Although there are uncertainties in (from 0.035 to 0.045 mag deg-1, Belskaya et al. 2000) and (from 0.03 to 0.07, Kim et al. 2014), which cause a 40% error (1 km) in the size, the derived size is in good agreement with that determined by a radar observation 111http://www.usra.edu/news/pr/2014/comet209PLINEAR/, which reported dimensions of 2.4 3.0 km. The similarity may suggest that the comet was inactive on 2014 February 1 and has optical properties typical of comet nuclei. For comparison, We fit our data at low phase angle (40.8°) using the – formalism (Lumme et al., 1984; Bowell et al., 1989) when the comet was apparently inactive, and obtained H=16.110.26 and G=0.150.17.
3.3 Coma Photometry
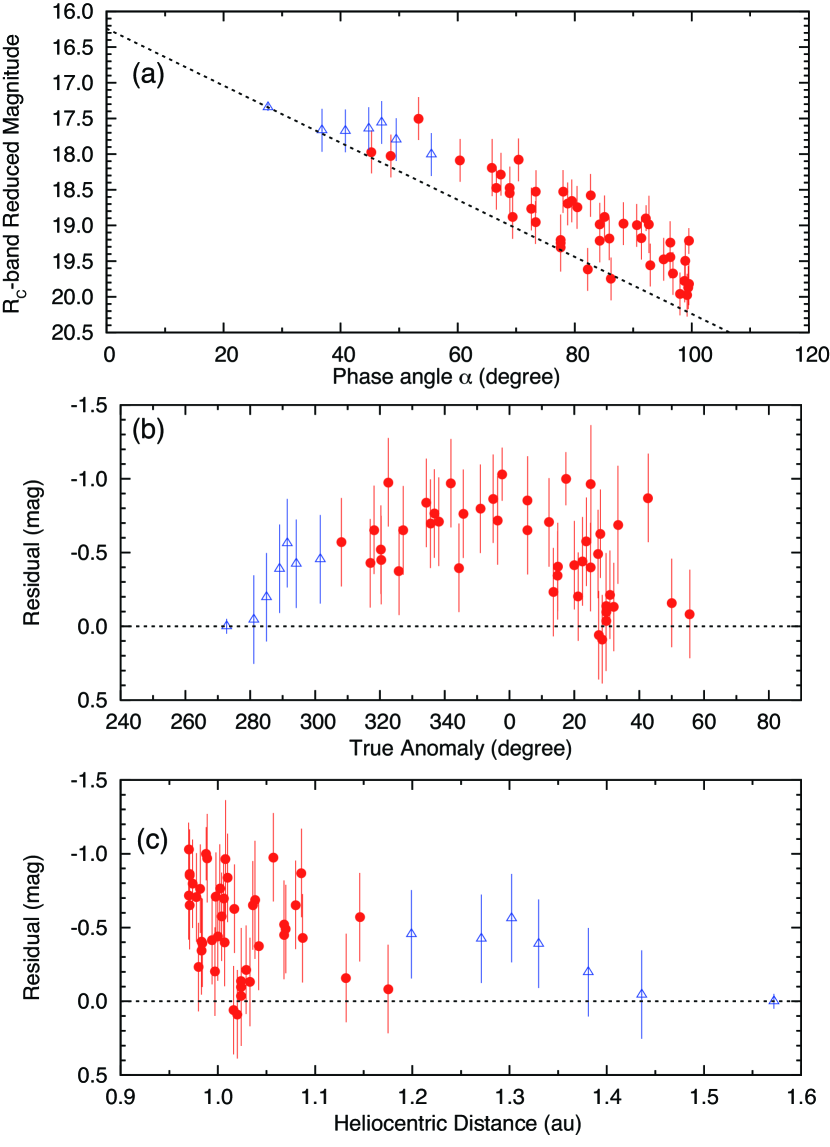
Figure 3 (a) shows the R-band reduced magnitude (a hypothetical magnitude observed at 1 au from both the Earth and the Sun) with respect to the phase angle. We set the aperture size for photometry to 3 times the FWHM of point sources (5″–9″, depending on the sky conditions). In the figure, we considered the uncertainty of the magnitude on the basis of two factors: one is associated with the uncertainty of the magnitudes of comparison stars (0.25 mag for USNO-A2.0), and the other results from the rotation of the nucleus (a half amplitude of the lightcurve, 0.18 mag), because most of our data could not cover an adequate rotational phase (except the data from UH2.2m and NO1.6m). The data taken on UT 2014 February 01 ( 27.6°) have the smallest error not only because they were calibrated with appropriate standard stars in the Landolt catalog, but also because the data covered a substantial rotational phase for deriving the mean magnitude. In Figure 3 (a), we show the reference magnitude of the nucleus, which is given by , following the result in Section 3.2. The magnitude of 209P was significantly brighter than the predicted nuclear magnitude at 50°. Since we considered the rotational brightening/darkening in the error bars, it is unlikely that the magnitude enhancement was caused by sampling bias. When we force fitted the magnitude data with a linear function, we obtained a phase slope of = 0.03, which is inconsistent with low-albedo objects (see Belskaya & Shevchenko, 2000). Therefore, it is reasonable to think that the magnitude enhancement was caused by a dusty coma near the nucleus.
Figure 3 (b) and (c) show the differences in magnitude between the observation and the nucleus model with respect to true anomaly and the heliocentric distance , respectively. There seems to be a weak trend that the residual increased toward perihelion [see Figure 3 (c)]. The magnitude enhancement appears at 1.2–1.4 au (or 285–300°), although the tail was not obvious in our composite images. We conjecture that the nuclear magnitude was brightened at 1.2–1.4 au because of a thin dusty coma, although it was not noticeable in our images. It is thus likely that the tail-like feature in Figure 1 (b) could be a dust tail associated with weak comet-like activity (see 3.1). We also noticed that the comet’s activity may not be symmetric with respect to perihelion. The differential magnitude has a peak at 340°, which is close to perihelion but slightly shifted toward the inbound orbit. Generally, activity peaks of comets tend to shift toward the post-perihelion passages (see, e.g., Ferrín, 2010). We conjecture that the activity peak prior to the perihelion may be associated with the seasonal variation of solar incident flux at a localized active region, as indicated for 9P/Tempel 1 (Schleicher, 2007).
3.4 Dust Tail and Meteoroid Ejection
To link a comet with a meteor shower, it is important to know how meteoric particles were ejected from the nucleus. We determine the size and ejection velocity using a simple but straightforward method shown below.
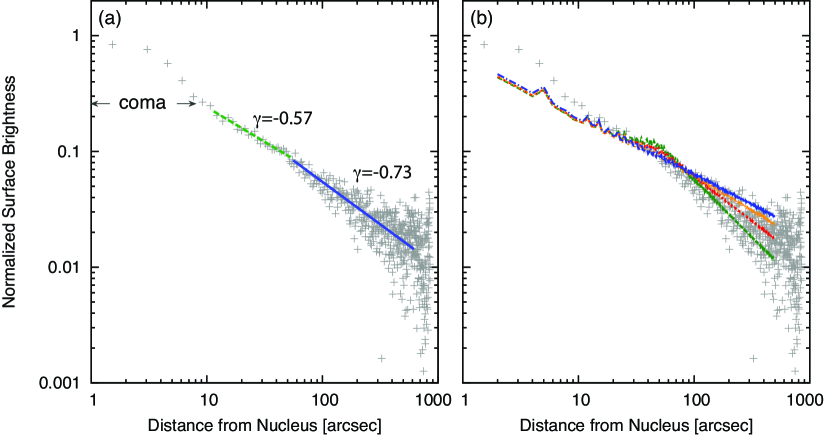
We noticed that the edge-on image provides a unique opportunity for deriving the size and ejection velocity. It was taken on UT 2014 May 23 [Figure 1 (d)] in a nearly edge-on view; that is, the angle between the observer and the 209P orbital plane was 3°. Figure 4 shows the surface brightness () profile of the dust tail integrated within a width of 3′ perpendicular to the projected orbit, as a function of the distance from the nucleus, . The profile at 6″ was contaminated by light from the nucleus. Since the comet moved rapidly on the sky plan (12′ min-1), it was elongated up to 8″ by inadequate tracking of the telescope.
In Figure 4, we found that an inflection point exists at ″. The surface brightness along the tail is consistent with , where at = 10″–50″ and at = 50″–300″. Because the difference in is significant to the accuracy of our measurement, we attribute the discontinuity at ″ to a discontinuous distribution of dust particles. When dust particles are ejected at a constant rate over a long interval, the resulting steady-state flow of dust particles yields a surface brightness distribution with = 0.5. The similarity in values between the observed data at = 10″–50″ and a steady-state flow suggests that dust particles flowed steadily owing to solar radiation pressure near the nucleus (″). In contrast, the steeper slope beyond ″ may suggest that only smaller particles reach the region, as considered in Jewitt et al. (2014). Assuming that the dust particles were ejected after late March at a constant rate, ″ corresponds to 3 10-5 or 1 cm (a density of =1 g cm-3 is assumed), where is again the ratio of the solar radiation pressure acceleration to solar gravity. We adopted the continuous dust ejection model in Jewitt et al. (2014) and found that the dust particles have a differential power-law size distribution with index 3.250.10. The ejection velocity perpendicular to the orbital plane was 0.7 m sec-1 for 1-cm grains. Assuming that dust particles were ejected symmetrically to the comet–Sun vector within a half opening angle of 30–60°, the net ejection velocity is estimated to be 0.8–1.4 m s-1. With the model, we also estimated the ejection velocity of 1-mm particles as 2.5–4.4 m s-1. The velocity is consistent with or slightly faster than the escape velocity (1.4 m s-1) from an 1850-m body with a nuclear mass density of 1 g cm-3. Assuming that the dust has the same optical properties as the nucleus, we derived a total dust grain mass of (2–8) 107 kg. Assuming that the particles were ejected for three months, from late March until late May, we obtained an average mass loss rate around perihelion of 2–10 kg s-1. The model predicts a loss of 2 108 particles s-1 for 1-mm particles. There seems to be an uncertainty of 3–5 times in the particle size due to the uncertain onset time of the active phase (i.e., late February or late March) and mass density (0.3–2 g cm-3). The uncertainty is translated into an uncertainty of 3–5 in the particle production rate. Considering all of the results above, we concluded that meteoric particles (1–10 mm) were marginally ejected from the highly dormant comet nucleus via gas outflow only when the comet was around perihelion.
The peak activity of the Camelopardalids occurred on UT 2014 May 24 as predicted. Brown (2014) reported that the shower signals were dominated by small particles of milligram mass and smaller (i.e. 1 mm). Further research is needed to connect the observed mass ejection for 209P and meteor shower, taking account of dynamical evolution (Vaubaillon & Colas, 2005) and probably fragmentation of dust aggregates (Madiedo et al., 2014).
4 Summary
We made observations of 209P during its perihelion passage in 2014 and found the following:
-
1.
209P/LINEAR was apparently inactive at the heliocentric distance = 1.6 au and showed weak activity at 1.4 au.
-
2.
The observed morphology is similar in the R and I bands, suggesting that scattered sunlight from the nucleus and dust particles was the dominant light source at these optical wavelengths.
-
3.
The comet was determined to have a negligibly small active fraction (0.001%) based on upper limit coma measurements made prior to the appearance of clear cometary activity.
-
4.
During the active phase, it ejected dust particles up to 1 cm in size with a differential power-law size distribution with index .
-
5.
The total ejected dust mass and average mass loss rate were (2–8) 107 kg and 2–10 kg sec-1, respectively.
Acknowledgments
This research was conducted as part of a joint research project titled “Recherche sur les liens entre comètes et météores.”
MI was supported by the Paris Observatory during his stay in Paris (2014 May–July). This research was also supported
by a National Research Foundation of Korea (NRF) grant funded by the Korean government (MEST) (No. 2012R1A4A1028713).
The observations at OAO, IAO, NHAO, and NO were supported by the Optical and Near-infrared Astronomy Inter-University
Cooperation Program and Grants-in-Aid for Scientific Research (23340048, 24000004, 24244014, and 24840031)
from the Ministry of Education, Culture, Sports, Science and Technology of Japan.
TRAPPIST is a project funded by the Belgian Fund for Scientific Research (Fonds National de la Recherche Scientifique, F.R.S.-FNRS).
C. Opitom acknowledges the support of the FNRS. E. Jehin and M. Gillon are FNRS Research Associates.
SH was supported by the Space Plasma Laboratory, ISAS, JAXA.
References
- Belskaya & Shevchenko (2000) Belskaya, I. N., & Shevchenko, V. G. 2000, Icarus, 147, 94
- Bowell et al. (1989) Bowell, E., Hapke, B., Domingue, D., et al. 1989, Asteroids II, 524
- Brown et al. (1996) Brown, M. E., Bouchez, A. H., Spinrad, A. H., & Johns-Krull, C. M. 1996, AJ, 112, 1197
- Brown (2014) Brown, P. 2014, Central Bureau Electronic Telegrams, 3886, 1
- Ferrín (2010) Ferrín, I. 2010, Planet. Space Sci., 58, 365
- Finson & Probstein (1968) Finson, M., & Probstein, R. 1968, ApJ, 154, 327
- Green (2014) Green, D. W. E. 2014, Central Bureau Electronic Telegrams, 3881, 1
- Holmberg et al. (2006) Holmberg, J., Flynn, C., & Portinari, L. 2006, MNRAS, 367, 449
- Ishiguro et al. (2007) Ishiguro, M., Sarugaku, Y., Ueno, M., Miura, N., Usui, F., Chun, M.-Y., & Kwon, S. M. 2007, Icarus, 189, 169
- Ishiguro et al. (2011) Ishiguro, M., Ham, J.-B., Tholen, D. J., et al. 2011, ApJ, 726, 101
- Ishiguro et al. (2013) Ishiguro, M., Kim, Y., Kim, J., et al. 2013, ApJ, 778, 19
- Ivezić et al. (2007) Ivezić, Ž., Smith, J. A., Miknaitis, G., et al. 2007, AJ, 134, 973
- Jehin et al. (2011) Jehin, E., Gillon, M., Queloz, D., et al. 2011, The Messenger, 145, 2
- Jenniskens & Lyytinen (2014) Jenniskens, P., & Lyytinen, E. 2014, Central Bureau Electronic Telegrams, 3869, 1
- Jewitt & Meech (1987) Jewitt, D. C., & Meech, K. J. 1987, ApJ, 317, 992
- Jewitt (2002) Jewitt, D. C. 2002, AJ, 123, 1039
- Jewitt et al. (2014) Jewitt, D., Ishiguro, M., Weaver, H., et al. 2014, AJ, 147, 117
- Kim et al. (2012) Kim, J., Ishiguro, M., Hanayama, H., et al. 2012, ApJ, 746, L11
- Landolt (1992) Landolt, A. U. 1992, AJ, 104, 1, 340
- Lumme et al. (1984) Lumme, K., Bowell, E., & Harris, A. W. 1984, BAAS, 16, 684
- Luu & Jewitt (1992) Luu, J. X., & Jewitt, D. C. 1992, Icarus, 97, 276
- Madiedo et al. (2014) Madiedo, J. M., Trigo-Rodríguez, J. M., Zamorano, J., et al. 2014, MNRAS, 445, 3309
- Mothé-Diniz et al. (2003) Mothé-Diniz, T., Carvano, J. M. Á., & Lazzaro, D. 2003, Icarus, 162, 10
- Schleicher (2007) Schleicher, D. G. 2007, Icarus, 191, 322
- Skrutskie et al. (2006) Skrutskie, M. F., Cutri, R. M., Stiening, R., et al. 2006, AJ, 131, 1163
- Schleicher (2014) Schleicher, D. 2014, Central Bureau Electronic Telegrams, 3880, 1
- Tancredi et al. (2006) Tancredi, G., Fernández, J. A., Rickman, H., & Licandro, J. 2006, Icarus, 182, 527
- Vaubaillon & Colas (2005) Vaubaillon, J., & Colas, F. 2005, A&A, 431, 1139
- Watanabe et al. (2012) Watanabe, M., Takahashi, Y., Sato, M., et al. 2012, Proc. SPIE, 8446,
- Ye & Wiegert (2014) Ye, Q., & Wiegert, P. A. 2014, MNRAS, 437, 3283
- Zappala et al. (1990) Zappala, V., Cellino, A., Barucci, A. M., Fulchignoni, M., & Lupishko, D. F. 1990, A&A, 231, 548
| Median UT | Telescope | Filter | r | Magg | Tailh | |||||
|---|---|---|---|---|---|---|---|---|---|---|
| 2014-Feb-01.418 | UH 2.2 m | R | 72 | 216 | 1.572 | 0.729 | 27.6 | 272.7 | 17.6 | No |
| 2014-Feb-16.540 | IAO 1.0 m | g′, R, I | 17 | 51 | 1.436 | 0.663 | 36.8 | 281.1 | 17.6 | No |
| 2014-Feb-22.697 | IAO 1.0 m | g′, R, I | 17 | 51 | 1.381 | 0.641 | 40.8 | 285.0 | 17.4 | No |
| 2014-Feb-28.598 | IAO 1.0 m | g′, R, I | 19 | 57 | 1.330 | 0.622 | 44.8 | 289.0 | 17.2 | No |
| 2014-Mar-03.855 | NHAO 2.0 m | R | 20 | 10 | 1.302 | 0.611 | 47.0 | 291.4 | 17.1 | No |
| 2014-Mar-07.641 | NHAO 2.0 m | R | 55 | 27.5 | 1.271 | 0.598 | 49.5 | 294.2 | 17.2 | No |
| 2014-Mar-16.551 | IAO 1.0 m | g′, R, I | 11 | 33 | 1.199 | 0.565 | 55.5 | 301.6 | 17.2 | No |
| 2014-Mar-22.604 | IAO 1.0 m | g′, R, I | 24 | 72 | 1.154 | 0.539 | 59.6 | 307.1 | – | Yes |
| 2014-Mar-23.660 | NHAO 2.0 m | R | 45 | 90 | 1.146 | 0.534 | 60.4 | 308.1 | 17.0 | Yes |
| 2014-Apr-01.502 | OAO 0.5 m | g′, R, I | 53 | 53 | 1.087 | 0.488 | 66.6 | 317.0 | 17.1 | Yes |
| 2014-Apr-02.618 | NHAO 2.0 m | R | 14 | 28 | 1.080 | 0.481 | 67.4 | 318.2 | 16.9 | Yes |
| 2014-Apr-04.562 | IAO 1.0 m | g′, R, I | 18 | 54 | 1.068 | 0.470 | 68.9 | 320.3 | 17.0 | Yes |
| 2014-Apr-04.620 | NHAO 2.0 m | R | 20 | 40 | 1.068 | 0.470 | 68.9 | 320.4 | 17.1 | Yes |
| 2014-Apr-06.643 | NHAO 2.0 m | R | 41 | 82 | 1.057 | 0.457 | 70.4 | 322.6 | 16.5 | Yes |
| 2014-Apr-09.514 | OAO 0.5 m | g′, R, I | 55 | 55 | 1.042 | 0.439 | 72.6 | 325.9 | 17.1 | Yes |
| 2014-Apr-10.596 | IAO 1.0 m | g′, R, I | 20 | 60 | 1.036 | 0.432 | 73.4 | 327.2 | 16.8 | Yes |
| 2014-Apr-16.534 | NHAO 2.0 m | R | 20 | 40 | 1.010 | 0.390 | 78.0 | 334.3 | 16.5 | Yes |
| 2014-Apr-17.610 | IAO 1.0 m | g′, R, I | 18 | 54 | 1.006 | 0.382 | 78.8 | 335.6 | 16.6 | Yes |
| 2014-Apr-18.547 | NHAO 2.0 m | R | 30 | 60 | 1.002 | 0.375 | 79.5 | 336.8 | 16.5 | Yes |
| 2014-Apr-19.638 | NHAO 2.0 m | R, I | 30 | 60 | 0.998 | 0.366 | 80.4 | 338.2 | 16.6 | Yes |
| 2014-Apr-22.549 | NHAO 2.0 m | R | 32 | 63 | 0.989 | 0.343 | 82.7 | 341.9 | 16.2 | Yes |
| 2014-Apr-24.503 | OAO 0.5 m | g′, R, I | 36 | 72 | 0.984 | 0.328 | 84.3 | 344.4 | 16.8 | Yes |
| 2014-Apr-25.544 | NHAO 2.0 m | R | 40 | 40 | 0.982 | 0.319 | 85.1 | 345.7 | 16.4 | Yes |
| 2014-Apr-29.572 | IAO 1.0 m | g′, R, I | 11 | 33 | 0.974 | 0.286 | 88.3 | 351.0 | 16.2 | Yes |
| 2014-May-02.486 | OAO 0.5 m | g′, R, I | 36 | 72 | 0.971 | 0.260 | 90.6 | 354.9 | 16.0 | Yes |
| 2014-May-03.584 | NHAO 2.0 m | R | 40 | 80 | 0.970 | 0.251 | 91.4 | 356.3 | 16.1 | Yes |
| 2014-May-04.610 | NO 1.6 m | R | 11 | 17 | 0.970 | 0.242 | 92.2 | 357.7 | 15.8 | Yes |
| 2014-May-10.491 | OAO 0.5 m | g′, R, I | 36 | 72 | 0.971 | 0.190 | 96.3 | 5.6 | 15.8 | Yes |
| 2014-May-10.534 | NHAO 2.0 m | R | 27 | 40.5 | 0.971 | 0.190 | 96.3 | 5.6 | 15.6 | Yes |
| 2014-May-15.531 | NHAO 2.0 m | R | 11 | 16.5 | 0.978 | 0.145 | 98.9 | 12.2 | 15.3 | Yes |
| 2014-May-16.542 | NHAO 2.0 m | R | 40 | 60 | 0.980 | 0.136 | 99.2 | 13.5 | 15.6 | Yes |
| 2014-May-17.486 | OAO 0.5 m | g′, R, I | 45 | 45 | 0.983 | 0.128 | 99.4 | 14.8 | 15.4 | Yes |
| 2014-May-17.541 | NHAO 2.0 m | R | 39 | 58.5 | 0.983 | 0.127 | 99.5 | 14.9 | 15.3 | Yes |
| 2014-May-19.888 | NO 1.6 m | R | 12 | 8 | 0.988 | 0.110 | 99.5 | 17.4 | 14.4 | Yes |
| 2014-May-21.547 | OAO 0.5 m | g′, R, I | 193 | 96.5 | 0.994 | 0.094 | 98.8 | 20.0 | 14.6 | Yes |
| 2014-May-22.508 | OAO 0.5 m | g′, R, I | 73 | 73 | 0.997 | 0.087 | 98.0 | 21.2 | 14.6 | Yes |
| 2014-May-23.541 | OAO 0.5 m | g′, R, I | 167 | 167 | 1.000 | 0.079 | 96.8 | 22.5 | 14.2 | Yes |
| 2014-May-24.491 | OAO 0.5 m | g′, R, I | 26 | 26 | 1.004 | 0.073 | 95.2 | 23.7 | 13.8 | Yes |
| 2014-May-25.504 | OAO 0.5 m | g′, R, I | 51 | 51 | 1.007 | 0.067 | 92.9 | 25.0 | 13.7 | Yes |
| 2014-May-25.586 | IAO 1.0 m | g′, R, I | 11 | 33 | 1.008 | 0.066 | 92.7 | 25.1 | 13.1 | Yes |
| 2014-May-27.522 | OAO 0.5 m | g′, R, I | 230 | 115 | 1.070 | 0.058 | 85.9 | 27.3 | 13.2 | Yes |
| 2014-May-27.535 | NHAO 2.0 m | R | 92 | 23.25 | 1.016 | 0.058 | 86.2 | 27.5 | 13.1 | Yes |
| 2014-May-28.006 | TRAPPIST 0.6 m | R | 2 | 6 | 1.017 | 0.057 | 84.3 | 28.0 | 12.7 | Yes |
| 2014-May-28.477 | OAO 0.5 m | g′, R, I | 18 | 9 | 1.020 | 0.056 | 82.2 | 28.6 | 13.4 | Yes |
| 2014-May-29.497 | OAO 0.5 m | g′, R, I | 52 | 26 | 1.024 | 0.055 | 77.6 | 29.8 | 13.0 | Yes |
| 2014-May-29.504 | IAO 1.0 m | g′, R, I | 46 | 23 | 1.024 | 0.056 | 77.6 | 29.8 | 13.0 | Yes |
| 2014-May-29.513 | NHAO 2.0 m | R | 105 | 26.25 | 1.024 | 0.056 | 77.6 | 29.8 | 13.1 | Yes |
| 2014-May-30.489 | OAO 0.5 m | g′, R, I | 102 | 51 | 1.029 | 0.057 | 73.3 | 31.0 | 12.7 | Yes |
| 2014-May-31.478 | OAO 0.5 m | g′, R, I | 52 | 26 | 1.033 | 0.059 | 69.4 | 32.2 | 12.8 | Yes |
| 2014-Jun-01.506 | IAO 1.0 m | g′, R, I | 7 | 3.5 | 1.038 | 0.064 | 65.9 | 33.4 | 12.1 | Yes |
| 2014-Jun-10.028 | TRAPPIST 0.6 m | R | 1 | 1 | 1.086 | 0.127 | 53.2 | 42.9 | 13.2 | Yes |
| 2014-Jun-16.990 | TRAPPIST 0.6 m | R | 5 | 5 | 1.132 | 0.191 | 48.6 | 50.0 | 14.7 | Yes |
| 2014-Jun-24.028 | TRAPPIST 0.6 m | R | 6 | 6 | 1.183 | 0.258 | 44.8 | 56.6 | 15.3 | Yes |