On the gamma-ray emission from 3C 120
We report the analysis of Fermi Large Area Telescope data from five years of observations of the broad line radio galaxy 3C 120. The accumulation of larger data set results in the detection of high-energy -rays up to 10 GeV, with a detection significance of about . A power-law spectrum with a photon index of and integrated flux of above 100 MeV well describe the data averaged over five year observations. The variability analysis of the light curve with 180-, and 365- day bins reveals flux increase (nearly twice from its average level) during the last year of observation. This variability on month timescales indicates the compactness of the emitting region. The -ray spectrum can be described as synchrotron self-Compton (SSC) emission from the electron population producing the radio-to-X-ray emission in the jet. The required electron energy density exceeds the one of magnetic field only by a factor of 2 meaning no significant deviation from equipartition.
Key Words.:
Galaxies: individual: 3C 120, gamma rays: galaxies, Radiation mechanisms: non-thermal1 Introduction
The -ray detection by Fermi-LAT from non-blazar active galactic nuclei (e.g. Cen A (Abdo et al., 2010b), M87 (Abdo et al., 2009a), Ngc 1275 (Abdo et al., 2009b)) shows that these are different and potentially very interesting classes of -ray emitters. This provides an alternative approach to study high energy emission processes compared with blazars where the emission is strongly Doppler boosted.
At the red shift , 3C 120 is a nearby Seyfert 1 radio galaxy which is active and powerful emitter of radiation at all the observed wavebands. Having a bright continuum and broad optical emission lines 3C 120 is usually classified as a Broad Line Radio Galaxy (BLRG). Hosting a black hole with a mass , well constrained from the reverberation mapping (Peterson et al., 2004), it has a radio morphology more similar to the Fanaroff-Riley class I radio sources (Fanaroff & Riley, 1974). The source has a powerful one sided radio jet extending from a sub- up to 100 scales (Walker et al., 1987). Observations with Very Long Baseline Array at frequencies (22, 43, and 86 GHz) reveal a very rich inner jet structure containing several superluminal components with apparent speed up to 4-6 (Homan et al., 2001; Gómez et al., 1998, 1999) that can be investigated with better resolution than most other extragalactic superluminal sources because of the relatively low redshift. The jet inclination angle to the line of sight is limited to be by the apparent motion (Eracleous & Halpern, 1998). Recently, using X-ray and radio observations, (Marscher et al., 2002) found that dips in the X-ray emission are followed by ejections of bright superluminal knots in the radio jet which clearly establishes an accretion-disk-jet connection.
In X-rays 3C 120 is a bright ( at 2-10 kev) and variable source on time scales from days to months (Halpern, 1985). The ASCA observation shows a broad iron line which can be fitted by Gaussian with keV and equivalent width of 400 eV. The knots in the jet of 3C 120 observed in radio and optical bands later have also been detected in the X-ray band with the ROSAT and chandra (Harris et al., 2004) that indicates the existence of high energy nonthermal particles in these knots. The origin of X-ray emission is highly debated especially when the extrapolation of synchrotron emission fails to account this emission. In these cases it can be explained by the inverse-Compton scattering of Cosmic Microwave Background (CMB) photons or by proton synchrotron emission, if so this component can be extended up to MeV/TeV range (Zhang et al., 2010; Aharonian, 2002).
At High Energies (HE; MeV) the source has not been detected with the EGRET on board the Compton Gamma Ray Observatory even though with several pointing observations (Lin et al., 1993). The upper limit on the source flux above 100 MeV is set to cm-2 s-1. Afterwards, the source is detected with the Fermi Large Are Telescope (Fermi-LAT) using 15 months of all sky exposures (Abdo et al., 2010c). The averaged HE spectrum between 100 MeV and 1 GeV can be described by the power-law with photon index and an integral flux cm-2 s-1 with the detection significance of . However the source is not included in the Fermi-LAT second source catalogue (Nolan et al., 2012) (2FGL) since the averaged signal appeared to be below the required threshold. This might be an evidence of the long term variability of the flux, since for a steady -ray signal the accumulation of longer data set (24- versus 15- months) should result an increase of the detection significance what was not detected.
Also the temporal variations of the -ray flux (above 100 MeV) have been investigated in short time scales (Abdo et al., 2010c; Kataoka et al., 2011). The light curve binned in the three-month-long periods shows only few episodes (one for 15- month (Abdo et al., 2010c) and 2 for 24- month (Kataoka et al., 2011) data sets) when the flux increased on the level more than and the rest of the time the source was undetectable by Fermi-LAT. This has been interpreted as a GeV flux variation on 90- day scales. However considering only 2 periods out of 8 has been detected and taking into account trials, post-trial significance probably is even lower than . Therefore the conclusions in this regards were inconclusive considering the limited/poor statistics of the detected signal.
The peculiar structure of 3C 120 implies different sites (sources) as the origin of the detected GeV -rays. Clearly, analogous with blazars, the non-thermal beamed radiation can be produced in the innermost part of the jet on the scales less than kilo-parsec (but not strongly boosted because of the larger jet inclination angle compared to blazars). In fact, a power-full jet observed at an inclination angle , producing radio to x-ray flux (with the luminosity ) via synchrotron emission can produce Doppler boosted -ray flux via inverse Compton scattering. Such an emission would appear as variable on week time scales or shorter with the luminosity which in principle can be detected by Fermi-LAT (depending on the magnetic field and emitting region size). On the other hand, the non variable -ray emission from the extended structures (e.g. extended lobes, large scale jet and knots) can extend up to the GeV energies and give (at least at some level) a contribution to the total observed -ray flux. For example, a -ray emission from the extended lobes of nearby Centaurus A radio galaxy contributes greater than one-half of the total source emission (Abdo et al., 2010a; Yang et al., 2012). Moreover, steady -ray emission from 3C 120 on the level of Fermi-LAT sensitivity has already been predicted from the jet knots within both proton synchrotron (Aharonian, 2002) and beamed CMB inverse Compton scenarios (Zhang et al., 2010). Therefore the compact and extended structures both remains possible sites for production of the observed -rays.
In general the absence of statistical significant indication of variability introduces uncertainties to distinguish between different emission mechanisms. In particular for 3C 120, giving presence of many prominent sites for -ray production, the possible variability (or non variability) is crucial for understanding the origin of HE emission. Moreover, the spectrum extending only up to 1 GeV does not provide any possibility to differ the mechanisms using the predicted different spectral shapes. Now the larger data set allows to study the spectrum with better statistics above 1 GeV as well as a detailed investigation of the variability. This motivated us to have a new look on the -ray emission based on the five years of Fermi-LAT data.
The paper is structured as follows. The results of spectral analysis are presented in Sect. 2 whereas the temporal analysis in Sect. 3. Implications of different emission mechanisms are discussed in the Sect. 4 and conclusions are presented in the Sect. 5.
2 Fermi-LAT Data Analysis
2.1 Data Extraction
Fermi-LAT on board the Fermi satellite is a pair-conversion telescope, operating since August 4, 2008 and is designed to detect HE -rays in the energy range 20 MeV - 300 GeV (Atwood et al., 2009). It constantly scans the entire sky every three hours and by default is always in the survey mode. Details about the LAT instrument can be found in (Atwood et al., 2009).
For the present analysis we use publicly available Fermi-LAT yr data from 4th August 2008 to 4th December 2013 (MET 239557417–407808003). We use the Pass 7 data and analyze them using the Fermi Science Tools v9r33p0 software package. Events with zenith angle and with energy between 100 MeV and 100 GeV were selected. Only the data when the rocking angle of the satellite that was , are used to reduce the contamination from the Earth limb -rays, which are produced by cosmic rays interacting with the atmosphere. We download photons from a region centered on VLBI radio position of 3C 120 (RA,dec)= (68.296, 5.354) and work with a square region of interest (ROI). Photons are binned with gtbin tool with a stereographic projection into pixels of and into 30 equal logarithmically-spaced energy bins. Then with the help of gtlike tool a standard binned maximum likelihood analysis is performed. The fitting model includes diffuse emission components and -ray sources within ROI (the model file is created based on the Fermi-LAT second catalog (Nolan et al., 2012)) and since 3C 120 is not included in 2FGL we added a point like source on the known location of 3C 120 (RA,dec)= (68.296, 5.354) (Ma et al., 1998). The Galactic background component is modeled using the LAT standard diffuse background model gll_ iem _ v05_ rev1 and iso_source_v05 for the isotropic -ray background. The normalization of background models as well as fluxes and spectral indices of sources within are left as free parameters in the analysis.
2.2 Spectral Analysis
We assume that the -ray emission from 3C 120 is described by the power-law and normalization and power-law index are considered as free parameters, then the binned likelihood analysis is performed. From a binned gtlike analysis, the best-fit power-law parameters for 3C 120 are
| (1) |
This corresponds to an integral flux of
| (2) |
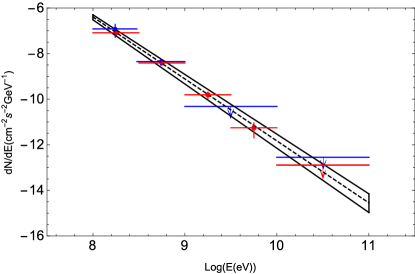
with only statistical errors taken into account. The test statistic (defined as TS = 2(log - log ), where and are the likelihoods when the source is included or not) is = 76.3 above 100 MeV, corresponding to a detection significance. The results are consistent with the parameters found in (Abdo et al., 2010c), namely photon index and integral flux ph cm-2s-1 above MeV. The value = 76.3 is above the threshold value TS=25 and 3C 120 should be included in the upcoming Fermi-LAT source catalogs.
Figure 1 shows the spectrum of 3C 120 obtained by separately running gtlike for 5 energy bands, where the dashed line shows the best-fit power-law function for the data given in Eq. (1). For comparison results from the previous study of 3C 120 (Abdo et al., 2010c) are presented as blue data points. For the highest energy bin (10-100 GeV), it is shown an upper limit.
Since we used the exposure of almost 2.5 times longer than used in 2 FGL, this can result additional faint sources in the data which are not properly accounted in the model file. In order
to check if any additional sources were present, the gttsmap Fermi tool is used with the best-fit model of 0.1- 100 GeV events to create a TS significance map of the region. Although, no significant excess hot spots (TS 25) are presented. Therefore, the model file used in the analysis gives a well representation of the data.
Next, we obtained the source localization with gtfindsrc, yielding R.A. = 68.205, decl. = 5.38 with a 95% confidence error circle radius of . These localizations are offset by from the VLBI radio position of 3C 120 (R.A. = 68.296, decl. = 5.354) (Ma et al., 1998).
3 Temporal Variability
The variability of the observed -ray flux could provide important constraints on the emitting region(s). The time scale of the observed flux variation would limit the (intrinsic) size of the -ray production region to where is the Doppler factor and is the red shift. During the previous variability study, using the accumulation of 90- day Fermi-LAT all-sky-survey exposures, the source shows two time intervals when whereas it was mostly being undetectable by Fermi-LAT. This could be interpreted as a possible variability at GeV energies (Kataoka et al., 2011).
Now, more observational data set (increased photon statistics) can provide more details in this regards. Accordingly the total observational time (from August 4th, 2008 to December 4th, 2013) is divided into different timescales and light curves are generated using the unbinned likelihood analysis with gtlike. In order to minimize uncertainties in the flux estimation, the photon indices of all sources are fixed to the values obtained in 100 MeV-100 GeV energy range for the whole time period. Instead, the normalization of 3C 120 and background point sources are treated as free parameters. Since no variability is expected from the underlying background diffuse emission, the normalization of both background components is fixed to the values which were obtained for the whole time period.
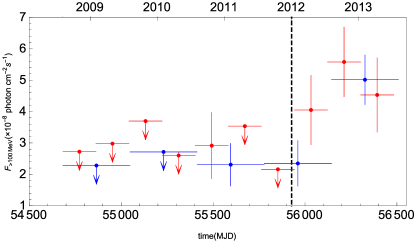
In Fig. 2 is shown the -ray flux variation above 100 MeV for 180- and 365- days sampling with red and blue data points respectively. It is noticeable that up to MJD, -rays from 3C 120 are below Fermi-LAT sensitivity (detection significance TS 10). Afterwards a cycle with faint -ray emission changes and then the produced flux is sufficient to be detected by Fermi-LAT. For example, the averaged flux in a year sampling is more than twice higher than its average level (see Fig. 2) with highest test statistics corresponding to (similarly for 180- day sampling ). Probably this is caused by the changes in emission states e.g. the source moves in a state which is characterized by more effective production of -rays resulting a flux increase. This flux increase gives proof of flux variability on month timescales.
In addition to reported month time scale variability, flux variation for shorter time periods e.g. a month or sub-month time scales has been performed over the time interval where the increase of flux was detected. Accordingly the unibinned likelihood analysis is performed using shorter time sampling (7 - and 15 - days) for the time period MJD. Interestingly, a -ray signal from the source is detected above threshold using a sampling of only 7- days. Required condition was fulfilled only in three time intervals with the maximum detection significance reached in the last week of September 2013. The corresponding flux is nearly an order of magnitude higher than average flux level presented in Eq. 2. Because of limited statistics, however, no definite conclusion on shorter time scale variability can be drawn.
4 Disscusion and Interpretation
The month time scale variability of 3C 120 ( 6 month) denotes the compactness of the emitting region. Under any reasonable assumption for Doppler boosting, , the emitting region cannot be larger than . This immediately allows us to exclude jet knots as the main sites where the observed -rays are produced. Most likely the -rays are produced in a compact region of the jet e.g. the blob moving with relativistic velocities. Generally the broad band spectrum of blazars (as well as from radio-galaxies which have jets oriented at systematically larger angles to our line of sight) are successfully described by the Synchrotron/Synchrotron self-Compton (SSC) (Ghisellini et al., 1985; Celotti et al., 1991; Bloom & Marscher, 1996) model. In this modeling the low energy emission (radio through optical) is represented as a synchrotron emission from leptons in the homogeneous, randomly oriented magnetic field () while HE component (from x-ray to HE -ray) is an inverse Compton scattering of the same synchrotron photons. This kind of interpretation for 3C 120 is the first choice considering the results of the modeling of the other Fermi-LAT observed radio galaxies (Abdo et al., 2010b, 2009a, 2009b). Here we apply SSC mechanism to model the overall SED of 3C 120 particularly in the 0.1-100 GeV energy range. The multifrequency data (sub MeV/GeV energies) are from the simultaneous (quasi simultaneous) observations of the 3C 120 (Giommi et al., 2012).
We suppose that the emission is coming from a spherical region with the radius moving with Lorentz factor . The emission is boosted by where is the angle between the bulk velocity and the line of sight. The electron distribution follows with naturally expected from the shock acceleration theories and the electron energy density () scales with the one of the magnetic field (). Then, several independent parameters used in the modeling can be constrained from the observations. In particular, the superluminal speed puts an upper limit to the jet‘s inclination angle to be (Eracleous & Halpern, 1998). Thus, the flux would be modestly boosted with the Doppler factor if the emitting region moves with the bulk Lorentz factor at the inclination angle of . Next, monthly timescale variability ( days) implies that the emitting region is confined to a volume which radius is determined from the relation cm. The Doppler factor of requires an emitting region with the size cm.
| (mG) | |||||
|---|---|---|---|---|---|
| solid line | 30 | 2.4 | 700 | 1.9 | |
| dashed line | 25 | 2.8 | 800 | 16 | |
| dot dashed line | 25 | 2.0 | 2500 | 1.3 |
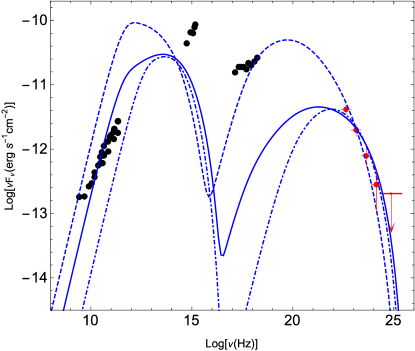
We assume that HE emission has a pure SSC origin. As a first step, the radio data are included in the modeling which means that the same electron population is responsible for both synchrotron and inverse-Compton emissions. The best guess values of electron energy distribution which allows us to properly reproduce the low and HE data corresponds to , and (dashed line in Fig. 3). Other model parameters are presented in Table 1. The ratio of non- thermal electron and magnetic field energy densities is equal to (for magnetic field mG). In this case the jet power in the form of the magnetic field and electron kinetic energy, given by and , respectively, are and . The total jet power , defined as , corresponds to which is noticeable high. One can disfavor such by modeling noting that the necessary jet power is of the same order as Eddington accretion power for the black hole mass in 3C 120. But this is not a strong argument considering that some blazars might operate in the super-Eddington regime as follows from observations (Bonnoli et al., 2011).
However, this is not the case, since the jet power can be relaxed interpretending the hard X-ray emission originates from the thermal Comptonization near the disk. Thus, the predicted flux by SSC component falls below the hard X-ray limit in Fig. 3 (solid line). Indeed, a reasonable good modeling of both radio and HE data gives an electron distribution with the index between and . The jet energy carried out by particles (electrons) and magnetic field corresponds to which is still high but not dramatic. Moreover unlike the other case the electron non-thermal and magnetic field energy densities are close to equipartition (for mG). Even though the ratio can not be rejected recalling other blazars where the jet is massively out of equipartition, the later modeling has an advantage considering required total jet power.
In principle the radio to X-ray and -ray emissions can be produced in a different sites (blobs). Supposing the radio flux does not exceed the one presented in (Giommi et al., 2012) the electron distribution with a typical power-law index predicted from strong shock acceleration theories can reproduce HE -ray data (dot dashed line in Fig. 3). The modeling requires relatively high low energy cut-off and energy equipartition between nonthermal electrons and magnetic field (for mG). Moreover, the total jet kinetic power is approximately twice less than in the previous modeling. From the point of view of the necessary lower energy this model has an advantage over the previous modelings. Nevertheless this is very sensitive to the choice of the which can be constrained only with the simultaneous data. Although, the radio data presented in Fig. 3 are not synchronous, they can be treated as an upper limit. Consequently the expected luminosity should not be higher than the above obtained value.
In Fig. 3 SSC mechanism provides a good fit to all data except those in the optical/UV band Hz. This UV excess is likely caused by direct thermal emission from the accretion disc. Indeed, a thermal component with a black body temperature K and a luminosity can explain detected UV flux. This lower limit to the temperature and luminosity corresponds to minimal UV flux reported in (Giommi et al., 2012) and presented in Fig. 3 but hotter and luminous disc is expected to explain observed data. Thus, SSC radiation plus thermal component (contribution of the accretion disc) can satisfactorily reproduce the entire SED (including UV data). However detailed modeling of the thermal component goes beyond the scope of this paper.
5 Conclusion
We report on the recent observations of 3C 120 with Fermi-LAT. The source is detected up to 10 GeV with statistically significant significance as a result of the accumulation of the data from longer all sky exposure. The photon index corresponds to similar to the nearby FR1 class radio source Centaurus A with the comparable black hole mass (Abdo et al., 2010b) and photon flux above 100 MeV. Adapting the Mpc distance, this equals to which lies in the typical isotropic -ray luminosity range of FR I sources detected by Fermi-LAT (Abdo et al., 2010c).
Albeit, the observed -ray flux is relatively faint compared with other Fermi-LAT detected radio galaxies (), the isotropic -ray luminosity is quite impressive when compared with the Eddington luminosity .
We report also an interesting modification of the -ray flux in time. Initially the source described by the -ray flux mostly below than the Fermi-LAT sensitivity threshold appears to be frequently detected afterwards. The flux is almost twice more than its average level in the last year of the selected time period (from 2008 to late 2013, see Fig. 2). This increase of flux shows monthly scale variability of 3C 120 indicating that the -rays are produced in sup-parsec regions. A common behavior of the light curves in any day sampling (a month or more): the source is mostly undetectable by Fermi-LAT prior to March 2012 then it turns to be mostly in -ray production duty cycles. Moreover the long lasting source activity which probably continues after December 2013 (nearly 2 years) indicates a change in the -ray production state (from low to high) rather than flaring activity as seen in many blazars (generally in short time scales). In principle this change can have different physical origins. First, the change in the central engine, where possible jets obtain much of their energy from the infall of matter into a supermassive black hole, can at least can have some influence. The change in the jet power, hence higher intensity -ray, which is expected in the case when the additional matter is fueling the accretion disk. In theory the observations of the region closer to the black hole with sensitive X-ray instruments (e.g. chandra, XMM-Newton) can prove such a possibility. On the other hand, the environmental influence on the changes in -ray emission states can not be rejected considering the large scale powerful jet up to 100 (e.g. target interacting with the jet). Any of the above mentioned possibilities would be supported by multiwavelength observations. This is beyond the scope of this paper and will be investigated in the future works.
One zone SSC model is used to fit broadband emission from 3C 120. Assuming -rays are produced in a compact region ( cm) this modeling gives an adequate fit to the SED with modest Doppler boosting and no significant bias from equipartition . The necessary jet kinetic power is which corresponds to 10 % of Eddington power.
Acknowledgements.
We warmly thank Felix Aharonian for detailed and constructive comments that improved the manuscript.References
- Abdo et al. (2009a) Abdo, A. A., Ackermann, M., Ajello, M., et al. 2009a, ApJ, 707, 55
- Abdo et al. (2010a) Abdo, A. A., Ackermann, M., Ajello, M., et al. 2010a, Science, 328, 725
- Abdo et al. (2010b) Abdo, A. A., Ackermann, M., Ajello, M., et al. 2010b, ApJ, 719, 1433
- Abdo et al. (2009b) Abdo, A. A., Ackermann, M., Ajello, M., et al. 2009b, ApJ, 699, 31
- Abdo et al. (2010c) Abdo, A. A., Ackermann, M., Ajello, M., et al. 2010c, ApJ, 720, 912
- Aharonian (2002) Aharonian, F. A. 2002, MNRAS, 332, 215
- Atwood et al. (2009) Atwood, W. B., Abdo, A. A., Ackermann, M., et al. 2009, ApJ, 697, 1071
- Bloom & Marscher (1996) Bloom, S. D. & Marscher, A. P. 1996, ApJ, 461, 657
- Bonnoli et al. (2011) Bonnoli, G., Ghisellini, G., Foschini, L., Tavecchio, F., & Ghirlanda, G. 2011, MNRAS, 410, 368
- Celotti et al. (1991) Celotti, A., Maraschi, L., & Treves, A. 1991, ApJ, 377, 403
- Eracleous & Halpern (1998) Eracleous, M. & Halpern, J. P. 1998, ApJ, 505, 577
- Fanaroff & Riley (1974) Fanaroff, B. L. & Riley, J. M. 1974, MNRAS, 167, 31P
- Ghisellini et al. (1985) Ghisellini, G., Maraschi, L., & Treves, A. 1985, A&A, 146, 204
- Giommi et al. (2012) Giommi, P., Polenta, G., Lähteenmäki, A., et al. 2012, A&A, 541, A160
- Gómez et al. (1999) Gómez, J.-L., Marscher, A. P., & Alberdi, A. 1999, ApJ, 521, L29
- Gómez et al. (1998) Gómez, J.-L., Marscher, A. P., Alberdi, A., Martí, J. M., & Ibáñez, J. M. 1998, ApJ, 499, 221
- Halpern (1985) Halpern, J. P. 1985, ApJ, 290, 130
- Harris et al. (2004) Harris, D. E., Mossman, A. E., & Walker, R. C. 2004, ApJ, 615, 161
- Homan et al. (2001) Homan, D. C., Ojha, R., Wardle, J. F. C., et al. 2001, ApJ, 549, 840
- Kataoka et al. (2011) Kataoka, J., Stawarz, Ł., Takahashi, Y., et al. 2011, ApJ, 740, 29
- Lin et al. (1993) Lin, Y. C., Bertsch, D. L., Dingus, B. L., et al. 1993, ApJ, 416, L53
- Ma et al. (1998) Ma, C., Arias, E. F., Eubanks, T. M., et al. 1998, AJ, 116, 516
- Marscher et al. (2002) Marscher, A. P., Jorstad, S. G., Gómez, J.-L., et al. 2002, Nature, 417, 625
- Massaro et al. (2006) Massaro, E., Tramacere, A., Perri, M., Giommi, P., & Tosti, G. 2006, A&A, 448, 861
- Nolan et al. (2012) Nolan, P. L., Abdo, A. A., Ackermann, M., et al. 2012, ApJS, 199, 31
- Peterson et al. (2004) Peterson, B. M., Ferrarese, L., Gilbert, K. M., et al. 2004, ApJ, 613, 682
- Tramacere et al. (2009) Tramacere, A., Giommi, P., Perri, M., Verrecchia, F., & Tosti, G. 2009, A&A, 501, 879
- Tramacere et al. (2011) Tramacere, A., Massaro, E., & Taylor, A. M. 2011, ApJ, 739, 66
- Walker et al. (1987) Walker, R. C., Benson, J. M., & Unwin, S. C. 1987, ApJ, 316, 546
- Yang et al. (2012) Yang, R.-Z., Sahakyan, N., de Ona Wilhelmi, E., Aharonian, F., & Rieger, F. 2012, A&A, 542, A19
- Zhang et al. (2010) Zhang, J., Bai, J. M., Chen, L., & Liang, E. 2010, ApJ, 710, 1017