An X-ray flare from 47 Cas
Abstract
Using XMM-Newton observation, we investigate properties of a flare from the very active and poorly known stellar system 47 Cas. The luminosity at the peak of the flare was found to be , which is times more than that at quiescent state. The quiescent state corona of 47 Cas was represented by two temperature plasma: 3.7 and 11.0 MK. The time-resolved X-ray spectroscopy of the flare showed the variable nature of the temperature, the emission measure, and the abundance. The maximum temperature during the flare was found to be 72.8 MK. We inferred the length of a flaring loop to be cm using a hydrodynamic loop model. Using the RGS spectra, the density during the flare was found to be cm-3. The loop scaling laws were also applied when deriving physical parameters of the flaring plasma.
Subject headings:
Star:individual (47 Cas) — star:flare — star:X-ray — star:late–type — star:magnetic1. Introduction
X-ray flares are common phenomena in late-type stars and it is believed that they are produced by the same mechanism as solar flares, namely magnetic reconnection. However, stellar flares show very high temperatures and an extremely large total energy. Observationally, stellar flares are defined as a sudden enhancement of an intensity followed by a gradual decay. The study of stellar flares is a valuable tool for understanding stellar coronae as these are dynamical events that consist of different information than the quiescent state observations (Favata et al., 2005; Getman et al., 2008a, b; Pandey & Singh, 2008, 2012).
For the present study, we have chosen a poorly known early F-type main sequence stellar system, 47 Cas. It is supposed that the 47 Cas system consists of an unseen companion, 47 Cas B, which has been detected only in the radio wavelength by Güdel et al. (1998) and for which no optical characterization is available thus far. The HIPPARCOS catalog lists the young and rapidly rotating F0V star, 47 Cas, as a close visual binary with a period of about 1616 days. Güdel et al. (1995, 1998) have studied 47 Cas using X-ray (ROSAT) and radio (6cm) observations. Their study suggests that X-ray and radio emissions from 47 Cas are due to the late-type companion. Garner & Etzel (1998) have also suggested that the X-Ray and radio activities are similar to a chromospherically active solar-type companion. Furthermore, signatures of coronal activity are not normally associated with early F-type main-sequence stars. Later, the high resolution X-ray spectra of 47 Cas from XMM-Newton were analyzed by Ness et al. (2003); Telleschi et al. (2005) and Nordon & Behar (2008) with an aim of abundance analysis. In this paper, we have analyzed the flaring feature in the 47 Cas system observed from XMM-Newton. The paper is organized as follows: observations and data reduction are described in Section 2, analyses of XMM-Newton observations are explained in Section 3, and loop parameters are derived in Section 4. Finally, we discuss and conclude our results in Section 5.
2. Observations and data reduction
47 Cas was observed by the XMM-Newton satellite using the European Photon Imaging Camera (EPIC) and Reflection Grating Spectrometer (RGS) instruments on 2001 September 11 at 02:21:19 UT for 40 ks. The EPIC consists of three CCDs behind three X-ray telescopes (Jansen et al., 2001); the two identical metal oxide semiconductor (MOS) CCDs, MOS1 and MOS2 (Turner et al., 2001), and one p-n junction CCD, PN (Strüder et al., 2001). The EPIC instrument provides imaging and spectroscopy in the energy range of 0.15–15 keV with an angular resolution of 4.5-6.6 arcsec and a spectral resolution () of 20-50. The RGS consists of two identical grating spectrometers, RGS1 and RGS2, behind different mirrors (den Herder et al., 2001). The dispersed photons are recorded by a strip of eight CCD MOS chips. One of these chips has failed in each spectrometer, leading to gaps in the spectra which fortunately affect different spectral regions. The RGS covers the wavelength range of approximately 6–38 Å (E = 2.5–0.3 keV) with a resolution of 0.05 Å and a peak effective area of about 140 cm2 at 15 Å.
We have used standard XMM-Newton Science Analysis System (SAS) software, version 13.5.0 with updated calibration files for reducing the EPIC and RGS data of 47 Cas. The pipeline processing of raw EPIC Observation Data Files was done using the epchain and emchain tasks, which allow calibrations both in energy and astrometry of the events registered in each CCD chip. However, the metatask rgsproc was used to generate the RGS event files. For the EPIC data, we have restricted our analysis to the energy band 0.3–10.0 keV due to background contribution at high energies where stellar sources have undetectable fluxes. We have also checked the data for pileup and high background proton flares and they are free from these effects. The SAS task evselect was used to extract the event list files. X-ray light curves and spectra from the EPIC observations of the 47 Cas system were generated from on-source counts obtained from circular regions with a radius of 40 arcsec around the source. The background was chosen from source-free regions on the detectors surrounding the source. In order to correct the light curve for good time intervals, dead time, exposure, point-spread function, quantum efficiency, and background contribution, the SAS epiclccorr was used . However, the EPIC spectra were generated from especget, which also computes the photon redistribution as well as the ancillary matrix. Finally, the spectra were rebinned to have a minimum of 20 counts per spectral bin.
3. Analysis and results
3.1. X-ray light curves
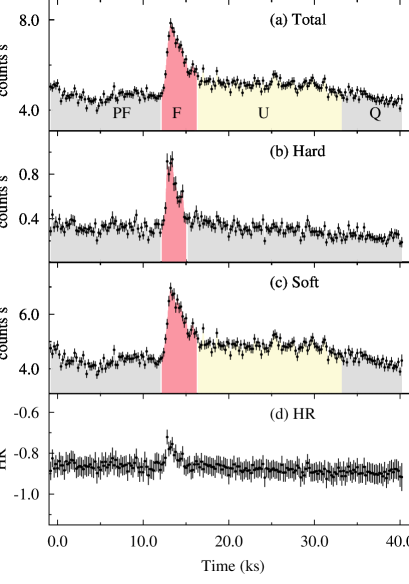
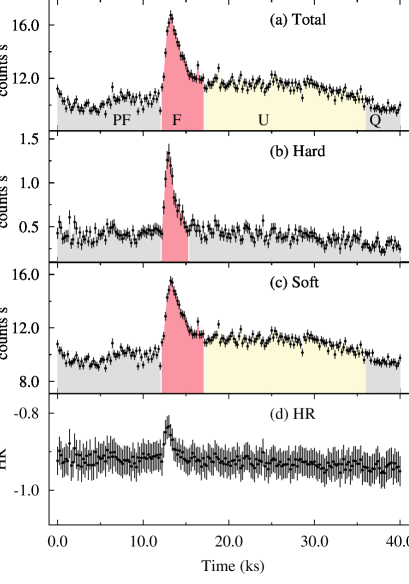
Figure 1 shows the background subtracted X-ray light curve of 47 Cas in the total (0.3–10.0 kev), soft (0.3–2.0 keV) and hard (2.0–10.0 kev) energy bands with a temporal binning of 200s. The light curves in all energy bands show variability, which resembles flaring activity. The flaring feature is marked with an ‘F’ in Figure 1. The flare began after 11.2 ks from the start of PN observations and lasted for 4.8 ks. In the total energy band, the count rate at the peak of the flare was found to be 1.8 times more than that in the quiescent state. However, the flare peak to quiescent state count ratios were found to be 1.7 and 4.4 in the soft and hard energy bands, respectively. After the end of the flare an active level ‘U’ was identified where the average flux was 1.2 times more than that in the quiescent state. The level ‘U’ was identified only in the soft and total energy bands, and no such feature was seen in the hard energy band. In the total energy band, e-folding rise () and decay () times of the flare observed in 47 Cas were derived to be s and s, respectively. However, and were derived as s and s, and s and s in the soft and hard energy bands, respectively.
The bottom panel of Figure 1 shows the temporal variation of the hardness ratio (HR). The HR is defined as ; where and are the count rates in the hard and soft bands, respectively. The variation in the HR during the flares is indicative of changes in the coronal temperature. The HR varied in a fashion similar to its light curves, indicating an increase in the temperature at the flare peak and a subsequent cooling.
3.2. X-ray Spectral Analysis
3.2.1 Quiescent state spectra
The quiescent state X-ray spectra were extracted from the ‘Q’ part of the light curve. The quiescent state coronal parameters of 47 Cas were derived by fitting the X-ray spectra with a single (1T) and double (2T) temperature collisional plasma models known as apec (Smith et al., 2001) as implemented in the X-ray spectral fitting package xspec (Arnaud, 1996) version 12.8.1. The global abundances () and interstellar hydrogen column density () were left as free parameters. The is modeled with cross sections obtained by Morrison & McCammon (1983); however, the solar photospheric abundances () were adopted from Anders & Grevesse (1989). Both 1T and 2T plasma models with solar photospheric abundances were rejected due to the high value of . The 2T model with with sub-solar abundances was found to be acceptable with a reduced of 1.2. By adding one more component to the temperature in fitting, we did not find any further improvement in the reduced ; therefore, we assume that the quiescent coronae of 47 Cas were well represented by two temperatures plasma. The cool and hot temperatures and the corresponding emission measures were derived as keV and keV, and cm-3 and cm-3, respectively. The value of was derived to be cm-2, which is lower than that of the total galactic Hi column density (Dickey & Lockman, 1990) towards the direction of 47 Cas. The abundance during the quiescent state of 47 Cas was derived to be The quiescent state X-ray flux of 47 Cas was estimated by using the cflux model in xspec and are corrected for . The unabsorbed X-ray luminosity of 47 Cas during its quiescence was derived to be .
3.2.2 Flare Spectra
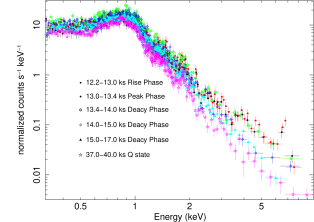
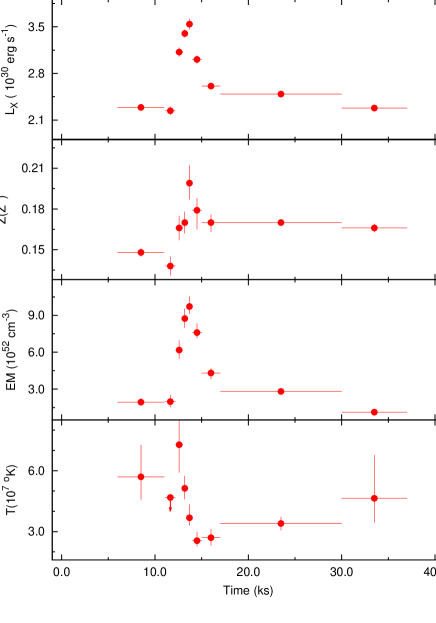
The X-ray light curve of 47 Cas was divided into 11 time bins, and spectra of each time interval were extracted and analyzed to trace the spectral changes during the flare. These divisions were made to ensure that spectra in each time bin have sufficient counts to provide reliable values of spectral parameters. Figure 2 shows the spectra of different time intervals during the flaring and quiescent states. The spectral evolution can be seen clearly. In order to study the flare emission only, we have performed three temperature spectral fits of the data, with the quiescent emission taken into account by including its best-fitting 2T model as a frozen background contribution, which allows us to derive one ”effective” temperature and one EM of the flaring plasma. Initially, was a free parameter in the spectral fitting and appeared to be constant during the flare to the quiescent state value. Therefore, in the next stage of spectral fitting, was fixed to the quiescent state value along with the parameters of the first two temperature components. Abundances and temperature and normalization of the third component were free parameters in the spectral fitting. The resulting temporal evolution of the spectral parameters of the flare is shown in Figure 3 and derived parameters are given in Table 1.
Abundances, temperature, and the corresponding emission measure were found to vary during the flare. The peak value of was derived to be , which is well above the 4 level to the minimum value observed. The flare temperature peaked at 72.8 MK during the rise phase of the flare, which is times more than the minimum value at the end of the decay phase. The EM followed the flare light curve and peaked later than the temperature at a value of cm-2, which is times more than the minimum value observed at the end of the flare. The reached a value of , which is 1.8 times more than that of the quiescent state. The flux during ”U” was 1.3 times more than that during quiescent state.
3.2.3 Density measurement: The RGS spectra
| Time bins (ks) | T | EM | (dof) | ||
|---|---|---|---|---|---|
| (from-to) | ( ∘K) | () | ) | ||
| 6.0-11.0 | 1.26(361) | ||||
| 11.1-12.2 | 1.10(223) | ||||
| 12.2-13.0 | 1.00(220) | ||||
| 13.0-13.4 | 1.02(272) | ||||
| 13.4-14.0 | 1.11(203) | ||||
| 14.0-15.0 | 1.11(241) | ||||
| 15.0-17.0 | 1.19(282) | ||||
| 17.0-30.0 | 1.08(487) | ||||
| 30.0-37.0 | 1.12(386) |
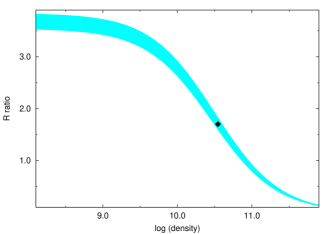
The RGS spectra of 47 Cas were analyzed in detail by Ness et al. (2003); Telleschi et al. (2005) and Nordon & Behar (2008); therefore, we have restricted our analysis to the Ovii line only to determine the density. The density values during the flare and the quiescent state of 47 Cas were derived by using He-like triplets from Ovii. The most intense He-like lines correspond to transitions between the shell and the ground state shell. The excited state transitions 1P1, 3P1 and 3S1 to the ground state 1S0 are called resonance (), intercombination () and forbidden () lines, respectively. In the X-ray spectra, the ratio of fluxes in forbidden and intercombination lines () is potentially sensitive to density (), while the ratio is sensitive to temperature (Porquet et al., 2001; Gabriel & Jordan, 1969). Of the He-like ions observed with the RGS, Ovii has lines that are strong and unblended to use in a measurement of . Figure 4 (a) shows the He-like triplet from the Ovii line. Line fluxes were measured using the xspec package by fitting the RGS1 spectra with a sum of narrow Gaussian emission lines convolved with the response matrices of the RGS instruments. The continuum emission was described using Bremsstrahlung models at the temperatures of the plasma components inferred from the analysis of the EPIC spectra during the quiescent state. We have used the CHIANTI atomic database version 7.1 (Dere et al., 1997; Landi et al., 2013) to derive the and ratios. The ratio of for 47 Cas implies a formation temperature of the Ovii triplet of MK, which is similar to that for other active stars (Ness et al., 2002). Figure 4 (b) is a plot of the ratio and density as calculated from the CHIANTI atomic database. A value of the ratio of leads to an electron density of cm-3 during the flare. However, the electron density during the quiescent state was estimated as cm-3, which is well withinthe level of the electron density during the flare.

4. Loop length and flare parameters
Flares cannot be resolved spatially on a star, but show many analogies with solar flares. Therefore, by analogy with solar flares and using flare loop models, it is possible to infer the physical size and morphology of loop structures involved in a stellar flare. In order to derive loop parameters, many approaches have been developed for the analysis of stellar flares; in general, these are based on some physical model of the flaring region and a fit of the observed decay behavior to the model. Reale et al. (1997) introduced a time-dependent hydrodynamic model to infer the geometrical size of the flaring loop, which is based on the decay time, and the evolution of temperature and EM during the flare decay. This model includes both plasma cooling and the effect of heating during flare decay. The loop length () from hydrodynamic method is given as
| (1) |
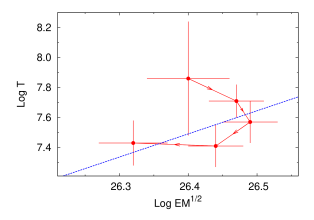
The observed peak temperature must be corrected to a maximum value using , where is the maximum best-fit temperature derived from spectral fitting to the data. The unitless correction factor is ; where is the slope of the log – log diagram (Reale, 2007). Figure 5 shows the log – log T diagram during the flare. We derive the value of to be , indicating the presence of sustained heating during the decay of the flare was negligible. The value of in the upper extreme is outside the domain of the validity of the method, therefore, the loop length was derived by using the lower extreme value of (i.e. 0.48) and estimated as cm.
After finding , and , we can derive the pressure (), the volume (), and the minimum magnetic field () to confine the flaring plasma as
| (2) |
using cm-3, cm-3 and K. The estimated values of , and during the flare observed in 47 Cas were 804 dyne cm-2, cm3 and 142 Gauss, respectively.
5. Discussion and conclusions
We have carried out an analysis of the flare observed in 47 Cas using X-ray data from XMM-Newton. The rise and decay times of the flare were found to be similar to those of the flares observed from G-K dwarfs (Pandey & Singh, 2008) and are smaller than those from evolved RS CVn-type and pre-main-sequence stars (Pandey & Singh, 2012; Getman et al., 2008a). These data along with the flare luminosity suggest that the flare from 47 Cas is an impulsive flare (Pallavicini et al., 1990), which is similar to a compact solar flare. The compact flares are less energetic (), short in duration ( hour) and confined to a single loop. The in the soft energy band was higher than that in the hard energy band. A similar tendency was also noticed in many flares observed from G-K dwarfs. This could probably be due to the softening of the spectrum during the decay due to the plasma cooling, i.e. emission gradually shifts from the high energy band to deeper in the soft energy band. We have also noticed the heightened emission after the flare in the soft energy band. Similar behavior in light curves was seen in the flares from Boo (Pandey & Srivastava, 2009) and CC Eri (Pandey & Singh, 2008; Crespo-Chacón et al., 2007). It also appears that before the flaring event the X-ray light curve was not constant. Such small-scale variability in the X-ray light curve before and after the flaring event could be due to the emergence of smaller flares during the observations. Continuous low-level variability due to small flares has also been reported for active dwarfs and giants (Vilhu et al., 1993; Kürster et al., 1997; Mathioudakis & Mullan, 1999; Ayres et al., 2001). We have derived a maximum temperature of 72.8 MK at the beginning of the flare, which is more than that observed in many flares from similar dwarfs (Pandey & Singh, 2008). The EM peaked later than the temperature during the decay of the flare. Similar delay often has been observed both in solar and stellar flares (Sylwester et al., 1993; Favata et al., 2000; Maggio et al., 2000; Stelzer et al., 2002; Pandey & Singh, 2008, 2012). This could be due to a coherent plasma evolution during the flare and therefore, a flare occurring inside a single loop, or at least the presence of a dominant loop early in the flare. We found a significant increase in the abundances from 0.13 to 0.2 during the flare. A possible explanation for an enhancement in abundances during the flare is due to the evaporation of fresh chromospheric material in the flaring loops. Using the RGS spectra of 47 Cas, Nordon & Behar (2008) and Telleschi et al. (2005) found a small enhancement of abundances of low first-ionization-potential metals. However, this enhancement in the abundances was well within a level.
The length of the flaring structure was derived to be cm using a state-of-art hydrodynamic method based on the decay phase. We have also derived the loop length from other methods as given by Haisch (1983), Hawley et al. (1995), Shibata & Yokoyama (2002) and Aschwanden et al. (2008), and we found that the loop lengths from these methods are consistent with that from Reale et al. (1997)’s method. Many authors in the past have compared the loop lengths from the above methods and some of them found consistent loop lengths (Covino et al., 2001; Bhatt et al., 2014); however, others found inconsistencies in the loop length determination (Favata et al., 2001; Shibata & Yokoyama, 2002; Srivastava et al., 2013). Considering 47 Cas to be an early G-type star (Güdel et al., 1998), the loop length was found to be less than the half of the stellar radius and much less than the pressure scale height of cm. Here, pressure scale height is defined as ; where is the Boltzmann constant, is the plasma temperature, is the mean molecular weight in terms of the proton’s rest mass, and is the surface gravity of the star. The pressure and density derived for the present flare are intermediate between those of the flares from G-K dwarfs (Pandey & Singh, 2008).
Due to the lack of multi-wavelength coverage, a detailed assessment of the energy budget of the present flare is not possible. However, using the scaling laws from Rosner et al. (1978), the heating rate per unit volume can be determined as , where and are plasma temperature and loop length. Using cm, the value of was obtained as . The total heating rate at the flare maximum is estimated as, . In order to satisfy the energy balance relation for the flaring as a whole, the maximum X-ray luminosity must be lower than the total energy rate () at the flare peak. For the present flare, the total energy rate was found to be times more than the peak X-ray luminosity. This value is in agreement with those reported for the solar flares where the soft X-ray radiation only accounts for up to 20 % of the total energy (Wu et al., 1986), but is smaller than many flares from solar-like stars. The total energy released from the flare was found to be erg over 4.8 ks, which is equivalent to s of the star’s bolometric energy output. The total X-ray energy released during the flare from 47 Cas indicates that this flare was as energetic as flares from other G-K dwarfs ( ergs; Pandey & Singh 2008). If we assume heating is constant for the initial rise phase, which lasts for s, and then decays exponentially, with an e-folding time of s, the total energy [(+)] is estimated as erg, which is approximately 30 times more than the energy radiated in X-rays.
It is believed that the magnetic field provides the main source of energy for the solar/stellar activities including flares. In order to know the strength of the magnetic field () required to accumulate the emitted energy, we assume that the energy released during the flare is indeed of magnetic origin and it occurs entirely within a single coronal loop structure. The total energy can be estimated as
| (3) |
Using the values of , and , the total magnetic field required to produce the flare is estimated to be Gauss.
The parameters derived from the present analyses indicate that the X-ray flare on 47 Cas is similar to a solar impulsive flare whose height () is only 15% of the stellar radius.
References
- Anders & Grevesse (1989) Anders, E., & Grevesse, N. 1989, Geochim. Cosmochim. Acta, 53, 197
- Arnaud (1996) Arnaud, K. A. 1996, Astronomical Data Analysis Software and Systems V, 101, 17
- Aschwanden et al. (2008) Aschwanden, M. J., Stern, R. A., Güdel, M. 2008, ApJ, 672, 659
- Ayres et al. (2001) Ayres, T. R., Osten, R. A., & Brown, A. 2001, ApJ, 562, L83
- Bhatt et al. (2014) Bhatt, H., Pandey, J. C., Singh, K. P., Sagar, R., & Kumar, B. 2014, Journal of Astrophysics and Astronomy, 35, 39
- Covino et al. (2001) Covino, S., Panzera, M. R., Tagliaferri, G., & Pallavicini R., 2001, A&A, 371, 973
- Crespo-Chacón et al. (2007) Crespo-Chacón, I., Micela, G., Reale, F., et al. 2007, A&A, 471, 929
- den Herder et al. (2001) den Herder, J. W., Brinkman, A. C., Kahn, S. M., et al. 2001, A&A, 365, L7
- Dere et al. (1997) Dere, K. P., Landi, E., Mason, H. E., Monsignori Fossi, B. C., & Young, P. R. 1997, A&AS, 125, 149
- Dickey & Lockman (1990) Dickey, J. M., & Lockman, F. J. 1990, ARA&A, 28, 215
- Favata et al. (2000) Favata, F., Micela, G., & Reale, F. 2000, A&A, 354, 1021
- Favata et al. (2001) Favata, F., Micela, G., & Reale, F. 2001, A&A, 375, 485
- Favata et al. (2005) Favata, F., Flaccomio, E., Reale, F., et al. 2005, ApJS, 160, 469
- Garner & Etzel (1998) Garner, H. L., & Etzel, P. B. 1998, Bulletin of the American Astronomical Society, 30, 834
- Gabriel & Jordan (1969) Gabriel, A. H., & Jordan, C. 1969, Nature, 221, 947
- Getman et al. (2008a) Getman, K. V., Feigelson, E. D., Micela, G., et al. 2008a, ApJ, 688, 437
- Getman et al. (2008b) Getman, K. V., Feigelson, E. D., Broos, P. S., Micela, G., & Garmire, G. P. 2008b, ApJ, 688, 418
- Güdel et al. (1995) Güdel, M., Schmitt, J. H. M. M., & Benz, A. O. 1995, A&A, 293, L49
- Güdel et al. (1998) Güdel, M., Guinan, E. F., Etzel, P. B., et al. 1998, Cool Stars, Stellar Systems, and the Sun, 154, 1247
- Haisch (1983) Haisch, B. M. 1983, IAU Colloq. 71: Activity in Red-Dwarf Stars, 102, 255
- Hawley et al. (1995) Hawley, S. L., Fisher, G. H., Simon, T., et al. 1995, ApJ, 453, 464
- Jansen et al. (2001) Jansen, F., Lumb, D., Altieri, B., et al. 2001, A&A, 365, L1
- Kürster et al. (1997) Kürster, M., Schmitt, J. H. M. M., Cutispoto, G., & Dennerl, K. 1997, A&A, 320, 831
- Landi et al. (2013) Landi, E., Young, P. R., Dere, K. P., Del Zanna, G., & Mason, H. E. 2013, ApJ, 763, 86
- Maggio et al. (2000) Maggio, A., Pallavicini, R., Reale, F., & Tagliaferri, G. 2000, A&A, 356, 627
- Mathioudakis & Mullan (1999) Mathioudakis, M., & Mullan, D. J. 1999, A&A, 342, 524
- Morrison & McCammon (1983) Morrison, R., & McCammon, D. 1983, ApJ, 270, 119
- Ness et al. (2003) Ness, J.-U., Schmitt, J. H. M. M., Audard, M., Güdel, M., & Mewe, R. 2003, A&A, 407, 347
- Ness et al. (2002) Ness, J.-U., Mewe, R., Schmitt, J. H. M. M., et al. 2002, Stellar Coronae in the Chandra and XMM-NEWTON Era, 277, 127
- Nordon & Behar (2008) Nordon, R., & Behar, E. 2008, A&A, 482, 639
- Pallavicini et al. (1990) Pallavicini, R., Tagliaferri, G., Stella, L., 1990, A&A, 228, 403
- Pandey & Singh (2008) Pandey, J. C., & Singh, K. P. 2008, MNRAS, 387, 1627
- Pandey & Srivastava (2009) Pandey, J. C., & Srivastava, A. K. 2009, ApJ, 697, L153
- Pandey & Singh (2012) Pandey, J. C., & Singh, K. P. 2012, MNRAS, 419, 1219
- Porquet et al. (2001) Porquet, D., Mewe, R., Dubau, J., Raassen, A. J. J., & Kaastra, J. S. 2001, A&A, 376, 1113
- Reale et al. (1997) Reale, F., Betta, R., Peres, G., Serio, S., & McTiernan, J. 1997, A&A, 325, 782
- Reale (2007) Reale, F. 2007, A&A, 471, 271
- Rosner et al. (1978) Rosner, R., Tucker, W. H., & Vaiana, G. S. 1978, ApJ, 220, 643
- Shibata & Yokoyama (2002) Shibata, K., & Yokoyama, T. 2002, ApJ, 577, 422
- Srivastava et al. (2013) Srivastava, A. K., Lalitha, S., & Pandey, J. C., 2013, ApJ, 778, 28
- Stelzer et al. (2002) Stelzer, B., Burwitz, V., Audard, M., et al. 2002, A&A, 392, 585
- Sylwester et al. (1993) Sylwester, B., Sylwester, J., Serio, S., et al. 1993, A&A, 267, 586
- Smith et al. (2001) Smith, R. K., Brickhouse, N. S., Liedahl, D. A., Raymond, J. C. 2001, ApJ, 556, 91
- Strüder et al. (2001) Strüder, L., Aschenbach, B., Bräuninger, H., et al. 2001, A&A, 375, L5
- Telleschi et al. (2005) Telleschi, A., Güdel, M., Briggs, K., et al. 2005, ApJ, 622, 653
- Turner et al. (2001) Turner, M. J. L., Abbey, A., Arnaud, M., et al. 2001, A&A, 365, L27
- Wu et al. (1986) Wu, S. T. et al., 1986, in Kundu M., Woodgate B., eds, NASA Conf. Publ. 2439, Energitic Phenomenon on the Sun. NASA, Washington, DC, p. 5
- Vilhu et al. (1993) Vilhu, O., Collier Cameron, A., Budding, E., Banks, T., Slee, B., 1993, A&A, 278, 467