Free Collisions in a Microgravity Many-Particle Experiment. IV. - Three-Dimensional Analysis of Collision Properties
Abstract
The bouncing barrier, a parameter combination at which dust particles in the protoplanetary disk always rebound in mutual collisions, is one of the crucial steps of planet formation. In the past years, several experiments have been performed to determine the mass and velocity regimes at which perfect bouncing does occur and those where there is a chance of the aggregates sticking together. We conducted a microgravity experiment, which allows us to investigate free collisions of millimeter-sized dust aggregates at the relevant velocities. We analyzed 52 collisions in detail with velocities of to and found four of them leading to sticking, while the other aggregates rebounded. Three out of the four sticking collisions occurred at velocities where previously only bouncing had been predicted. Although the probability for sticking is low, this opens a new possibility for growth beyond millimeter sizes. Our setup allowed us to obtain the complete three-dimensional collision information. Since most previous experiments were interpreted based on two-dimensional information, we compare our three-dimensional values with those obtained if only one projection had been available. We find that the error of a two-dimensional analysis of the collision velocity is very small. The distribution of the coefficient of restitution in the two-dimensional view is representative of the real case, but for any given collision its value can be far off. Impact parameters always have to be analyzed three-dimensionally, because the two-dimensional values are not meaningful in any way.
keywords:
Collisional physics; Experimental techniques; Origin, Solar System; Planetary formation; Planetesimals1 Introduction
The early evolution towards planetesimals is dominated by the collisions among dust aggregates. Starting at sizes of about one micrometer, dust particles orbit around their young host star in a disk of gas and dust, called the protoplanetary disk (PPD). Several effects lead to relative velocities and, thus, to collisions among the particles, like Brownian motion, sedimentation and turbulence in the gas (Weidenschilling,, 1977). A wealth of laboratory experiments has been conducted to investigate the possible outcomes of these collisions (see e.g. Blum and Wurm,, 2008, and Güttler et al.,, 2010). While in general collisions at sufficiently low impact energies lead to sticking of the particles caused by van der Waals forces and those above a certain threshold lead to destruction, the details are more complex. Güttler et al., (2010) compiled the experimental results into a first complete model for the collision behavior of dust aggregates. Based on previous experiments, this model predicts the outcome of a collision between two dust aggregates of given masses, relative velocity and porosity. The model has been used for local and 1D growth simulations in various PPD configurations by Zsom et al., (2010, 2011). They found that dust aggregates grow at most to sizes of about one centimeter. It should also be mentioned that the dust-aggregate collision model by Güttler et al., (2010) used extrapolations for parameter-space regions where previously there had not been any experiments.
In order to experimentally fill these gaps in parameter space, we carried out a series of microgravity experiments at low collision velocities (see e.g. Weidling et al.,, 2012, Kothe et al.,, 2013, Brisset et al., submitted). On the numerical side, the equations governing Smoluchovski solvers were improved (Windmark et al., 2012a, ; Windmark et al., 2012b, ; Dra̧żkowska et al.,, 2013) so that reliable simulations of dust-aggregate evolution in PPDs are possible. The simulations show that the introduction of particles with sizes beyond the bouncing barrier, which may form in dead zones or as CAIs, can grow towards planetesimal sizes due to collisions with mass transfer. An alternative avenue to planetesimals may be due to a succession of streaming and gravitational instability (Johansen and Youdin,, 2007; Johansen et al.,, 2007). Local overdensities of cm-sized solid material in the gas disk attract more dust aggregates due to the streaming instability until the particle ensemble gravitationally collapses and forms bodies several kilometers in size. Wahlberg Jansson and Johansen, (2014) show that for low-mass planetesimals the gravitational collapse is smooth so that the gravitationally infalling dust aggregates do not experience fragmentation. This assumption has been made by Skorov and Blum, (2012) in their model of comet nuclei and Blum et al., (2014) show that only this formation model is consistent with current comet activity. Thus, and regardless of the subsequent growth process, it is important to understand the details of the formation of cm-sized dust aggregates in PPDs.
2 Experimental Setup
The experimental setup consists of a cylindrical glass vacuum chamber filled with dust aggregates. The dust aggregates inside the glass tube are imaged with a high-speed camera at 500 frames per second. An LED array with diffusors behind the vacuum chamber provides homogeneous background illumination. The vacuum tube has a height of 50 mm and a diameter of 25 mm and is placed on top of a shaking mechanism. This mechanism consists of an eccentric wheel with the rotation axis being perpendicular to the chambers’ symmetry axis. A more detailed description of the setup is given in Weidling et al., (2012). For the experiments we present in this paper, the setup called MEDEA-II was used in the Bremen drop tower, which is an upgraded version of the previously-flown MEDEA (Microgravity Experiment on Dust Environments in Astrophysics) experiment. The experiment was placed on the drop-tower catapult mechanism, allowing for a microgravity time of slightly more than 9 seconds, during which residual accelerations were negligible.
An equal-sided refraction prism with angles of 130∘ and 25∘ was mounted in the optical path of the camera in such a way as to yield two views of the glass vacuum chamber separated by a viewing angle of 30∘. This allows for the reconstruction of the three-dimensional trajectories of the particles while assuring that the dust aggregates visible in the two views can be correlated.
A turbomolecular pump was attached to the vacuum chamber to reduce the gas friction that was observed in Weidling et al., (2012). In the experimental run analyzed here, we evacuated the chamber to mbar. This is equivalent to a mean free path of the gas molecules of 28 mm. As this is much larger than the typical dust-aggregate diameter of about 1 mm, the particles are in the Epstein drag regime so that their stopping time can be calculated following Blum, (2006). For the experiment analyzed here, we get = 202 s. It should be mentioned that this is the e-folding time of the coupling of the dust-aggregate motion to the gas motion. Thus, a dust aggregate moving otherwise undisturbed in the vacuum chamber with the residual gas at rest loses at most of their original velocity due to gas friction over the entire duration of the experiment. Since the parts of the aggregate trajectories analyzed here are much shorter than 9 s, we henceforth neglect the effect of gas drag on the motion of the dust aggregates.
During their preparation, the dust aggregates were sieved and only those remaining between two sieves with mesh sizes of 1.6 mm and 1 mm, respectively, were used. The sieved dust aggregates have an average mass of kg. They consist of irregular, polydisperse with a material density of 2600 and 90% of the monomer constituents possess a size between 0.1 to 10 m, rendering them ideal analog particles for PPD dust. As was shown in Weidling et al., (2012), the dust aggregates have a volume filling factor of 0.35. More details on the dust properties can be found in Blum et al., (2006).
Approximately 300 dust aggregates were placed into the vacuum chamber to obtain an average optical depth of around 0.3. This ensured a multitude of collisions between the dust aggregates while being transparent enough to track the trajectories of single particles. Assuming a mean velocity of 0.1 the average collision time in this case is 0.16 s.
The shaking mechanism was set to three different frequencies during the course of the experiment. Each cycle lasted three seconds with the angular frequency being (in this order) 20.8 rad s-1, 10.5 rad s-1, and 4.9 rad s-1, respectively. With an amplitude of the rotational motion of the shaker of 0.5 mm, this results in a maximum wall speed during these phases of 9 , 4 , and 2 , respectively, with a maximum centrifugal acceleration of 0.18 , 0.05 , and 0.01 , respectively. While collisions with the walls do happen, they do not alter the properties of the dust aggregates beyond what they already experienced from the preparation (Weidling et al.,, 2009).
A movie of the entire experiment can be found in the online version of this article.
3 Results
Analysis. In order to quantify the results of the multi-particle collision experiment, knowledge of the positions of all dust aggregates is required over the full duration of the experiment. Having obtained these, we can then calculate the instantaneous velocities of all dust aggregates. To reach this goal, we first binarized the images, separating the dark dust aggregates from the bright background. A threshold value for the intensity was selected in such a way as to preserve the projected area of the dust aggregates as quantitatively as possible. To rule out any adverse effects of the background illumination, which was not perfectly homogeneous, we compared the software-derived area of a sample of chosen dust aggregates with manual evaluations and found that the automated calculation yields very accurate values, independent of the position of the dust aggregate in the vacuum chamber and, therefore, the intensity of the local background illumination.
We then used the semi-automated tracking program briefly described in Weidling et al., (2012). The software stores the image number, position and cross-sectional area of each dust aggregate, under the condition that it possesses no overlap with any other particle. Additionally, it offers the possibility to store events, which are manual entries of collisions with other dust aggregates or the chamber wall. These events enable us to later sort through the tracks and quickly find the points of interest.
In a next step, we correlated the dust-aggregate events of interest in the two views of the experiment. This resulted in a total of 43 collisions in which both dust aggregates had been tracked sufficiently long to reconstruct their three-dimensional trajectories before and after the collision of the two dust aggregates. The trajectories were calculated by first linearly fitting the two 2D projections of each track separately. Then, the fit parameters were used for the calculation of the cartesian 3D trajectory properties. For simplicity, we chose for the left view of our three-dimensional images the coordinates and , with being the coordinate along the symmetry axis of the glass cylinder and perpendicular to it and perpendicular to the viewing direction of the left image. The remaining coordinate in a cartesian coordinate system was then calculated from the coordinates of the center of mass of the considered dust aggregate in the left and right image, and , respectively, each perpendicular to the symmetry axis of the glass cylinder and perpendicular to the respective viewing direction. With an angle of 30∘ separating the two views, the coordinate is then given by . To compensate for a possible offset of the two views due to inhomogeneities the optical system, we used for the -coordinate the mean value of the respective coordinate in the two projections, and , respectively, i.e. .
Comparison between 2D and 3D. For free-floating particles in a closed system, one could expect an equipartition of energy in all translational directions. In that case, the 3D velocities are expected to be a factor of higher than the the projected 2D velocities. Here, however, the -direction is also the direction of agitation, introducing the kinetic energy into the system preferably in this direction. Therefore, we expect a smaller difference than this factor 1.22 between 3D and 2D velocity. In Weidling et al., (2012), we determined a factor of 1.13 for experiments of the same type but with a different shaking profile. The exact difference between the velocity component in the direction of shaking, , and the two components perpendicular to that, and , respectively, depends on the shaking profile as well as on the number density of dust aggregates. In the experiment presented here, we found that the 3D velocities are on average a factor of 1.10 larger than the 2D velocities computed from the average of the two views. If we only compare the 2D velocities from the left or the right view with the 3D velocity, the ratio is a factor of 1.07 and 1.13, respectively. The median value for the ratio of 3D to 2D velocity is even less, only a factor of 1.02.
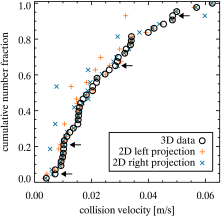
Figure 1 (left) shows the collision velocity of the 43 pairs of dust aggregates for which we could analyze the trajectories three-dimensionally (black circles). For each collision, the orange pluses and blue crosses denote the values that were calculated based on the 2D projections only. As can be seen, the 2D information is in almost all cases a fair representation of the actual value. This means that the component of the velocity pointing in the direction of view is almost always small compared to the visible 2D velocity. Only in very few cases, like in the sticking collision (marked by an arrow) with the highest velocity, do the apparent velocities calculated based on the projections differ significantly. However, it should be noted that in this special case one dust aggregate was visible only for a very short time, leading to large uncertainties in the trajectory fits and, therefore, in the values of the velocity components.
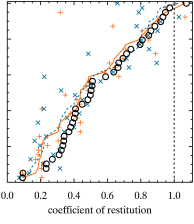
The coefficient of restitution , the ratio of the relative velocity of two colliding dust aggregates after and before contact, was also calculated for the 2D and the 3D case (see Figure 1 (middle)). Here, is an incomplete measure for the loss of energy in a collision, as for the moment we neglect rotational energy of the dust aggregates. Although we could clearly observe many of the aggregates rotating to a certain degree (see Section 4), for most of them the images between two collisions were too few to yield a good estimate of the rotation frequency and rotational direction. As a result, it is possible to obtain values of if rotational energy was transformed to translational energy in the collision; may also occur if the viewing geometry leads to a more severe underestimation of the velocity before the collision than of the velocity after the contact.
On average, the three-dimensionally calculated coefficient of restitution is 20% larger than its corresponding 2D values that are calculated based on the analysis of only one projection. The values for any specific collision can deviate significantly (see Figure 1 (middle)). Therefore, one cannot draw conclusions about the real 3D value if only one 2D value is known.The mean error of the 3D value is , the individual errors of the data points are shown in Figure 2. For most collisions the 2D values (orange pluses and blue crosses) underestimate the 3D value (black circles). Sorting the 2D values cumulatively (orange solid and blue dashed lines) reveals that the distributions in the 2D case are similar, but slightly smaller than the distribution of the 3D values. This is owing to the fact that after a collision the dust-aggregate velocities are more isotropic than before, when the velocities are determined by the container shaking.
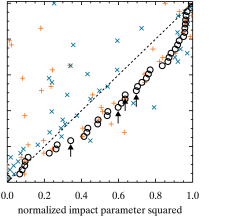
For random collisions one would expect a uniform distribution of the normalized squared impact parameter . Here, is the separation of the two centers of mass at the time of contact and is its projection perpendicular to the direction of the relative velocity. For this experiment, the values mostly follow the expected uniform distribution. Impact parameter values in the range are slightly underrepresented statistically (15% instead of 30% of all collisions) and are slightly overrepresented statistically (25% instead of 10% of all collisions) in the range . The statistics of the remaining values confirms the expectation, so all in all the distribution of impact parameters reasonably well describes random impacts. Having many collisions with a high impact parameter may be a selection effect of our analysis, since more central collisions (with a low ) yield a smaller coefficient of restitution (see Figure 3), meaning that the dust aggregates are slowed down much more after a central collision so that one has to wait longer until the dust-aggregate projections are separated again. Due to the rather high optical depth in our experiment (see Section 2), it is, thus, much more likely that other particles’ projections start to overlap with the dust aggregates of interest during this extended time interval, making it hard or even impossible to track the dust aggregates after the collision. In this case, we might still get information about the collision velocity and outcome, but for an analysis of the other parameters (e.g. impact parameter), we chose only those events for which we have the complete three-dimensional data, both from before and after the collision. Therefore, it is more likely that we could use the data obtained from a grazing collision with a high impact parameter, where the particle projections separate more quickly, than from a more central collision.
Whether the two-dimensional value is a good representation of the actual impact parameter strongly depends on the viewing geometry. Therefore, the only information that can be drawn from a two-dimensional value is the minimum normalized impact parameter in three dimensions. The real 3D value is always higher than or equal to the 2D value. Exceptions in the data, where some 2D values are higher than their corresponding 3D values, are due to uncertainties in the determination of the exact trajectories and may also result if one of the particles deviates significantly from the spherical shape.
3.1 Collision parameters
Many collision models predict the rebound velocity for central collisions of two solid, spherical particles. They are based on material parameters, like, e.g., Young’s modulus and specific surface energy, and yield the collision velocity below which the particles stick to each other and the coefficient of restitution for higher velocities. In Weidling et al., (2012), we showed that this concept can be transferred to dust-aggregate collisions used in the MEDEA setup. There, we followed the approach of Thornton and Ning, (1998) for adhesive elastic spheres, using a modified value for the surface energy to account for the structure of our porous dust aggregates to derive the sticking velocity of our aggregates.
However, in the experiment analyzed here, it is not possible to make any statement about the sticking velocity based on systematics of the coefficient of restitution data. We find that the coefficient of restitution possesses a mean value of and scatters widely from to , while the collision velocities span only one order of magnitude (see Figure 2). The single value greater than 1 is an effect of rotational energy being transformed into translational kinetic energy in the collision. The errors in the velocities were derived from the -uncertainties in the fits to the trajectories, the error in by error propagation.
We can find no trend in our data for how the coefficient of restitution changes with velocity. Fitting the model by Thornton and Ning, (1998) directly to the data or to data bins did not yield any viable results. A linear relation between the coefficient of restitution and the impact velocity can also be ruled out, the Pearson correlation coefficient is only 0.001 (see Figure 2). The formal linear fit (solid black line) is nearly constant, but the -uncertainties (area enveloped by the dotted lines) show that the trend might as well be increasing or decreasing, rendering it impossible to predict whether the collisions occur at velocities above or below the yield velocity. The yield velocity marks the onset of plastic deformation within the colliding dust aggregates and is close to the inflection point of the curve of the coefficient of restitution in the Thornton and Ning, model. It is also important in order to determine the sticking velocity from the velocity dependence of the coefficient of restitution.
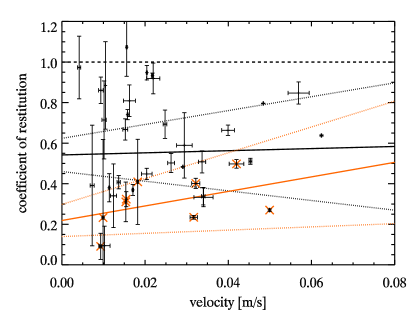
Since the impact parameter clearly has an influence on the coefficient of restitution (see Figure 3), we investigated the result of central collisions, where . This threshold was chosen since for higher impact parameters the scattering of the coefficient of restitution increased rapidly. The central collisions are marked by an additional orange cross in Figure 2. The orange solid line shows the result of a linear fit to this subset of data, with the dotted lines marking the -uncertainties. The fit shows an increase of the coefficient of restitution with increasing velocity, suggesting that our velocity range is in between the sticking velocity and the yield velocity of the Thornton and Ning, model. However, due to the limited number of central collisions, we can not quantify these two velocities.
Therefore, we think the coefficient of restitution in our experiment can best be described as a uniform distribution (see Fig. 1 (middle)) of over the given velocity range, with the latter being the standard deviation of the values. The scattering of the coefficient of restitution very likely is a result of randomly oriented collisions instead of head-on collisions (as modeled by Thornton and Ning, (1998)), the differences in particle size and, therefore, mass, and the irregularity of the surfaces of our dust aggregates, respectively. The considerable amount of scattering of the coefficient of restitution for collisions with velocities below 0.02 can be attributed to rotation (see Section 4). For these collisions the rotational energy cannot be neglected, however, we were not able to quantify the rotation for these dust aggregates. Depending on whether rotational energy was transferred into kinetic energy in the collision or vice versa, the coefficient of restitution can be dramatically increased or decreased. However, it should be noted that any real system with particles would probably also show scattering, which might lead to effects that are not expected based solely on idealized models.
The three-dimensional analysis also allows us to investigate a dependency of the coefficient of restitution on the impact parameter. In Figure 3 we show the squared coefficient of restitution over the squared normalized impact parameter . The circles represent the results of the bouncing collisions. Here, the orange filled circles show collisions with a collision velocity larger than 0.02, where the scatter due to the importance of rotation is greatly reduced. Collisions slower than this are marked by the black open circles. The arrows show the impact parameters at which we observed sticking. The data suggest that the energy loss in a central collision is higher than for a grazing collision.
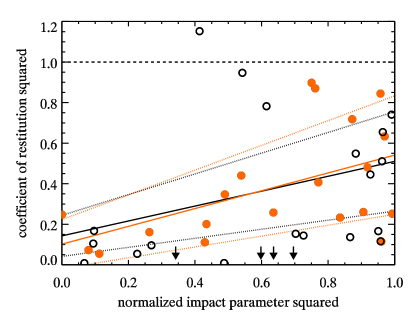
In Weidling et al., (2012), we observed the same effect with smaller dust aggregates of the same material colliding at approximately the same velocities. There, we found for central collisions and for grazing collisions from a linear least-squares fit to the data. Blum and Münch, (1993) found an identical trend in their experiments with dust aggregates made up of ZrSiO4 and Aerosil. Their dust aggregates had about the same size as ours, but had lower volume filling factors and collided at higher velocities. In order to remove a possible effect of the velocity on the coefficient of restitution, they separated their results in velocity bins. In our case, we showed that there is no visible dependence between the two, so that we can use all the available data. Blum and Münch, (1993) found central collisions to lead to a squared coefficient of restitution of to , depending on the material, and to for grazing collisions (their Table 2). All of the experiments agree very well with the theoretically derived value of by Blum and Münch,.
Our results match the previous ones, with and (solid black line in Figure 3 with the dotted black lines enveloping the 1-range). This is the result of a linear least-squares fit to the data of all collisions. If we only take those values into account, where the collision velocity was larger than 0.2 (filled orange circles in 3), the values change slightly to and (solid orange line with the 1-range given by the orange dotted lines). Since is a measure of the energy loss in a collision, this means that about 40% more of the initial kinetic energy is dissipated in central collisions, leading to more densely compacted aggregates.
Since we only observed four sticking collisions, we cannot be certain whether the impact parameter has an influence on the sticking probability or not. However, the spread of the values seems to indicate that sticking can occur independently of the impact angle.
3.2 Collision outcomes
In total, we observed 43 collisions for which we could obtain the complete three-dimensional trajectories of the involved dust aggregates. An example is shown in Figure 4, where a sequence of images shows the collision of two dust aggregates with a relative velocity of from both available views. The aggregates are highlighted by the brighter background. They clearly separate again after contact.
The observed dust aggregates collided with relative velocities between and . While the dust aggregates rebounded in 39 cases, we also observed them sticking together in 4 cases at velocities between and . As can be seen in Figure 1 the sticking collisions do not stand out in any way with respect to the collision velocity and impact parameter. Therefore, sticking of dust aggregates should be seen as a statistical process, most likely caused by minor differences in the structures of the dust aggregates. Examples of a bouncing and a sticking collision can be seen in the online version of this article.
An additional 9 collisions were analyzed that were visible in only one of the projections. In all of these latter cases, the dust aggregates bounced off each other. The collision velocities ranged from to .
In Figure 5 we show the results of all analyzed collisions with respect to their collision velocity and the mass of the smaller of the two dust aggregates, as was first introduced by Güttler et al., (2010). The gray solid line marks the combination of parameters where all collisions of faster or more massive dust aggregates would lead to bouncing according to Kothe et al., (2013). Slower or less massive dust aggregates may stick with a certain probability, with the 50% level marked by the dashed line. Diamonds mark the bouncing collisions that we could analyze in 3D and squares those that were analyzed in 2D. The filled black circles denote the four sticking collisions.
It is worth noting that only one of the sticking collisions actually occurred in the parameter space for which the model derived in Kothe et al., (2013) predicted sticking to be possible. The other three events indicate that the model needs to be updated yet again and that most likely the transition from perfect sticking to perfect bouncing collisions is even wider than in the current version of the model.
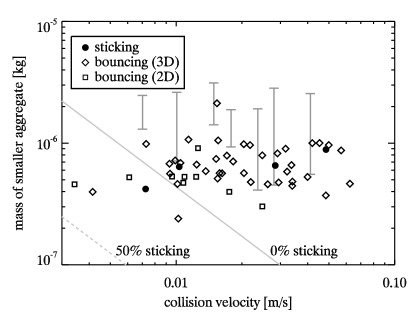
Additionally, we were able to deduce the collision velocities of 7 dust aggregates that collided with a dimer (gray bars in Figure 5 mark the mass of the monomer and the dimer, respectively). The velocities ranged from to . The orientations were random, the single dust aggregate sometimes collided with just one of the dust aggregates of the dimer and sometimes with both, in some cases along the axis of the dimer and in others perpendicular to it. Although we were able to distinguish the involved particles in both views, the collisions were calculated based on 2D information only, since analysis of the other view was not feasible in all these cases. One exemplary movie can be found in the online version of this article.
For the velocity of the dimer we tracked the center of mass of the projected area of the whole dimer, for the mass we assumed two dust aggregates of equal size making up the dimer. There were two additional collisions of this type, but in one case, the monomer was sticking to the wall and in the other case the dimer. Since these collisions were not free, we did not include them in our analysis. In all 7 cases of monomer-dimer collisions, the dimer survived the collision intact, meaning that the two dust aggregates making up the dimer clearly did not separate. On the other hand, none of the incoming monomer dust aggregates stuck to the dimer so that we did not observe any agglomeration beyond the dimer stage. Also, we could not observe how the dimers formed, as all of them emerged from dense regions where the overlap of the aggregate projections created a uniform dark area.
4 Discussion
Influence of electrical charges. Since the van der Waals forces that may lead to dust aggregates sticking to each other are small, external influence is always a concern in experiments with dust analog material. Magnetic effects are ruled out by using non-magnetic as the material of choice. However, electric charges and the corresponding Coulomb forces they exert are a concern, since the dust aggregates are insulators and charges could accumulate on their surface.
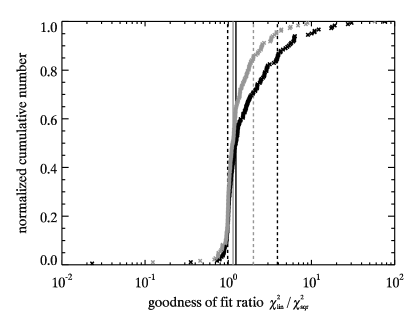
Long-range influence. Electrically charged dust aggregates do not move on temporally and spatially linear trajectories, but are accelerated in the vicinity of other charges. To test the hypothesis of charged dust aggregates in our experiment, we fitted a quadratic function to the trajectories and compared the results to the linear fits. For data following a linear trend, the reduced of a linear, , and a square fit, , are nearly identical, with the square one being slightly smaller. In Figure 6 we show the goodness of fit ratio for the tracks of all particles that were involved in collisions (gray for -coordinates, black for -coordinates), where the track consisted of at least 10 data points. This restriction was made since for very few data points, the trajectories may appear curved, due to binarization effects and rotation of the dust aggregates, while in reality they are not. The values within one standard deviation (dashed lines in Figure 6, note that the lower boundary is nearly identical in both coordinates) show that is within a factor of 3 of , meaning that the difference between the two kinds of fits is rather small. Therefore, we consider them to be of equal quality and the linear fit to be sufficient to describe the particles’ trajectories so that the acceleration term is negligible. In those cases with a larger difference between the goodness of fit parameters, the trajectories may indeed be slightly curved, but these are only a few exceptions.
Short-range influence. If we assume the dust aggregates to be charged and no charge to be transferred between the two particles in a collision, then the direction of the acceleration with respect to the direction of motion would change sign after the collision. While two aggregates with charges of opposite sign would be accelerated in the direction of motion before the collision, this would change after the collision when the particles separate again. If both aggregates have charges of equal sign the situation is reversed. Here, the acceleration points in opposite direction of the direction of motion before the collision and in the same direction afterwards.
However, an analysis of the formal accelerations (see above) showed that this reversal happens only in 5 out of 156 cases, if we take into account an angle of 30∘ of the direction of acceleration with respect to the direction of motion. On the other hand, for 12 dust aggregates the direction of the acceleration changed in the same way as the direction of motion. For the vast majority of the particles, the direction of motion and acceleration were not aligned before or after the collision. This is strong evidence that electric charges do not influence the dust-aggregate collisions in the experiment.
We also fitted a quadratic function to an increasing number of data points directly before a collision. If the particles are charged, Coulomb’s law states that the force they exert on each other should increase with decreasing distance. However, there was no evidence for an increase in the acceleration in the fits with fewer data points or for sectors of the trajectory that were closer to the contact.
Charge estimate. If we assume that the amount of acceleration that we did formally measure in the fit directly before a collision is solely generated by an electric field caused by charges on the dust aggregates, we can calculate the number of elementary charges on the dust aggregates. We will assume the particles to all have a mass of kg and to be equally charged. We will also assume that the dust aggregates consist of spherical monomers with a diameter of 1 m, which is between the median values for the mass and number weighted size distributions of the used dust (c.f. Kothe et al., (2013), their Figure 3).
For the acceleration, we used 0.02 , a typical value for the fit to the last 10 data points (20 milliseconds) before the collision. For the typical collision velocities of the dust aggregates (see Figure 1 (left)), this means that they were separated at most one diameter from the collision partner. To achieve this acceleration at this distance, elementary charges on both dust aggregates would be necessary. This corresponds to about elementary charges per monomer within the dust aggregate or 3 elementary charges on each monomer on its surface. Even in this latter case, the additional attraction/repulsion due to the Coulomb force is many orders of magnitude smaller than the van der Waals attraction between two monomer grains in contact.
Rotational energy. For 26 dust aggregates, we were able to determine the rotation frequency for parts of their trajectory. These dust aggregates are arbitrary tracked particles from both projections and random times of the experiment and were not involved in a collision during the time that was used to analyze their rotation. Due to the more ellipsoidal form of these dust aggregates, a rotation leads to a clear oscillation of the projected area of the dust aggregate. Fitting a sine function to the time series of the projected area yielded the rotation frequency which was found to be between 1.6 and 15.9 revolutions per second, independent of their velocity. However, if we compare the translational with the rotational energy, we find that for dust aggregates faster than a few centimeters per second, the translational kinetic energy on average is of the same order or even larger than the rotational energy (see Figure 7, dashed line). The rotational energy, which was calculated assuming a spherical shape of the dust aggregates (ignoring the fact that in this case we would not have observed any oscillation of the projected area) dominates the particles’ energy at low velocities. Calculations on the energy balance of these collisions, like the determination of the coefficient of restitution, ideally should take rotation into account. However, it is not always possible to determine the degree of rotation for a given dust aggregate in this kind of experiment, due to backlight illumination and the high optical depth.
While the colliding particles were rotating to a certain degree, we were not able to quantify the influence of the effect of rotation on the collision outcome. However, a comparison of the data in Figure 7 with those in Figure 2 clearly shows that the spread in the values of the coefficient of restitution for a given velocity is visually much higher for impact velocities than for higher velocities. These two velocity regions are exactly matching those for which rotation and translation dominate the total kinetic energy.

Dust-aggregate structure. The internal structure of a dust aggregate can have a significant influence on the outcome of a collision. Kothe et al., (2013) showed that clusters consisting of homogeneous sub-aggregates of about 150 m in diameter, stick at much higher velocities than homogeneous dust aggregates with the same mass. These dust aggregates consisted of monodisperse, spherical, micrometer-sized particles. Brisset et al. (subm.) observed the same effect for similar dust aggregates as well as for aggregates of identical size consisting of the same irregular, polydisperse, micrometer-sized grains we used for our dust aggregates.
Thus, the exact properties of the monomer constituents do not seem to play a large role in these collisions, but the internal structure of a dust aggregate of a given mass does. Although we also observed dust aggregates of about kg to stick at velocities higher than predicted by the model, the data by Kothe et al., and Brisset et al. (subm.) suggest that the sticking probability for clusters of the same mass is even higher. This is likely due to the fact that their structure can be compacted much more easily, leading to a higher dissipation of energy in a collision.
Future revisions of the growth model will have to take the complete collision history of an aggregate into account in order to estimate the structure and, therefore, use the appropriate collision properties. If the growth of the dust aggregates in a PPD follows a very narrow size distribution, particles may very well be made up of smaller dust aggregates, which in turn might allow for growth beyond the maximum sizes found by Zsom et al., (2010).
Another aspect that might favor further growth can be found in the result of the monomer-dimer collisions. For three of the observed dimers we cannot be certain how they were formed, since they became visible when the large cloud of particles at the beginning of the experiment became optically thin, so they might already have formed during preparation. The other four dimers, however, clearly formed during the remainder of the experiment duration. Thus, they formed at a collision velocity comparable to the subsequent collisions with the monomers. Therefore, although the chances of two dust aggregates to stick together at the velocities in the PPD are small, the resulting dimer survives subsequent collisions at similar velocities. A few lucky winners might grow big enough in subsequent collisions to induce further growth by mass transfer as suggested by Windmark et al., 2012a .
5 Conclusions
As we have shown in Section 3, for most of the collisions in our MEDEA-type experiments, the two-dimensional analysis of the velocity is reasonably accurate. The velocities obtained from one projected image may yield values that are on average about ten percent below the real value, but the overall picture is not affected by this. Since the velocity is the only parameter of a collision that is currently used for the collision model except for the mass, we can conclude that previous works yielded valid input. However, our data also show that the collision model has to be scrutinized, especially where transitions between regimes have not yet been backed by experimental data. The collisions analyzed in this paper reveal that the transition zone from perfect sticking to perfect bouncing is even broader than assumed previously.
The velocity regime of the MEDEA-type experiments with typical collision velocities of a few millimeters to a few centimeters per second is very relevant to the conditions in the solar nebula. However, it strongly depends on the particular nebula model and the amount of turbulence in which part of the disk these velocities occur for millimeter-sized particles. With an -parameter, which denotes the strength of turbulence, of , the collision velocities for a dust-aggregate mass of kg at a stellar distance of 1 AU vary widely. For a high-density nebula (Desch,, 2007), the velocities are very low, only . For a minimum mass solar nebula (MMSN) model (Hayashi et al.,, 1985; Weidenschilling,, 1977), the velocities at 1 AU are 0.2 , close to those in our experiment. The highest velocities of 1.9 are predicted for a low-density nebula (Brauer et al.,, 2008; Andrews and Williams,, 2007). Johansen et al., (2014) find velocities of 0.1 for those collisions in the dead zone and 2 with turbulence for a MMSN model. Therefore, for local simulations around 1 AU, our experiments are relevant for MMSN models. However, in global simulations, the conditions will always be met at some location in the disk. Also, the collisions will likely occur with a velocity distribution of some kind (Windmark et al., 2012b, ; Garaud et al.,, 2013), which broadens the regions where velocities of a few millimeters per second to centimeters per second are relevant.
A three-dimensional analysis, like the one conducted here, is required to investigate the parameters describing the micro-physics of a collision. For the normalized impact parameter the real (3D) value may take any value between the number calculated for the two-dimensional projection and unity (see Figure 1 (right)). A two-dimensional analysis yields only a lower boundary to the real value, but the distribution of the 2D values should not be seen as representative of the real values.
The statistical distribution of the three-dimensional coefficients of restitution in this experiment is well represented by the two-dimensional values (see Figure 1 (middle)), but any single value may differ significantly. Therefore, any analysis of the coefficient of restitution should be based on a three-dimensional analysis to ensure that each value is correct. Since the collisions are random, looking at them from a fixed perspective also yields a random underestimation of the velocities before and after the collision. Therefore, a sufficient number of collisions may yield an estimate of the distribution of coefficients of restitution, but should not be treated as showing the whole picture.
The existence of ”lucky winners” that may be necessary for growth beyond centimeter sizes (Windmark et al., 2012a, ; Dra̧żkowska et al.,, 2013) is plausible from our experiments. However, statistics are limited in our experiment. Kelling et al., (2014) analyzed tens of thousands of collisions and found all dimers to be destroyed again. The collisions in our experiment were completely free, whereas aggregates in the setup of Kelling et al., were subject to external forces. ”Lucky winners” would need to have a smaller velocity than in our experiment or be among the few percent for which sticking occurs, despite having rather high velocities, but if they do form dimers, these are stable enough to survive subsequent collisions. Therefore, compound aggregates might grow further in future collisions until they are large enough to start growing by mass transfer instead of direct sticking. Only very few particles will reach these sizes, but the simulations showed that even a tiny fraction of larger particles is sufficient to quickly form bodies a few hundred meters in size.
Acknowledgements
We are grateful to the Deutsches Zentrum für Luft- und Raumfahrt (DLR) for funding the experiments and drop tower campaigns under grants 50WM0936 and 50WM1236. We thank Stefan Kothe for valuable discussions.
References
- Andrews and Williams, (2007) Andrews, S. M. and Williams, J. P. (2007). High-Resolution Submillimeter Constraints on Circumstellar Disk Structure. The Astrophysical Journal, 659:705–728.
- Blum, (2006) Blum, J. (2006). Dust agglomeration. Advances in Physics, 55:881–947.
- Blum et al., (2014) Blum, J., Gundlach, B., Mühle, S., and Trigo-Rodriguez, J. M. (2014). Comets formed in solar-nebula instabilities! - An experimental and modeling attempt to relate the activity of comets to their formation process. Icarus, 235:156–169.
- Blum and Münch, (1993) Blum, J. and Münch, M. (1993). Experimental investigations on aggregate-aggregate collisions in the early solar nebula. Icarus, 106:151.
- Blum et al., (2006) Blum, J., Schräpler, R., Davidsson, B. J. R., and Trigo-Rodríguez, J. M. (2006). The Physics of Protoplanetesimal Dust Agglomerates. I. Mechanical Properties and Relations to Primitive Bodies in the Solar System. The Astrophysical Journal, 652:1768–1781.
- Blum and Wurm, (2008) Blum, J. and Wurm, G. (2008). The Growth Mechanisms of Macroscopic Bodies in Protoplanetary Disks. Annual Review of Astronomy and Astrophysics, 46:21–56.
- Brauer et al., (2008) Brauer, F., Dullemond, C. P., and Henning, T. (2008). Coagulation, fragmentation and radial motion of solid particles in protoplanetary disks. Astronomy and Astrophysics, 480:859–877.
- Desch, (2007) Desch, S. J. (2007). Mass Distribution and Planet Formation in the Solar Nebula. The Astrophysical Journal, 671:878–893.
- Dra̧żkowska et al., (2013) Dra̧żkowska, J., Windmark, F., and Dullemond, C. P. (2013). Planetesimal formation via sweep-up growth at the inner edge of dead zones. Astronomy and Astrophysics, 556:A37.
- Garaud et al., (2013) Garaud, P., Meru, F., Galvagni, M., and Olczak, C. (2013). From Dust to Planetesimals: An Improved Model for Collisional Growth in Protoplanetary Disks. The Astrophysical Journal, 764:146.
- Güttler et al., (2010) Güttler, C., Blum, J., Zsom, A., Ormel, C. W., and Dullemond, C. P. (2010). The outcome of protoplanetary dust growth: pebbles, boulders, or planetesimals?. I. Mapping the zoo of laboratory collision experiments. Astronomy and Astrophysics, 513:A56.
- Hayashi et al., (1985) Hayashi, C., Nakazawa, K., and Nakagawa, Y. (1985). Formation of the solar system. In Black, D. C. and Matthews, M. S., editors, Protostars and Planets II, pages 1100–1153.
- Johansen et al., (2014) Johansen, A., Blum, J., Tanaka, H., Ormel, C., Bizzarro, M., and Rickman, H. (2014). The multifaceted planetesimal formation process. ArXiv e-prints.
- Johansen et al., (2007) Johansen, A., Oishi, J. S., Low, M.-M. M., Klahr, H., Henning, T., and Youdin, A. (2007). Rapid planetesimal formation in turbulent circumstellar disks. Nature, 448:1022–1025.
- Johansen and Youdin, (2007) Johansen, A. and Youdin, A. (2007). Protoplanetary Disk Turbulence Driven by the Streaming Instability: Nonlinear Saturation and Particle Concentration. The Astrophysical Journal, 662:627–641.
- Kelling et al., (2014) Kelling, T., Wurm, G., and Köster, M. (2014). Experimental Study on Bouncing Barriers in Protoplanetary Disks. The Astrophysical Journal, 783:111.
- Kothe et al., (2013) Kothe, S., Blum, J., Weidling, R., and Güttler, C. (2013). Free collisions in a microgravity many-particle experiment. III. The collision behavior of sub-millimeter-sized dust aggregates. Icarus, 225:75–85.
- Skorov and Blum, (2012) Skorov, Y. and Blum, J. (2012). Dust release and tensile strength of the non-volatile layer of cometary nuclei. Icarus, 221:1–11.
- Thornton and Ning, (1998) Thornton, C. and Ning, Z. (1998). A theoretical model for the stick/bounce behaviour of adhesive, elastic-plastic spheres. Powder Technology, 99(2):154–162.
- Wahlberg Jansson and Johansen, (2014) Wahlberg Jansson, K. and Johansen, A. (2014). Formation of pebble-pile planetesimals. ArXiv e-prints.
- Weidenschilling, (1977) Weidenschilling, S. J. (1977). Aerodynamics of solid bodies in the solar nebula. The Monthly Notices of the Royal Astronomical Society, 180:57–70.
- Weidling et al., (2012) Weidling, R., Güttler, C., and Blum, J. (2012). Free collisions in a microgravity many-particle experiment. I. Dust aggregate sticking at low velocities. Icarus, 218:688–700.
- Weidling et al., (2009) Weidling, R., Güttler, C., Blum, J., and Brauer, F. (2009). The Physics of Protoplanetesimal Dust Agglomerates. III. Compaction in Multiple Collisions. The Astrophysical Journal, 696:2036–2043.
- (24) Windmark, F., Birnstiel, T., Güttler, C., Blum, J., Dullemond, C. P., and Henning, T. (2012a). Planetesimal formation by sweep-up: how the bouncing barrier can be beneficial to growth. Astronomy and Astrophysics, 540:A73.
- (25) Windmark, F., Birnstiel, T., Ormel, C. W., and Dullemond, C. P. (2012b). Breaking through: The effects of a velocity distribution on barriers to dust growth. Astronomy and Astrophysics, 544:L16.
- Zsom et al., (2011) Zsom, A., Ormel, C. W., Dullemond, C. P., and Henning, T. (2011). The outcome of protoplanetary dust growth: pebbles, boulders, or planetesimals?. III. Sedimentation driven coagulation inside the snowline. Astronomy and Astrophysics, 534:A73.
- Zsom et al., (2010) Zsom, A., Ormel, C. W., Güttler, C., Blum, J., and Dullemond, C. P. (2010). The outcome of protoplanetary dust growth: pebbles, boulders, or planetesimals? II. Introducing the bouncing barrier. Astronomy and Astrophysics, 513:A57.