The classification of frequencies in the Doradus / Scuti hybrid star HD 49434 ††thanks: This paper includes data taken at the Mount John University Observatory of the University of Canterbury New Zealand, the McDonald Observatory of the University of Texas USA, and the European Southern Observatory at La Silla Chile.
Abstract
Hybrid stars of the Doradus and Scuti pulsation types have great potential for asteroseismic analysis to explore their interior structure. To achieve this, mode identifications of pulsational frequencies observed in the stars must be made, a task which is far from simple. In this work we begin the analysis by scrutinizing the frequencies found in the CoRoT photometric satellite measurements and ground-based high-resolution spectroscopy of the hybrid star HD 49434. The results show almost no consistency between the frequencies found using the two techniques and no characteristic period spacings or couplings were identified in either dataset. The spectroscopic data additionally show no evidence for any long term (5 year) variation in the dominant frequency. The spectroscopic frequencies identified have standard deviation profiles suggesting multiple modes sharing () in the Scuti frequency region and several skewed modes sharing the same () in the Doradus frequency region. In addition, there is a clear frequency in the Doradus frequency region that appears to be unrelated to the others. We conclude HD 49434 remains a Scuti/ Doradus candidate hybrid star but more sophisticated models dealing with rotation are sought to obtain a clear picture of the pulsational behaviour of this star.
keywords:
line: profiles, techniques: spectroscopic, HD49434, stars: variables: general, stars: oscillations1 Introduction
The discovery of numerous candidate hybrid Doradus/ Scuti stars by space telescopes, is proving to be a real problem for asteroseismology. Several Doradus/ Scuti hybrid stars have now been detected and studied from ground-based observations and further candidates are still being discovered with data from the MOST, CoRoT and Kepler space telescopes. These stars all show frequencies, attributed to pulsation, in both the Scuti and Doradus frequency ranges. Despite the impressive quality of the data, no mode identification has yet been published of such a hybrid star to confirm their nature. The detailed spectroscopic study of the candidate hybrid star HD 49434 presents an opportunity to confirm the existence of hybrid stars and draw conclusions on their nature.
Early Kepler results show that Doradus/ Scuti hybrid stars may challenge current understanding of the classical instability strip and the definitions of Scuti and Doradus stars (Grigahcène et al. 2010a, Grigahcène et al. 2010b, Uytterhoeven et al. 2011). Whilst many of the first hybrid stars studied from space show hundreds of excited modes, other detailed investigations of the frequencies show many of these hundreds are aliases, combinations or couplings of one another (Breger et al., 2011; Chapellier et al., 2011; Chapellier et al., 2012; Breger et al., 2012). Other studies have shown that granulation could be responsible for many of these frequencies, especially those previously attributed to high degree modes which suffer cancellation effects in photometry, even for high-precision space telescopes (Kallinger & Matthews, 2010).
Examination of the statistics of the class identifications is also proving to be problematic. The large numbers of hybrid stars found all over the Scuti and Doradus regions of the Hertzsprung-Russell diagram are as yet unexplained (Grigahcène et al., 2010; Uytterhoeven et al., 2011; Balona, 2011) and are particularly difficult to explain in the hotter spectral-type A stars. These stars are beyond the theoretical limit for driving of Doradus-type pulsation and, indeed, any type of low-frequency pulsation. The alternate explanation, starspots, is also problematic as the lack of a sizeable convective shell for these hot stars inhibits starspot formation (Balona, 2011). To shed light on all these questions arising from space photometry, more ground-based observations of stars, such as HD 49434, are required to characterise the frequency spectra of hybrid stars.
Historically, HD 49434 (HR 2514, HIP 32617) was a remarkably understudied star given it has a visual magnitude of 5.74 (Bruntt et al., 2004). Since its identification as a Doradus star by Bruntt et al. (2002) however, much more effort has been put into several photometric and spectroscopic studies. The significant recent studies of Uytterhoeven et al. (2008) and Chapellier et al. (2011) have demonstrated that this star has frequencies in the Doradus region ( d-1) and in the Scuti region ( d-1) and this star thus offers the first detailed view of a hybrid Doradus/ Scuti star.
HD 49434 has a spectral type of F1V and effective temperature of K (Gillon & Magain, 2006). This places the star squarely in the expected overlap region of the p-mode Scuti pulsations and the g-mode Doradus pulsations. Rotational velocity measurements show this star is a rapid rotator; the most precise value is from Gillon & Magain (2006) giving . The same paper also contains a detailed abundance analysis, generally finding metallicities slightly higher than solar values. The abundances, in general, agree with previous spectroscopic work by Bruntt et al. (2002). The spectroscopic parameters from these works and those from two further photometric studies by Lastennet et al. (2001) and Poretti et al. (2005) are given in Table 1. The radius of the star is estimated from 2mass infra-red photometry to be (Masana et al., 2006) and an estimate of the stellar mass of is given in Bruntt et al. (2002).
Analysis of pulsations in HD 49434 began using ground-based spectroscopy in 1998 (Bruntt et al., 2002) when low-amplitude variations were observed in the spectral-line profiles. Strömgren photometry, taken in 2001, confirmed the variability with excess power in the d-1 to d-1 region, but yielded no identifiable frequencies (Bruntt et al., 2002). Further spectroscopy by Mathias et al. (2004) showed, again, low-amplitude variations in the blue wing of the line profile.
This star has been observed at Mt John University Observatory (mjuo) since February 2007 when a two-week observing run as part of a multi-site campaign was undertaken. The purpose of the campaign was to gather spectroscopic data simultaneous with observations from the CoRoT photometric satellite. The results were published in Uytterhoeven et al. (2008). From the spectroscopic data, three Doradus and five Scuti frequencies were identified, leading to the classification of HD 49434 as a hybrid pulsator. Only one of the Doradus and none of the Scuti frequencies were detected in the accompanying ground-based photometry from Sierra Nevada Observatory, Spain and San Pedro Mártir Observatory, Mexico. The frequencies from the CoRoT data analysis are presented in Chapellier et al. (2011). The high-precision photometry revealed a staggering significant frequencies in the five-month observing run with of these identified as pulsation frequencies. The vast number of frequencies found have led to further questions regarding the origins and stability of the stellar pulsations.
| Paper | log | [Fe/H] | ||
|---|---|---|---|---|
| (K) | () | |||
| G&M11footnotemark: 1 | 7632 (126) | 4.43 (0.20) | 0.09 (0.07) | 85.4 (6.6) |
| B&al22footnotemark: 2 | 7300 (200) | 4.14 (0.20) | -0.13 (0.14) | 84 (4) |
| P&al33footnotemark: 3 | 7250 (200) | 4.1 (0.2) | -0.1 (0.2) | |
| L&al44footnotemark: 4 | 7240 (100) | 4.0 (0.4) | -0.1 (0.2) |
This work expands on the analysis of the spectra in Uytterhoeven et al. (2008) with the analysis of a further multi-site spectra making a total of observations.
2 Observations and Data Treatment
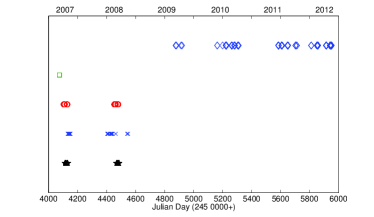
Observations of HD 49434 have continued at mjuo from the initial run in 2007 until January 2012, contributing to a large, long-term dataset to confirm and refine these frequencies. These data were combined with line profiles computed in Uytterhoeven et al. (2008) with additional spectra from feros and sophie taken in 2008. A summary of the times and dates of observations of the individual sites is presented in Table 2. These observations are plotted in Figure 1 to show the temporal distribution of the data.
Spectra from mjuo in New Zealand were collected using the m McLellan telescope with the fibre-fed High Efficiency and Resolution Canterbury University Large Échelle Spectrograph (hercules) with a resolving power of R operating over a range of Å to Å (Hearnshaw et al., 2002). The data collected from mjuo was divided into two time periods. The oldest dataset, which contained observations taken in 2007 and 2008, was analysed as part of the multi-site analysis of Uytterhoeven et al. (2008). Since then, observations have been taken from 2009 to 2012 which were analysed as a single-site dataset. This dataset had a total of observations. Spectra were reduced using a matlab pipeline written by Dr. Duncan Wright. This pipeline performs the basic steps of flat fielding from white-lamp observations, calculating a dispersion solution from thorium-lamp observations and outputting the data into a two dimensional format.
feros is now installed on the Max-Planck-Gesellschaft / eso m telescope and has a resolving power of R (Kaufer et al., 1999). The spectral range covered is Å to Å. Reductions were done using a pipeline written for feros in midas (Rainer, 2003).
The m telescope at the Observatoire de Haute Provence, France, can observe with sophie (Spectrographe pour l’Observation des Phénomènes des Intérieurs stellaires et des Exoplanètes) (Perruchot et al., 2008). The wavelength range is Å to Å with a resolving power of R (high-resolution mode). A software package adapted from the High Accuracy Radial velocity Planet Searcher (harps) spectrograph was used to reduce the spectra.
| Spectrograph | Observatory | Tel. | Observation range | T (d) | Obs. |
|---|---|---|---|---|---|
| foces | Calar Alter | 2.2 m | Dec 2006 | 1 | 47 |
| feros | La Silla | 2.2 m | Jan 2007-Jan 2008 | 376 | 404 |
| sophie | Haute Provence | 1.93 m | Jan 2007-Jan 2008 | 374 | 629 |
| hercules (old) | mjuo | 1.0 m | Feb 2007-Mar 2008 | 416 | 286 |
| hercules (new) | mjuo | 1.0 m | Feb 2009-Jan 2012 | 1076 | 381 |
Each spectrum was cross-correlated using the delta-function method (Wright, 2008, building on Wright et al., 2007) to create a single representative line-profile from approximately lines in the full spectrum. To check the consistency of methods between this paper and that of Uytterhoeven et al. (2008), a selection of the data taken as part of the 2007 multi-site spectroscopic campaign was analysed in famias. These data were provided as line profiles (as discussed in Uytterhoeven et al., 2008) which were computed using a Least-Squares Deconvolution (lsd) method (Donati et al., 1997, 1999). This method differs slightly to the -function cross-correlation method used for the more recent hercules data, but produces very similar line profiles.
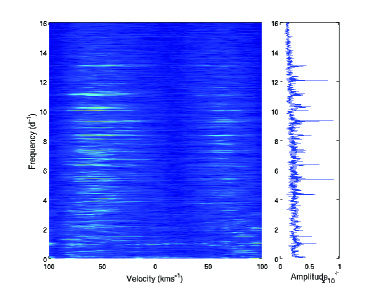
Time-series analysis was performed using famias (Zima, 2008), applied as in Zima et al. (2006). This entailed an analysis of the variations in the representative line profiles which identified the frequencies present. For examples of Doradus stars analysed using these techniques see Brunsden et al. (2012)a, Brunsden et al. (2012)b or Davie et al. (2014). A periodogram of the amplitude of the variation at each pixel in the line profile (in velocity measurements) for each frequency is shown in Figure 2 as an example of the pixel-by-pixel (pbp) technique. Frequency analysis of the moments (radial velocity, width and skewness) relies on the average symmetry of the line profile over a pulsation period. This is not the case for HD 49434 and the strong asymmetry of the variation of the line profile (see Figure 5 and Figure 6) results in non-sinusoidal behaviour of these measurements, limiting the detection of the frequencies. Further comments on the origins and repercussions of the skew line profile is included in the discussion (Section 5.1).
A comparison between the results of the two data sets showed the pixel-by-pixel analysis to be nearly identical to the results of the line profile variations in Uytterhoeven et al. (2008). These results show excellent consistency between the Discrete Fourier Transform method employed in famias compared with the Intensity Period Search (Telting & Schrijvers, 1997) method used in Uytterhoeven et al. (2008). The consistency between the results means we can merge the line profiles into a single extensive observational dataset and indicates no significant change to the results from the calculation of the line profile using the -function cross-correlation or an lsd technique.
For Doradus and Scuti stars, the standard deviation and phase profiles show the motion of the pulsation though the spectral line. These profiles vary depending on the mode, frequency and stellar parameters which can be determined using the mode identification tools in famias. In general, different modes have distinctive shapes in the line profiles and smooth phase profiles across the line with jumps linked to stationary points of the line profile. Examples of typical Doradus and Scuti line, standard deviation and phase profiles can be seen in Brunsden et al. (2012) and Schmid et al. (2014), respectively.
Spectroscopic mode identification relies on the rotational broadening of the line profile to return a use number of pixels in the line profile. To date stars from (Aerts & Kaye, 2001) to (Davie, 2013) have been analysed successfully although it is noted that famias does have a mode-dependent rotation limit as deviations of the star from spherical symmetry due to rotation are ignored.
3 Frequency Analysis
| ID | Freq. (d-1) | Amplitude | Rel Amp. | Class. |
|---|---|---|---|---|
| 9.3071 | 0.29 | 1.00 | DSL | |
| 5.3298 | 0.28 | 0.97 | DSL | |
| 12.0330 | 0.21 | 0.72 | DSL | |
| 0.0003 | 0.14 | 0.48 | IRR | |
| 3.1779 | 0.15 | 0.52 | DSL | |
| 4.8073 | 0.18 | 0.62 | DSL | |
| 1.4855 | 0.14 | 0.48 | GDL | |
| 6.6781 | 0.1 | 0.34 | DSL | |
| 4.7432 | 0.13 | 0.45 | DSL | |
| 9.1385 | 0.11 | 0.38 | DSL | |
| 5.5843 * | 0.11 | 0.38 | DSL | |
| 5.7879 | 0.11 | 0.38 | DSL | |
| 0.9993 | 0.12 | 0.41 | IRR | |
| 1.8744 | 0.11 | 0.38 | GDL | |
| 7.7628 | 0.09 | 0.31 | DSL | |
| 12.5488 | 0.08 | 0.28 | IRR | |
| 0.2237 | 0.07 | 0.24 | GDL | |
| 6.9081 | 0.08 | 0.28 | DSL | |
| 1.0008 | 0.09 | 0.31 | IRR | |
| 0.4077 | 0.07 | 0.24 | GDL | |
| 0.2493 | 0.07 | 0.24 | GDL | |
| 6.6292 | 0.06 | 0.21 | DSL | |
| 0.0003 | 0.14 | 0.48 | IRR | |
| 8.2185 | 0.05 | 0.17 | DSL | |
| 7.4212 | 0.07 | 0.24 | DSL | |
| 0.0556 | 0.08 | 0.28 | IRR | |
| 9.3978 | 0.06 | 0.21 | DSL | |
| 12.0326 | 0.08 | 0.28 | IRR | |
| 0.0805 | 0.06 | 0.21 | IRR | |
| 2.0513 | 0.06 | 0.21 | IRR | |
| 2.5382 | 0.07 | 0.24 | SPC |
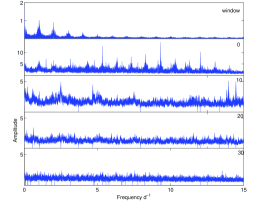
The frequencies were analysed solely using the pixel-by-pixel method due to the severe asymmetry of the line profile. In total frequencies ( to ) were identified from the peaks in the Fourier spectra that were above the detection limit as defined in famias. A full list is shown in Table 3 and the Fourier spectra at selected prewhitening stages are shown in Figure 3. Formal uncertainties on the frequencies range from d-1 for to d-1 for , but due to the low amplitude of the pulsations and the numerous observational uncertainties inherent in the data, the frequencies are reported with a conservative error of d-1.
Upon inspection, six of these frequencies (, , , , and ) were flagged as possible aliases due to their proximity to d-1 or d-1, but were kept for the subsequent analysis of the aliases standard deviation profiles. Artificially increased amplitudes in the Fourier spectrum are possible due to higher noise levels particularly in the to d-1region, which can push a noise peak higher than a real frequency peak.
3.1 Frequency Aliases and Combinations
The large number of frequencies found in the multi-site spectroscopic data warranted the computation and comparison of frequency aliases and combinations in an automated way. For aliasing this focused the search for for integer values of up to . Only the match was identified.
Combinations of frequencies were tested for d-1 for integer values of and up to including . Several identifications were discovered but on closer examination these had high values of two or more of and (e.g. ) and are unlikely to arise without the additional presence of simpler combinations. As such they are regarded as purely coincidental. It is also unlikely that combinations not involving the highest amplitude frequencies would arise without seeing higher amplitude combinations from to .
3.2 Comparison with CoRoT Results
The results of the dedicated CoRoT study of more than single-passband photometric observations, taken over nearly days from October 2007 to March 2008, are presented in Chapellier et al. (2011). They find a staggering significant frequency peaks and propose frequencies intrinsic to HD 49434. The frequencies and their properties are available in electronic format as supplementary information to the paper. The uninterrupted high quality of the dataset allows for high precision of the detected frequencies and these can be compared with the spectroscopic results to understand the variability of this star. In the following analyses, the full frequencies are considered.
The ten frequencies with the highest amplitude from the CoRoT analysis were first compared with the spectroscopic results to see if any frequencies matched. The frequencies are given in Table 4. Only the frequencies , , and were found in the spectroscopic analysis. The frequencies to were then imposed on the spectroscopic data to observe any potential signal and characterise the standard deviation and phase profiles. None of the ten frequencies have clear line profile and phase variations easily attributable to pulsations.
| ID | Frequency | Amp. | Amp. | Signif. |
|---|---|---|---|---|
| (d-1) | (mmag) | (rel to 1) | ||
| 1.73463954 (092) | 2.4599 | 1.00 | 15558.3 | |
| 2.53808114 (142) | 1.5891 | 0.65 | 8284.4 | |
| 0.22356263 (145) | 1.5534 | 0.63 | 8962.6 | |
| 2.25335725 (145) | 1.5526 | 0.63 | 10201.6 | |
| 0.40754452 (173) | 1.3045 | 0.53 | 8416.4 | |
| 0.24907883 (215) | 1.0522 | 0.43 | 6203 | |
| 0.05537893 (221) | 1.0213 | 0.42 | 6276.8 | |
| 1.54418626 (236) | 0.9578 | 0.39 | 6148.1 | |
| 2.37947392 (243) | 0.9298 | 0.38 | 6339 | |
| 3.97738341 (251) | 0.8991 | 0.37 | 6493.2 |
When the first frequencies of the CoRoT findings were compared to the pbp frequencies, of the pbp frequencies were found to match to within d-1. These matches are listed in Table 5. It is surprising how poorly the frequencies detected in each method align, especially the high-amplitude frequencies.
| CoRoT | pbp | ||||
|---|---|---|---|---|---|
| Freq. | ID | Rel. | Freq | ID | Rel. |
| (d-1) | Amp. | (d-1) | Amp. | ||
| 0.055 | 7 | 0.40 | 0.056 | 0.3 | |
| 0.224 | 4 | 0.58 | 0.224 | 0.3 | |
| 0.249 | 14 | 0.40 | 0.249 | 0.3 | |
| 0.408 | 5 | 0.54 | 0.408 | 0.3 | |
| 1.485 | 30 | 0.09 | 1.485 | 0.5 | |
| 2.538 | 6 | 0.53 | 2.538 | 0.2 | |
| 2.871 | 33 | 0.08 | 1.874 | 0.3 | |
| 3.180 | 72 | 0.04 | 3.178 | 0.6 | |
| 4.585 | 32 | 0.08 | 5.584 | 0.4 | |
| 5.192 | 36 | 0.08 | 5.193 | 0.2 | |
| 6.678 | 52 | 0.05 | 6.678 | 0.3 | |
| 9.307 | 68 | 0.04 | 9.307 | 1 | |
3.3 Classification of Frequencies
A least-squares fit was performed on the representative line profiles of the observations using the profiles of the frequencies identified. The standard deviation profiles of each frequency fit were compared. Upon inspection, the profiles could be seen to fit into one of four classes. The mean profiles of the first two classes are plotted together in Figure 4 for direct comparison.
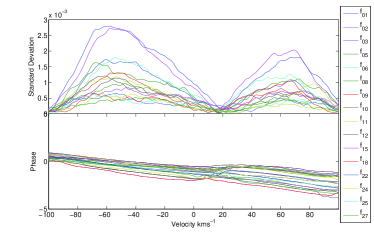
The first group, with the majority of the frequencies, has a two-bump structure with peaks terminating at the edges of the profile. The centres of the standard deviation and phase profiles are shifted to the right and are centred near , an effect not seen in other -Doradus and -Scuti stars. Nineteen of the frequencies fitted this description and they are plotted in Figure 5. Noting the frequencies were all in the Scuti range, this group was named “-Scuti like” (dsl).
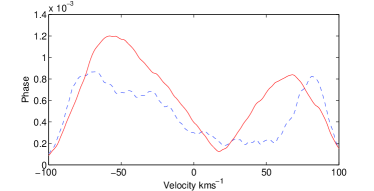
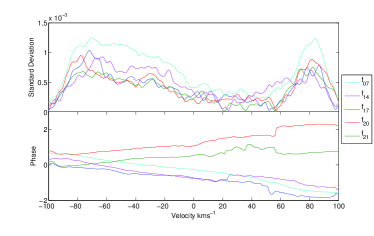
The second-identified group contained five of the frequencies and since these were found to be exclusively in the Doradus range this set was labelled “-Doradus like” (gdl). The standard deviations and phases are plotted in Figure 6. Note the normalised phases of two of the frequencies can be inverted to match those of the other three frequencies.
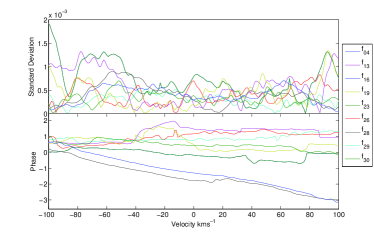
The third group of misshapen standard deviation profiles was named “ Irregular ” (irr) and individual profiles are plotted in Figure 7 with nine frequencies of this type found. Most show only small changes in phase. Many of these profiles have frequencies at zero or one cycle-per-day as described above and most are likely to be artefacts of the data sampling. The two exceptions are and . The latter is almost certainly a residual from the removal of the strong frequency and the former could be an alias or combination frequency, or a real frequency undistinguished from the noise. This may also be the case for some others in this group.
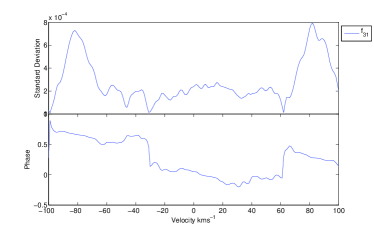
The final group contained just one interesting frequency. The profile of had a shape similar to other identified profiles in fast-rotating Doradus stars with narrow variation peaks in the wings and no variation in the line centre. This variation is matched by the changes in the phase profile. This frequency is plotted in Figure 8 and is labelled as a “special case” (spc).
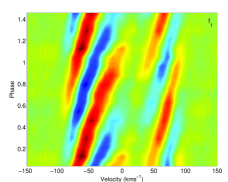
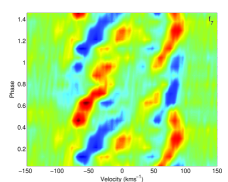
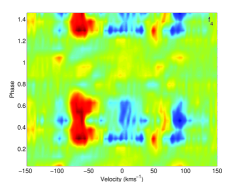
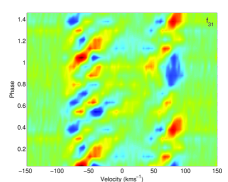
To further investigate these groups, the residuals from the subtraction of the mean line profiles were phased over each of the identified frequencies in Table 3. The results of the four groups are represented by the plots in Figure 9. These plots provide information on the stability of the frequency. Stellar frequencies are expected to show a smooth ‘braided rope’ structure as the pulsation moves through the line profile. Different modes will also show different inclinations and structure through the pulsation phase. As with the standard deviation profiles, the plots fall into one of three categories. The first group includes those plots with a clear structure with narrow ‘braids’, mostly in two regions of the line profile. These plots generally correspond to the -Scuti like (dsl) frequencies. Most of the -Doradus like (gdl) frequencies show a similar ‘braided rope’ shape with fewer braids with a more gentle phase slope. Frequencies with no clear pulsation spreading across the entire phase were classed as irregular (irr) and one frequency does not fit the above classifications, the special case (spc).
Based on the standard deviation profiles, phased residual profiles and the proximity of many to integer values, the frequencies in the irr group were classified as non-stellar frequencies, likely arising from data sampling aliases. The frequency was also put in this group as it is the same as within the detection limit. The remaining frequencies are regarded as candidate stellar frequencies which, together with the non-stellar frequencies, are further scrutinised in the following section.
The shape of the standard deviation profiles of the dsl group could be fitted by a mode identification, but the central shift and uneven amplitude of the standard deviation profiles are not easily accounted for. The homogeneity of the shapes of all the frequencies suggests that they are all representations of the same excited mode (couplings or splittings), or that there are many excitations of modes with the same () and different () . The shape of the gdl standard deviation profiles is not typical of a pulsation and suggests that they may be artefact frequencies, possibly of some rotational effect. This topic is discussed further in Section 4. The special case frequency, , on the other hand appears to be a real mode typical of a Doradus pulsation. It is not clear why this mode shows such clean variation with low amplitude. The shape of the standard deviation and phase profiles are recognisable in an individual least-squares fit, with only mild distortions, which rules out the frequency being a random residual from the interaction of other frequencies.
3.4 Frequency Results
The above analyses of all the frequencies detected in Table 3 led to frequencies being discarded and retained as probable stellar frequencies. Discarded frequencies are identified in Table 3 by a .
The detection of very different frequencies in photometry and spectroscopy of Doradus stars has been previously documented (e.g. HD 40745 in Maisonneuve et al., 2011) but this was attributed to high noise levels in the spectroscopic data. This hypothesis has not been able to be excluded until the present work. The physical reason for the discrepancy is normally thought to be the low sensitivity of photometric techniques to high degree modes due to cancellation effects. This reasoning fails with the explanation of and because, as discussed in Section 3, the frequencies appear to have the same standard deviation and phase profiles and therefore are likely to originate from modes with the same (,), or be otherwise linked. A full mode identification of the frequencies found is required to confirm this, the results of which will follow in a later publication.
4 Probing the Hybrid Nature
The presence of both Doradus and Scuti range frequencies suggests that HD 49434 may be a hybrid. This classification was made by Uytterhoeven et al. (2008) based on the frequencies found and the proximity of the star to the intersection of the pulsation groups in the Hertzsprung-Russell (hr) diagram (see Figure 4 from Bruntt et al., 2002). The shapes of the line profiles of the individual frequencies in Section 3 suggests physical differences between the two groups of frequencies. Additionally, two recent papers (Chapellier et al., 2012; Breger et al., 2012) have found links between the low-frequency and high-frequency modes of hybrid stars in space photometry. In this section the links between the two frequency groups are tested and the hybrid nature of this star is examined.
4.1 The Doradus/ Scuti Frequency Domains
Models of Doradus/ Scuti hybrid stars predict a gap in the frequency spectrum between the two types of pulsation (Dupret et al., 2005; Grigahcène et al., 2010). Chapellier et al. (2012) found the CoRoT hybrid star 105733033 had two distinctive frequency domains for the Doradus and Scuti frequencies identified. The same effect has also been observed in the Kepler hybrid kic 8054146 (Breger et al., 2012). The domains of the frequencies identified in HD 49434 found using different methods do not show a clear separation between the two frequency regions as in Chapellier et al. (2012). This absence of domains could be due to a difference in rotation rate of the stars. Chapellier et al. (2012) suggest the domains are distinguishable due to the low rotation rate of the CoRoT star, implying the observed frequency spectrum is similar to the intrinsic spectrum of the co-rotating frequencies of the star, but no measurement of the rotational velocity of the star has yet been made. If this were the case, it would therefore be unlikely the same is true for HD 49434, as the minimum equatorial rotational velocity is around . This high rotational velocity would shift frequencies from the co-moving frame according to rotational perturbation theory, and current perturbative methods (such as those used in famias) are not directly applicable to stars with such high rotational velocities to allow for an estimation of this (Ballot et al., 2010). If this were the case, it is not clear why kic 8054146, with a very high rotation rate, does not show the same phenomenon.
4.2 Radial Modes
Further results from the Chapellier et al. (2012) study of CoRoT 105733033 showed the majority ( of ) of the Scuti frequencies were couplings of the Doradus frequencies and the dominant frequency, identified as the fundamental radial mode (). The coupling followed the pattern for with amplitudes four times smaller than the original Doradus frequencies (). This was also seen in Breger et al. (2011), and further analysed in Guzik & Breger (2011), for the Scuti star kic 9700322. Here the low frequency was identified as the difference between two dominant radial modes. The physical explanation offered by Chapellier et al. (2012) for this effect is the trapping of g-modes in the interior of the star which may induce thermodynamic perturbations in the convective envelope where the p-modes originate. Many Scuti stars follow this model of a dominant radial mode, so it could be expected for a hybrid star to display the same behaviour.
The dominant mode in the spectroscopic analysis of this star ( d-1) is a Scuti frequency which could potentially be the radial fundamental mode (usually A to F spectral-type stars have fundamental radial mode frequencies between d-1 and d-1). The standard deviation profile of the frequency is a two-bump shape typical of the radial modes (see for example Zima et al., 2006; Zima et al., 2007). The phase changes of HD 49434, however, are much smoother than the sharp “jumps” observed in the above examples. If was found to be the fundamental radial mode then the other dsl frequencies would be also interpreted as radial modes. This cannot be the case as the low-frequency modes such as could not also be radial modes. Better mode-identification of the primary frequency is required for a conclusive result. The spacings between this candidate radial mode and the other Scuti frequencies were tested for a correlation with the Doradus frequencies for d-1 for integer vales of and from one to five. No matches were found other than for as found in Section 3.1.
4.3 Characteristic Spacings
In the asymptotic regime, frequencies with the same g-mode identification are predicted to be related by characteristic period spacings between frequencies of consecutive degree (Tassoul, 1980). The study of Chapellier et al. (2012) found of the identified Doradus frequencies to have an asymptotic period spacing. Similarly, p-mode oscillations have a characteristic frequency spacing for modes with sequential . Given the possibility of both p- and g- modes being present in HD 49434, both frequency and period spacings were tested for sequencing. This search also could identify any equidistant frequencies arising from rotational splitting of the frequencies.
As with the aliases and combinations, this was tested using an automated procedure by computing all possible spacings for the frequencies and corresponding periods identified in Table 3 and binning them using a resolution of d-1. The resulting histogram is shown as Figure 10(a) for the frequency spacing and Figure 10(b) for the spectroscopic results. This was repeated for the CoRoT full frequency identification and selected frequency subset in Figure 10(c) and Figure 10(d).
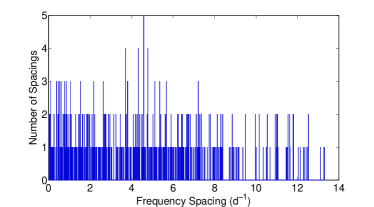
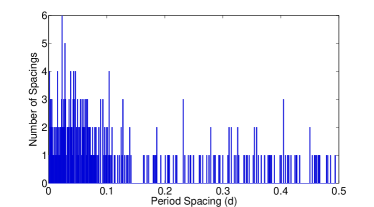
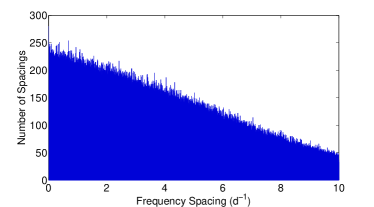
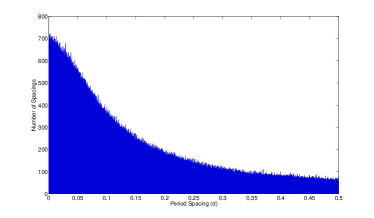
A possible repeated frequency spacing at d-1 and a possible repeated period spacing at d were observed in the spectroscopic data. The CoRoT data do not show any single frequency or period spacing that is favoured, so it is likely the spectroscopic identification is coincidental, particularly as it does not involve the strongest Scuti or Doradus frequencies. If the -Scuti range frequencies arise from one or more radial modes then it is not expected any rotational splitting will be seen, unlike CoRoT 102918586 (Maceroni et al., 2010). Additionally, the very high value of for this star may mean it is a very rapid rotator and splits may become asymmetric (splitting values vary by up to d-1in the above CoRoT star) and indistinguishable from other frequency peaks.
The above computation of the frequency spacings also allowed a comparison with the results of Chapellier et al. (2012) and Breger et al. (2012), where frequency spacings from the dominant Scuti frequencies were found to match those of the high-amplitude Doradus frequencies. A search for frequency combinations in the spectroscopic data revealed only a possible link between , and . Extended searches showed no other links between the strong frequencies. A general search for combinations in the CoRoT data reveals many candidate groups of frequencies due to the large number of inputs. A more constrained search of the first identified frequencies for spacings, including one or more frequencies above d-1 with links to one of the highest-amplitude frequencies, found frequency groups with limits of d-1. None of these combinations included any other of the highest-amplitude frequencies, so it is unlikely that the frequencies in HD 49434 are showing the same effects as the above hybrid stars.
4.4 Frequency and Amplitude Variations
Recent high-precision studies of Doradus/ Scuti hybrid stars (e.g. Chapellier et al., 2012; Breger et al., 2012) have identified variations in the photometric amplitudes of observed frequencies over time, on a scale of months to years. The same phenomenon was tested using the spectroscopy of HD 49434. The data were broken into observing year blocks, generally comprising of the southern-hemisphere summer observing season. The blocks correspond to the groups depicted in Figure 1. The years 2007 to 2012, excepting 2009, were tested as there were insufficient observations in the 2009 season for an independent analysis. The Fourier spectrum for each dataset was calculated and the highest amplitude frequency extracted. This was the equivalent of for all but the 2010 dataset. The full results are given in Table 6. It is not clear why is not recovered in the 2010 dataset, but it may be due to unfortunate data sampling or lower quality data. Despite this, the four distinct time periods are sufficient for an indication of any amplitude variability. The table shows the variation of the best fit amplitude over the five years of data to be a maximum of or 25%. The frequencies themselves show no variation within the detection limits ( d-1). The amplitudes do appear to vary by up to 25%, but it is not clear that this is not an effect of the different size and data quality encompassed in each set. All but the most extreme amplitude variation would be extremely difficult to detect in the best ground-based spectroscopic campaigns and Blazhko-like variability (non-symmetric changes in the maximum and minimum amplitudes), as seen in Breger et al. (2012), is beyond the precision of current spectroscopic methods. It is thus still possible that HD 49434 has variations in the amplitudes of its pulsations, but this cannot be confirmed in this study.
| Year | # sites | # obs. | Amp | Ampfit | |
|---|---|---|---|---|---|
| 2007 | 4 | 695 | 9.30707 | 0.00166 | 0.33286 |
| 2008 | 4 | 671 | 9.30660 | 0.00141 | 0.28360 |
| 2010 | 1 | 120 | not recovered | ||
| 2011 | 1 | 157 | 9.30825 | 0.00129 | 0.26084 |
| 2012 | 1 | 95 | 9.30785 | 0.00138 | 0.27827 |
5 Discussion
The analysis of some of the best-available spectroscopic and photometric datasets on a Doradus, or Doradus hybrid star, has clearly highlighted the complexities and gaps in current understanding of these pulsators. This discussion focuses on three areas where ground has been broken in this study, yet a full explanation is still lacking.
5.1 Standard Deviation Profile
Skewed line profiles and slight asymmetries in the standard deviation profile have been observed in several other Doradus stars, e.g. hd 40745 (Maisonneuve et al., 2011) and hd 189631 (Davie, 2013). This has usually been observed in the blue wing of the line profiles. It is not yet clear whether this effect is intrinsic to the star or if it is an artefact of the line profile creation. Currently, two further refinements to line profile generation are being developed to form part of the reduction package. These including the inclusion of a least-squares deconvolution to the cross-correlation technique and improvements to the weighting of the -function amplitudes for individual lines. These may improve the signal in the line profiles in future.
This is the first Doradus star that exhibits a severe shift in velocity space between the mean line profile and the standard deviation profile. The cause of this relative shift is not known, yet it hampers significantly the mode identification. Both rotation and non-adiabatic surface effects could be proposed as the mechanism for the shift but more examples are required for a solid analysis. It follows that future modelling routines should be capable of fitting this shift, and therefore shedding light on its physical origin.
Any rapidly-rotating star must be carefully analysed with the knowledge that there are not yet available pulsation models which include a full description of stellar rotation. It is therefore likely that the inclination and rotation could skew line profiles by confining pulsations to an equatorial wave-guide (Townsend, 2003), which is not entirely visible to the observer. With the next generation of mode identification models promising the inclusion of more of these effects, it is hoped that this will lead to an explanation of some, or all, of the observed asymmetric phenomena.
5.2 Spectroscopic and Photometric Frequencies
Previous photometric and spectroscopic studies have identified frequencies and estimated the degree, , of the corresponding modes. Analysis of the 2007 subset of the spectroscopic line profile variations in Uytterhoeven et al. (2008) found six frequencies, for which all but one was recovered in this extended analysis. No evidence for the rotational frequency of d-1 proposed by the above was found. Two photometric frequencies in the same work were recovered but did not match those of the spectroscopy. The acquisition of high-temporal-resolution photometric data from the CoRoT satellite allowed for the detection of significant photometric frequencies. The photometry and spectroscopy of this star show very self-consistent results, even over a five-year time period, yet the two methods do not show the expected consistency between the observed frequencies. High-amplitude Scuti frequencies are weak or non-existent in the photometry and conversely, high-amplitude Doradus frequencies are absent or have low-amplitudes in the spectroscopic data. The particular absence of the strongest frequency from the photometry ( d-1) in the spectroscopic results is quite surprising. Furthermore, three of the twelve frequencies that match between the photometry and spectroscopy were discarded as they had irregular phased residual profiles. Although they are unlikely to be pulsational frequencies, their true origin is unknown.
There are some physical explanations for suppression of frequencies in photometric studies. The most obvious is the decreased sensitivity of photometric methods to modes with high , as the surface integrated flux changes weaken with each additional nodal line. This is also expected to affect spectroscopic results, with smaller amplitude velocity variations across the star and increased noise in the standard deviation profiles. The low amplitude of the mode could be responsible for the lack of signal in the photometric data, but this is still a puzzling result.
Even more perplexing is the absence of the clearly dominant in the spectroscopic results. There are no particular modes expected to be suppressed in spectroscopic data but clear in photometry. There is the possibility that this frequency has another stellar origin, such as from a starspot. With an effective temperature close to K this star is close to the theoretical limit of convective blocking ( K) above which spots are not predicted to occur. The time range of the CoRoT run ( days) does not exclude the possibility of spot frequencies arising in the data, but it would be coincidental to also detect spots in the ground-based photometry from Uytterhoeven et al. (2008) spanning four years. It is not possible to exclude the possibility of being a rotational or a pulsational frequency, but, for either possibility, it is difficult to explain why it is not present in the spectroscopy.
5.3 The Unresolved Hybrid Phenomenon
The hybrid classification of HD 49434 was proposed based on the two types of frequencies observed in the star. Inspection of the standard deviation profiles and phased residual profiles of the Doradus group questions the independence of all but one of these frequencies. The remaining frequency, , is of an extremely low amplitude. Other recent studies of hybrid stars have suggested most of the Scuti frequencies to be non-intrinsic to the star, arising from interactions of the Doradus frequencies with the strong Scuti or radial fundamental modes (Chapellier et al., 2012; Breger et al., 2012). A summary of the properties of the two hybrids compared with those of HD 49434 is presented in Table 7.
| CoRoT 105733033 | HD 49434 | kic 8054146 | ||
| Spec. | Phot. | |||
| Rotation | low | moderate | high | |
| obs. freq. splitting | ( ) | ( ) high | ||
| Strongest | Dor | Sct | Dor | Dor |
| Frequencies | and radial | |||
| Phot. Amp. | 27 mmag | - | 0.134 mmag | 0.105 mmag |
| 1st freq. | ||||
| Freq. Domains11footnotemark: 1 | yes | yes | no | yes |
| Amp. Var. | not known | ? | not known | yes |
| Characteristic | frequency | no | no | no |
| spacing | and periods | |||
| Other spacing | none | none | & | |
Is there an observed definition between the Doradus and Scuti frequency regions?
The comparisons show that, although there is some suggestion that the CoRoT and Kepler stars share some similar properties, HD 49434 does not appear to be similar to either. The high rotational velocity of kic 8054146 may explain why no characteristic spacings are observed, yet the clarity of the triplet and “picket fence” patterns show other regular behaviours. A low inclination, and thus a very fast rotation of HD 49434, would explain some of the effects, such as finding no gap between the frequency domains (Handler, 2012) and could even explain some of the difference between the photometric and spectroscopic frequency spectra.
The hybrid status of HD 49434 is questioned in Bouabid et al. (2009) since low, Doradus range frequencies could be a result of rotational splitting of the numerous high-degree p-modes. However, theoretical studies have shown that hundreds of frequencies are possible from an energy viewpoint (Moya & Rodríguez-López, 2010). Attempts to explain the origins of the modes through stochastic excitation have thus far been inconclusive (Campante et al., 2010).
From the frequency analysis it appears that HD 49434 is a pulsating star with multiple modes sharing () in the traditional Scuti frequency region and several skewed but possibly related modes sharing the same () in the Doradus frequency region. In addition, there is a clear frequency in the Doradus frequency region that appears to be unrelated to the others. This means HD 49434 remains a candidate hybrid star. However this classification requires more evidence and understanding of properties of the line profile, rotational effects and hybrid nature before it can be confirmed.
5.4 Summary
Overall, the more data that are collected on HD 49434, the more questions seem to be raised. The spectroscopic frequency results are surprising and show several unexplained phenomena, yet the clear distinction in the shape of the standard deviation and phase profiles of the higher and lower frequencies that are found suggests an interesting physical origin. With the recent studies of hybrids in the Kepler field as a whole (Uytterhoeven et al., 2011; Balona et al., 2011; Grigahcène et al., 2010) and individual CoRoT and Kepler hybrid stars (Chapellier et al., 2012; Breger et al., 2012) more questions are raised about these stars. The existence of the hybrid phenomenon is already in question and the spectroscopic results for HD 49434 so far add weight to both sides of the debate. On the one hand most of the Doradus frequencies appear to be manifestations of the dominant Scuti mode. Yet the existence of just one Doradus frequency that is visually distinct prevents the classification of this star as a pure Scuti.
To determine the true nature of hybrids, it is clear that classification cannot be made based on frequencies alone until more is understood about the physical origins of all the detected frequencies. Unfortunately, the alternative, collecting large numbers of high-resolution spectra, is telescope-intensive and is limited to relatively bright stars. Observations at mjuo are limited to about seventh magnitude stars, beyond which, exposure times smear out the temporal resolution required to study Doradus-type pulsations. This renders follow-up spectroscopy on most of the hybrid stars discovered with CoRoT and Kepler impossible at this time.
More observational data are always useful in the study of pulsations, but it is not evident that more data alone will answer the numerous questions arising from HD 49434. It appears to be a lack of understanding and modelling of the rotational aspects of the star that is hindering the mode identification the most. More sophisticated models, and perhaps a new approach to the rotation problem, are required before further significant advances in the understanding of this star can be made.
6 Acknowledgements
This work was supported by the Marsden Fund administered by the Royal Society of New Zealand.
The authors acknowledge the assistance of staff at Mt John University Observatory, a research station of the University of Canterbury.
We appreciate the time allocated at other facilities for multi-site campaigns and the numerous observers who make acquisition of large datasets possible.
This research has made use of the SIMBAD astronomical database operated at the CDS in Strasbourg, France.
Mode identification results obtained with the software package FAMIAS developed in the framework of the FP6 European Coordination action HELAS (http://www.helas-eu.org/).
References
- Aerts & Kaye (2001) Aerts C., Kaye A. B., 2001, ApJ, 553, 814
- Ballot et al. (2010) Ballot J., Lignières F., Reese D. R., Rieutord M., 2010, A&A, 518, A30
- Balona (2011) Balona L. A., 2011, MNRAS, 415, 1691
- Balona et al. (2011) Balona L. A., Guzik J. A., Uytterhoeven K., Smith J. C., Tenenbaum P., Twicken J. D., 2011, MNRAS, 415, 3531
- Bouabid et al. (2009) Bouabid M., Montalbán J., Miglio A., Dupret M., Grigahcène A., Noels A., 2009, in J. A. Guzik & P. A. Bradley ed., American Institute of Physics Conference Series Vol. 1170 of American Institute of Physics Conference Series, Hybrid Doradus/ Scuti Stars: Comparison Between Observations and Theory. pp 477–479
- Breger et al. (2011) Breger M., Balona L., Lenz P., Hollek J. K., Kurtz D. W., Catanzaro G., Marconi M., et al., 2011, MNRAS, 414, 1721
- Breger et al. (2012) Breger M., Fossati L., Balona L., Kurtz D. W., Robertson P., Bohlender D., Lenz P., Müller I., Lüftinger T., Clarke B. D., Hall J. R., Ibrahim K. A., 2012, ApJ, 759, 62
- Brunsden et al. (2012) Brunsden E., Pollard K. R., Cottrell P. L., Wright D. J., De Cat P., 2012, MNRAS, 427, 2512
- Brunsden et al. (2012) Brunsden E., Pollard K. R., Cottrell P. L., Wright D. J., De Cat P., Kilmartin P. M., 2012, MNRAS, 422, 3535
- Bruntt et al. (2004) Bruntt H., Bikmaev I. F., Catala C., Solano E., Gillon M., Magain P., Van’t Veer-Menneret C., Stütz C., Weiss W. W., Ballereau D., Bouret J. C., Charpinet S., Hua T., Katz D., Lignières F., Lueftinger T., 2004, A&A, 425, 683
- Bruntt et al. (2002) Bruntt H., Catala C., Garrido R., Rodríguez E., Stütz C., Knoglinger P., Mittermayer P., Bouret J. C., Hua T., Lignières F., Charpinet S., Van’t Veer-Menneret C., Ballereau D., 2002, A&A, 389, 345
- Campante et al. (2010) Campante T. L., Grigahcène A., Suárez J. C., Monteiro M. J. P. F. G., 2010, ArXiv e-prints
- Chapellier et al. (2012) Chapellier E., Mathias P., Weiss W. W., Le Contel D., Debosscher J., 2012, A&A, 540, A117
- Chapellier et al. (2011) Chapellier E., Rodríguez E., Auvergne M., Uytterhoeven K., Mathias P., Bouabid M.-P., et al., 2011, A&A, 525, A23
- Davie (2013) Davie M. W., 2013, Master’s thesis, University of Canterbury
- Davie et al. (2014) Davie M. W., Pollard K. R., Cottrell P. L., Brunsden E., Wright D. J., De Cat P., 2014, pasa, 31, 25
- Donati et al. (1999) Donati J.-F., Catala C., Wade G. A., Gallou G., Delaigue G., Rabou P., 1999, A&AS, 134, 149
- Donati et al. (1997) Donati J.-F., Semel M., Carter B. D., Rees D. E., Collier Cameron A., 1997, MNRAS, 291, 658
- Dupret et al. (2005) Dupret M.-A., Grigahcène A., Garrido R., Gabriel M., Scuflaire R., 2005, A&A, 435, 927
- Gillon & Magain (2006) Gillon M., Magain P., 2006, A&A, 448, 341
- Grigahcène et al. (2010) Grigahcène A., Antoci V., Balona L., Catanzaro G., Daszyńska-Daszkiewicz J., Guzik J. A., Handler G., Houdek G., Kurtz D. W., Marconi M., Monteiro M. J. P. F. G., et al., 2010, ApJ, 713, L192
- Grigahcène et al. (2010) Grigahcène A., Uytterhoeven K., Antoci V., Balona L., Catanzaro G., Daszyńska-Daszkiewicz J., Guzik J. A., Handler G., Houdek G., et al., 2010, Astronomische Nachrichten, 331, 989
- Guzik & Breger (2011) Guzik J. A., Breger M., 2011, Communications in Asteroseismology, 162, 62
- Handler (2012) Handler G., 2012, in Shibahashi H., Takata M., Lynas-Gray A. E., eds, Progress in Solar/Stellar Physics with Helio- and Asteroseismology Vol. 462 of Astronomical Society of the Pacific Conference Series, Hybrid Pulsators among A/F-type Stars. p. 111
- Hearnshaw et al. (2002) Hearnshaw J. B., Barnes S. I., Kershaw G. M., Frost N., Graham G., Ritchie R., Nankivell G. R., 2002, Experimental Astronomy, 13, 59
- Kallinger & Matthews (2010) Kallinger T., Matthews J. M., 2010, ApJL, 711, L35
- Kaufer et al. (1999) Kaufer A., Stahl O., Tubbesing S., Nørregaard P., Avila G., Francois P., Pasquini L., Pizzella A., 1999, The Messenger, 95, 8
- Lastennet et al. (2001) Lastennet E., Lignières F., Buser R., Lejeune T., Lüftinger T., Cuisinier F., van’t Veer-Menneret C., 2001, A&A, 365, 535
- Maceroni et al. (2010) Maceroni C., Cardini D., Damiani C., Gandolfi D., Debosscher J., Hatzes A., Guenther E. W., Aerts C., 2010, ArXiv e-prints
- Maisonneuve et al. (2011) Maisonneuve F., Pollard K. R., Cottrell P. L., Wright D. J., De Cat P., Mantegazza L., Kilmartin P. M., Suárez J. C., Rainer M., Poretti E., 2011, MNRAS, 415, 2977
- Masana et al. (2006) Masana E., Jordi C., Ribas I., 2006, A&A, 450, 735
- Mathias et al. (2004) Mathias P., Le Contel J.-M., Chapellier E., Jankov S., Sareyan J.-P., Poretti E., Garrido R., Rodríguez E., Arellano Ferro A., Alvarez M., Parrao L., Peña J., Eyer L., Aerts C., De Cat P., Weiss W. W., Zhou A., 2004, A&A, 417, 189
- Moya & Rodríguez-López (2010) Moya A., Rodríguez-López C., 2010, ApJ, 710, L7
- Perruchot et al. (2008) Perruchot S., Kohler D., Bouchy F., Richaud Y., Richaud P., Moreaux G., et al., 2008, in Society of Photo-Optical Instrumentation Engineers (SPIE) Conference Series Vol. 7014 of Society of Photo-Optical Instrumentation Engineers (SPIE) Conference Series, The SOPHIE spectrograph: design and technical key-points for high throughput and high stability
- Poretti et al. (2005) Poretti E., Alonso R., Amado P. J., Belmonte J. A., Garrido R., Martín-Ruiz S., Uytterhoeven K., et al., 2005, AJ, 129, 2461
- Rainer (2003) Rainer M., 2003, Laurea thesis, Universitá degli Studi di Milano
- Schmid et al. (2014) Schmid V. S., Themeßl N., Breger M., Degroote P., Aerts C., Beck P. G., Tkachenko A., Van Reeth T., Bloemen S., Debosscher J., Castanheira B. G., McArthur B. E., Pápics P. I., Fritz V., Falcon R. E., 2014, A&A, 570, A33
- Tassoul (1980) Tassoul M., 1980, ApJS, 43, 469
- Telting & Schrijvers (1997) Telting J. H., Schrijvers C., 1997, A&A, 317, 723
- Townsend (2003) Townsend R. H. D., 2003, MNRAS, 343, 125
- Uytterhoeven et al. (2008) Uytterhoeven K., Mathias P., Poretti E., Rainer M., Martín-Ruiz S., Rodríguez E.and Amado P. J., Le Contel D., Jankov S., Niemczura E., Pollard K. R., Brunsden E., Paparó M., Costa V., et al., 2008, A&A, 489, 1213
- Uytterhoeven et al. (2011) Uytterhoeven K., Moya A., Grigahcène A., Guzik J. A., Gutiérrez-Soto J., Smalley B., Handler G., Balona L. A., Niemczura E., Fox Machado L., Benatti S., Chapellier Tkachenko A., et al., 2011, A&A, 534, A125
- Wright (2008) Wright D. J., 2008, PhD thesis, University of Canterbury
- Wright et al. (2007) Wright D. J., Pollard K. R., Cottrell P. L., 2007, Communications in Asteroseismology, 150, 135
- Zima (2008) Zima W., 2008, Communications in Asteroseismology, 157, 387
- Zima et al. (2007) Zima W., Lehmann H., Stütz C., Ilyin I. V., Breger M., 2007, A&A, 471, 237
- Zima et al. (2006) Zima W., Wright D., Bentley J., Cottrell P. L., Heiter U., Mathias P., Poretti E., Lehmann H., Montemayor T. J., Breger M., 2006, A&A, 455, 235