An Unobscured type II quasar candidate: SDSS J012032.19-005501.9
Abstract
We report the finding of an unobscured type II Active Galactic Nuclei (AGN) candidate, SDSS J012032.19-005501.9 at a relatively high redshift of 0.601, which shows a number of unusual properties. It varies significantly on timescales of years as typical type I AGNs and marginally on timescales of weeks. The color-magnitude relation and the structure function are also consistent with that of type I AGNs, which imply that its variability likely originates from the black hole accretion system. However, no broad emission line is detected in the SDSS spectrum, and the upper limit of the equivalent width of the H broad emission line is much less than that of type I AGNs. These properties suggest that SDSS J012032.19-005501.9 may be an unobscured quasar without broad emission lines intrinsically, namely an unobscured type II AGN or “true” type II AGN. Furthermore, its continuum luminosity is at least one order of magnitude fainter than the average value of the past century expected from the [OIII] emission line. It indicates that SDSS J012032.19-005501.9 may be switching off. Additional possible scenarios to explain this intriguing source are also discussed. Future deep observations at multi-wavelengths are needed to reveal the nature of this peculiar and intriguing AGN.
Subject headings:
black hole physics — galaxies:active — galaxies: nuclei — galaxies: Seyfert1. Introduction
Active galactic nuclei (AGNs) are observationally classified into type I and type II, depending on the presence of broad emission lines (BELs) or lack thereof. Such a difference has been successfully explained by different viewing angles, known as the unified model of AGNs (Antonucci, 1993; Urry & Padovani, 1995). Other properties, like the variability can also be explained by this model (Wilhite et al., 2005; Yip et al., 2009). In the unified model, type II AGNs are more edge-on and obscured by the dusty torus, while type I AGNs are more face-on and unobscured. The unified model is supported by many observations such as the hidden BELs discovered in the polarization observation of type II AGNs (Antonucci & Miller, 1985; Miller & Goodrich, 1990; Zakamska et al., 2005) and the detection of infrared (IR) BELs (Goodrich et al., 1994; Veilleux et al., 1997).
However, the unified model may not be the whole story. Only one half of type II AGNs show hidden BELs (Kay, 1994; Tran, 2001; Moran, 2007) and only 25 have IR BELs (Veilleux et al., 1997; Riffel et al., 2006). In addition, type II AGNs with significant variability and/or no X-ray absorption have been discovered (Pappa et al., 2001; Hawkins, 2004; Xia et al., 2002; Brightman & Nandra, 2008). It indicates that there might be AGNs without intrinsic BELs, since Type II AGNs generally have very high HI column densities (10) (Risaliti et al., 1999) and there is no obvious variability for typical type II AGNs (Yip et al., 2009). Such kind of AGNs are called unobscured type II AGNs or “true” type II AGNs. Studies on unobscured type II AGNs may give clues to the formation of the broad line regions (BLRs) as well as the formation and evolution of AGNs.
There are a few compelling candidates of unobscured type II AGNs reported, such as NGC 3147, NGC 4594, NGC 7590, NGC 3660, Q2131-427, Mrk 273x, IRAS 01072+4954 and 2XMM J123103.2+110648 (Shi et al., 2010; Bianchi et al., 2012; Valencia-S. et al., 2012; Ho et al., 2012). Among these candidates, NGC 3147 is the most widely accepted example. This AGN lacks the detection of optical and infrared/polarized BELs, and the X-ray/mid-IR observation indicates a low level of obscuration (Shi et al., 2006; Bianchi et al., 2008; Brightman & Nandra, 2008; Shi et al., 2010; Matt et al., 2012). The nature of other candidates is still under debate (Ghosh et al., 2007; Panessa et al., 2009; Shi et al., 2010; Bianchi et al., 2012; Matt et al., 2012; Barth et al., 2014).
Observationally, most of the candidates have a low luminosity ( erg s-1) and a low accretion rate () (Shi et al., 2010; Bianchi et al., 2012; Valencia-S. et al., 2012; Ho et al., 2012). Both are consistent with the theoretical prediction that the formation of BLRs usually requires a high enough accretion rate to maintain a standard accretion disk (Nicastro, 2000; Laor, 2003; Czerny et al., 2004; Elitzur & Shlosman, 2006; Liu & Taam, 2009; Laor & Davis, 2011). In addition, if the accretion rate is lower and black hole (BH) mass is high, the emission from the disk would be too weak to provide sufficient ionizing photons for producing observable broad lines. Note that IRAS 01072+4954 and 2XMM J123103.2+110648 are two exceptions. The absence of BELs for these two objects can be explained by the high accretion rate and small BH mass.
In this paper, we report another unobscured type II AGN candidate, SDSS J012032.19-005501.9. This object was detected as a point source with Sloan Digital Sky Survey (SDSS) on September 19th, 1998, and was observed repeatedly by the SDSS Supernova Survey, labelled as the SDSS Stripe 82 (Richards et al., 2002). The follow-up spectrum (mjd-plate-fiberid: 52209-0696-243) shows significant narrow emission lines, e.g. H and [OIII] , but no BELs. The redshift was measured to be at 86% confidence level. Several groups originally identified it as a type II AGN due to emission lines (Zakamska et al., 2003; Véron-Cetty & Véron, 2006; Reyes et al., 2008) and/or X-ray/[OIII] luminosity ratio (Vignali et al., 2010; Jia et al., 2013).
This paper is organized as follows. In section 2, data analyses and results are presented, with spectrum analyses in section 2.1, studies on variability with SDSS Stripe 82 data in section 2.2 and broadband spectrum energy distribution (SED) in section 2.3. We discuss possible scenarios of its nature and give the conclusion in section 3. Throughout this paper, the cosmological parameters , =0.3 and =0.7 are adopted.
2. Data Analyses and Results
In order to search for unobscured type II AGNs, we used the light-motion curves from SDSS Stripe 82 presented in Bramich et al. (2008). The Stripe 82 data covers an area of about 300 deg2 in high Galactic latitudes, with right ascension (RA) from to 4h and declination (DEC) from 27 to 27. This region has been observed repeatedly for more than ten years. In Bramich et al. (2008), Stripe 82 data from 1998 to 2005 were recalibrated for varying photometric zero-points, achieving mag root mean square (RMS) accuracy in the , , and bands for point sources.
Using this catalog, we first selected objects which are classified as “star” with photometry in most observations (mean_obj_type_flag5.5) and required 3 in both the and bands. In total there are 41,835 objects morphologically classified as “star”. As such, their photometric magnitudes are not influenced by the variable seeing and can reflect the variability reliably. Then we cross matched these objects with SDSS DR8 catalogue within 3 arcsecs, and selected those with spectral classification “galaxy”. 227 objects are left after this selection. Finally, we classified them using narrow line ratio (Baldwin et al., 1981) and found that SDSS J012032.19-005501.9 is a type II AGN with significant variability. In the following, we present the optical spectrum, variability and broadband SED of SDSS J012032.19-005501.9 in detail.
2.1. Optical Spectrum
The spectrum was obtained by SDSS with mjd-plate-fiberid (mpf) 52209-0696-243 and was analyzed with the USTC program (Zhou et al., 2006). The Galactic extinction corrected rest frame spectrum, smoothed every 5 pixels is shown in grey on Fig. 1 (Fitzpatrick, 1999). The rest frame continuum was fit with a power-law function. A power law is a good description of the continuum due to the low S/N ratio. To avoid the contamination of emission lines and bad pixels, we masked the regions around the emission lines as well as the bad pixels. The spectrum bluer than 2450 was also masked because there are many negative values here, which suggests a non-proper calibration for this region. The regions used to fit the continuum are marked with green bands in Fig. 1. The best-fitting result is with a by degrees of freedom of . The blue line in Fig.1 shows this best-fit continuum. The measured flux of continuum at 5100 is .
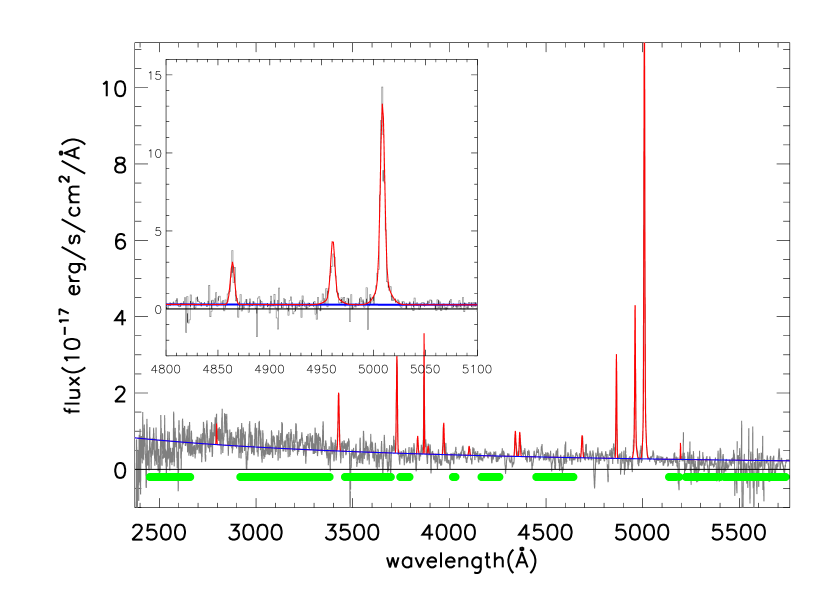
After subtracting the power law continuum, we then fitted the emission lines in the spectrum. We used a single Gaussian function to fit each emission line, except for [OIII] doublet for which we used double Gaussians. The full width half maximum (FWHM) of [OIII]4959 is tied with that of [OIII]5007, and the flux of [OIII]4959 is fixed to be a third of [OIII]5007, which is predicted by photoionization theory. The best-fit FWHM of [OIII] doublet is km/s. We plot the best-fitting emission lines in red in Fig. 1.
To identity whether it is an AGN or starburst galaxy, we applied the Baldwin-Phillips-Telervich (BPT) diagram (Baldwin et al., 1981). The flux of [OIII] 5007 is , and the flux of H is . The narrow line ratio [OIII]/H is larger than 6, which indicates there is a large chance this object is an AGN.
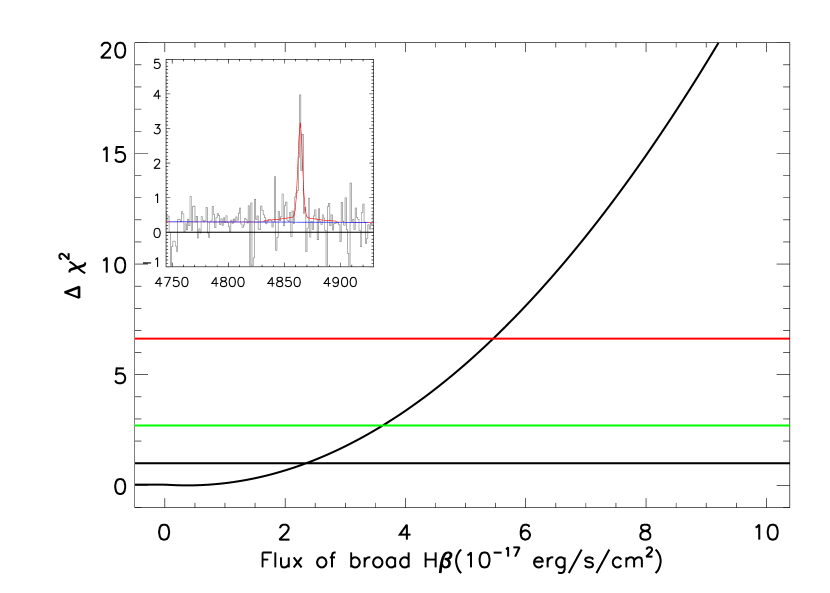
To test whether there is a broad H line in the spectrum, we further added a broad component in the fit. The center of the supposed broad line was fixed at 4682.68 , and the FWHM was fixed to be 2000 km/s. The calculated FWHM is 2156 km/s using and . was estimated by the FWHM of [OIII] 5007 (Kaspi et al., 2005) due to the lack of broad emissions. The total flux of the broad H line was assumed to be a free parameter in the fit. No significant broad component was found, and the upper limit of the broad line can be derived. Fig. 2 shows the versus the total flux of the broad component. The black, red and green horizontal lines indicate the 68%, 90% and 99% confidence level, defined by and 6.63 respectively (Avni, 1976). The and confidence level upper limits of the broad line were derived to be and . The inserted plot in Fig. 2 shows the total H emission line with the 90% upper limit of the broad component.
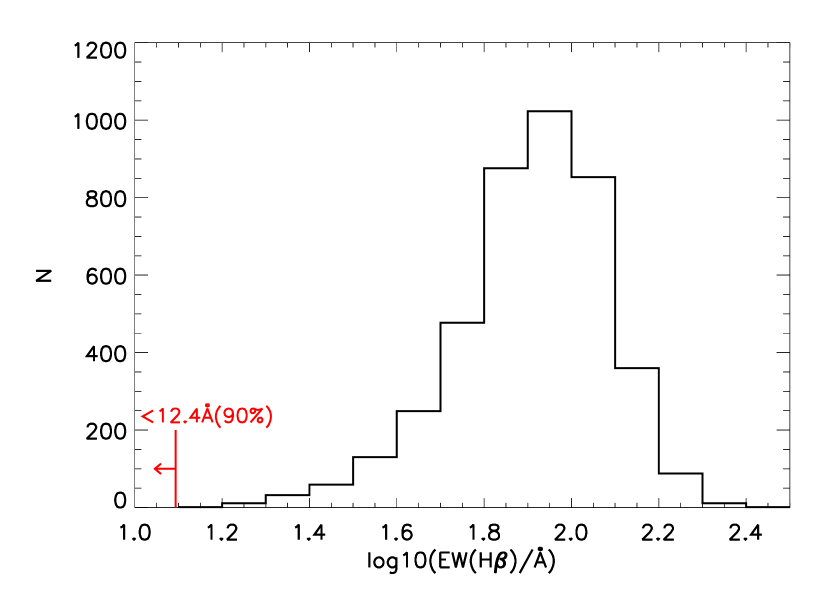
The upper limits of the equivalent width (EW) of the H broad line are 8.0 (68%) and 12.4 (90%) respectively. The EW of broad H line for typical type I AGNs are much larger, as shown by the histogram in Fig. 3 (Dong et al., 2009). The EW upper limit of SDSS J012032.19-005501.9 is smaller than all of the 4171 type I AGN sample in Dong et al. (2009). Even assuming a broad H line with FWHM 5000 km/s, the upper limits of EW are 21.5 (68%) and 28.2 (90%). Only 61 out of 4171 objects have an EW of broad H less than 28.2 (1.5%). This result indicates that there is no BEL in SDSS J012032.19-005501.9 and the spectrum is more like a type II AGN.
To evaluate the effect of the absolute flux of the spectrum, we re-calibrated the raw SDSS spectrum with the photometric data. The photometric data used to calibrate the raw spectrum are those obtained on mjd 52207, which is the date closest to the time the spectrum was obtained. The photometric magnitudes in the , and bands on mjd 52207 are mag, mag, and mag respectively. A wavelength-dependent correction factor was adopted since the discrepancies between the photometric data and the spectroscopic data vary in different bands. A fitting of the synthetic magnitudes of the spectrum to the photometric magnitudes resulted in a linear calibration relation with respect to wavelength in observer frame.
After the calibration, the flux of 5100 is , corresponding to (Kaspi et al., 2000; Collin et al., 2002; Richards et al., 2006). The luminosity of [OIII] estimated with the raw SDSS spectrum is and the calibrated luminosity of [OIII] is . It indicates a bolometric luminosity (Richards et al., 2006; Shen et al., 2011), which is 20 times larger than .
Due to the lack of broad lines and stellar velocity dispersion measurements of the host galaxy, the mass of the BH can not be well estimated. As a very rough estimate, we used the FWHM of [OIII] as an estimation of the stellar velocity dispersion.
With an [OIII] FWHM of 306 km/s, the estimated of SDSS J012032.19-005501.9 is (Wang & Lu, 2001; Xiao et al., 2011). The scatter of and [OIII] FWHM provides a lower limit of the uncertainty of the BH mass, which is dex. The Eddington ratio estimated with and is 11.5 and 0.5. The uncertainty of the Eddington ratio is affected by the uncertainty of BH mass and should be larger than dex.
2.2. Optical Variability
For the optical variability of SDSS J012032.19-005501.9, we used the Light-Motion Curve Catalogue (LMCC) from Bramich et al. (2008). The band lightcurve was not included because the data quality is very poor. There is also one point observed on HJD not included in the analysis. The , , and band lightcurves are shown in Fig. 4.
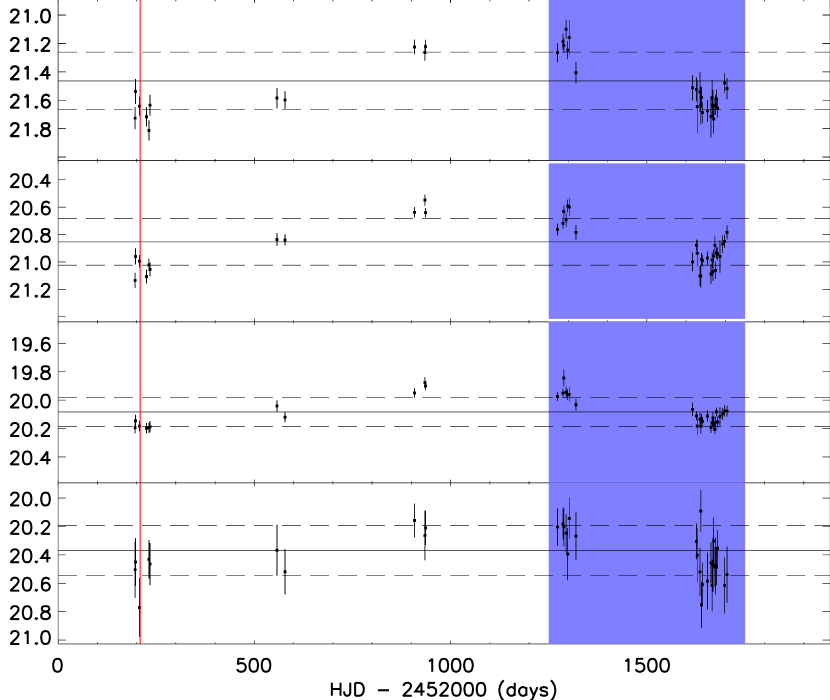
The solid black line in each band of Fig. 4 indicates the weighted mean value of this band, defined as , where and are the measured magnitude and uncertainty of the th observation. The RMS of the data points in each band, , is shown by the dashed lines. We adopted the to characterize the variability. The statistical results of the light curves in the four bands of Fig.4 are compiled in Table 1, both for the whole period with HJD and period . It is shown that SDSS J012032.19-005501.9 varies significantly in the , and bands. The probabilities of null hypothesis, i.e. no variability, are all less than in these three bands. The band variability is not so obvious because of the large photometric uncertainties in this band. There seems also to be variability on timescales of weeks, though it is only statistically marginal, with null probability 0.01 in more than one band. The significant variability of SDSS J012032.19-005501.9 indicates that it is unlikely to be an obscured type II AGN.
| band | mean | RMS | ||||
|---|---|---|---|---|---|---|
| HJD | ||||||
It would be interesting to compare the properties of the variability observed in SDSS J012032.19-005501.9 with those detected in normal unobscured AGNs, i.e., type I AGNs. Such comparisons may give us hints about the origin of the variability of SDSS J012032.19-005501.9.
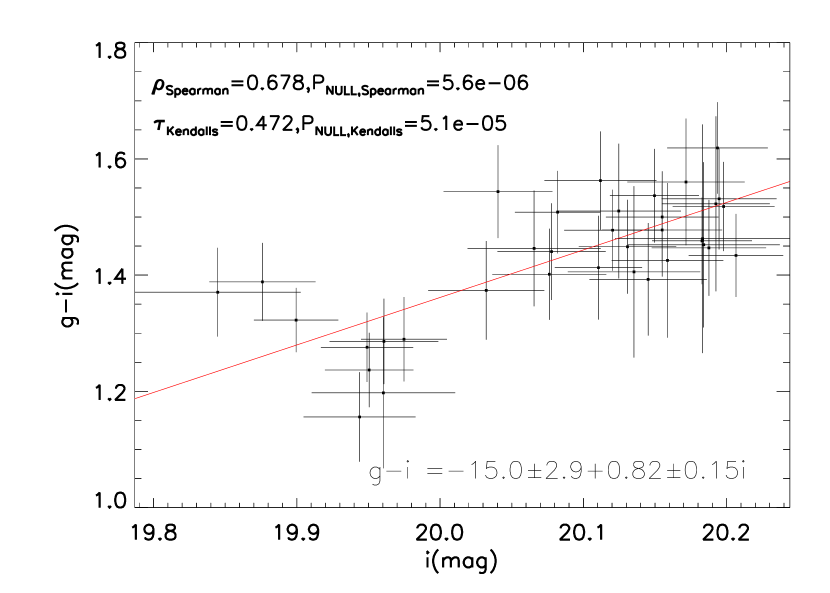
In general, type I AGNs become bluer when they are brighter (Wamsteker et al., 1990; Giveon et al., 1999; Webb & Malkan, 2000; Vanden Berk et al., 2004). The theoretical explanations of such behavior include a hotter accretion disk, thinner dust absorption, contamination of non-variable host galaxies, among others (Sakata et al., 2011). The color-magnitude plot of SDSS J012032.19-005501.9 is shown in Fig. 5. Here only the points with both detections in the and bands within 0.1 day are plotted. It is clear to see that becomes smaller (bluer) when the magnitude becomes smaller (brighter). We tested the correlation using Spearman’s rank correlation. The Spearman’s rank correlation coefficient is 0.678 and the null probability is . This result indicates that the variability of SDSS J012032.19-005501.9 is similar with that of typical type I AGNs, i.e., the brighter the bluer, although the origin is not clear.
Another commonly used tool to test the variability is the structure function (Simonetti et al., 1985; Kawaguchi et al., 1998; Hawkins, 2002; de Vries et al., 2005; Bauer et al., 2009; Meusinger et al., 2011; di Clemente et al., 1996; Vanden Berk et al., 2004; Rengstorf et al., 2006; Wilhite et al., 2008), which shows the variability on timescales ranging from days to years. Here we used the modified structure function (SF) defined in di Clemente et al. (1996)
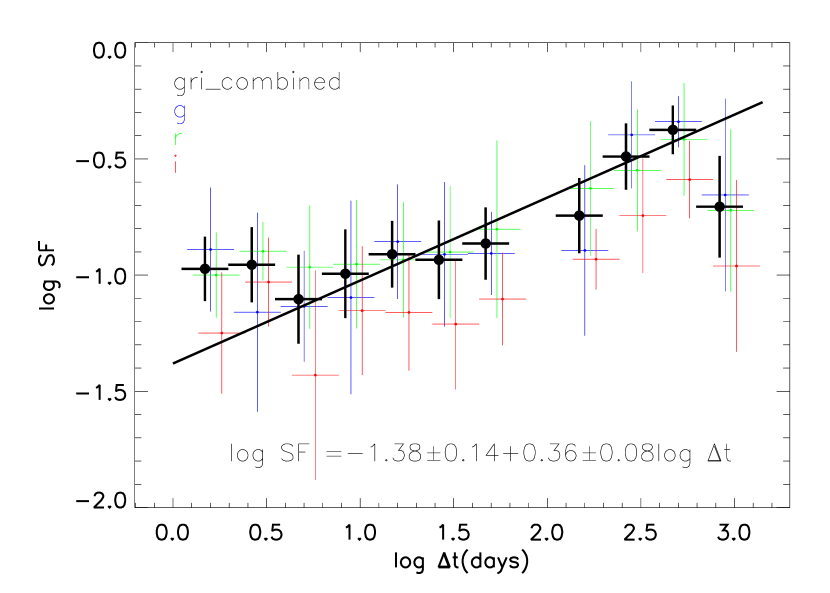
where is the magnitude in time and the terms within the indicates the mean value. The first term within the is the mean of the absolute value of the magnitude difference between one pair of points whose time lag is . The factor is the Gaussian distribution noise. is the standard deviation in each pair, used to correct for the photometric uncertainty (Wilhite et al., 2008). The time lag is computed in the rest frame, . The mean of the structure function values are calculated for different time bins, with 0.25 dex per bin. The mean structure function in the (blue), (green) and (red) bands are plotted in Fig. 6, with shifting rightwards for 0.05, 0.10 and 0.15 dex respectively in order to have a clear view. The error bar indicates the RMS within that bin, which is much larger than the value obtained from error propagation. For type I AGNs, the structure function with timescales larger than 10 days can generally be well fitted by power law function, with index (Vanden Berk et al., 2004; Rengstorf et al., 2006; Wilhite et al., 2008; Meusinger et al., 2011).
After shifting the () band structure function by minimizing the between the () and band structure function values, mean value of the three bands in each timescale bin was calculated and shown as the black point. The uncertainty of this mean structure function was calculated using standard error propagation. The points with timescales less than 10 days show a plateau. This is similar to typical type I AGNs (Ai et al., 2013). The points with timescales larger than 10 days can be fitted by a power-law function and the best fitting result of the mean structure function is
where the errors are at the 68% confidence level. The last point, that shows a drop, was not used because this is a known artifact of the structure functions due to the finite length of AGN light curves. The index is consistent with the result of typical type I AGNs (Wilhite et al., 2008; Meusinger et al., 2011; Ai et al., 2013). However, it should be noted that the structure functions for individual AGNs usually suffer from large statistical uncertainties unless their lightcurves are very well sampled over a large range of timescales(Emmanoulopoulos et al., 2010). Cautions should thus be paid when interpreting the observed structure function of this object.
In summary, SDSS J012032.19-005501.9 shows significant optical variability on timescales of years and marginal variability on timescales of weeks. Furthermore, the amplitudes, the color dependence on magnitude, and the structure function of the variability are all similar to typical type I AGNs.
2.3. Broadband Spectral Energy Distribution
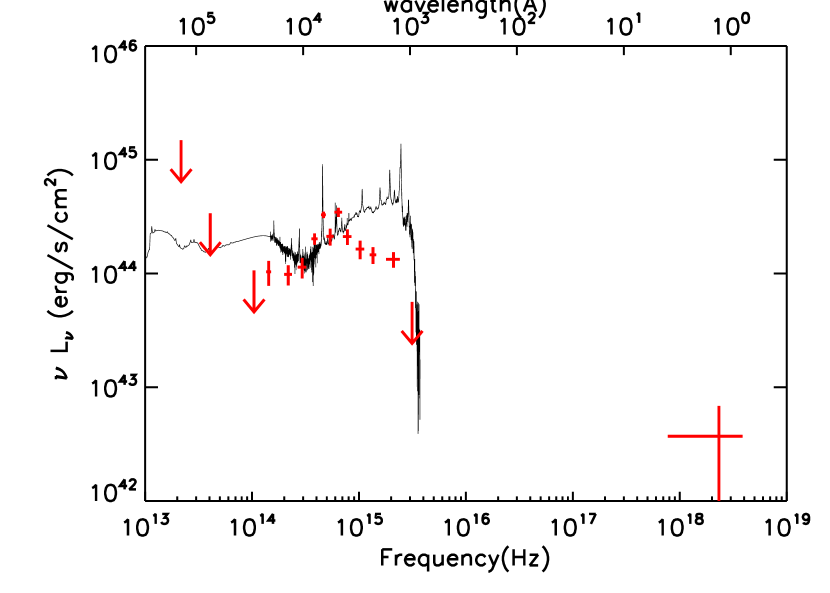
The multiwavelength data of SDSS J012032.19-005501.9 were compiled from the archive database, including the websites of FIRST, WISE, UKIDSS, SDSS and Chandra. The SED was calculated correcting for Galactic extinction. If there were multiple observations in any single band, the weighted mean of all the measurements were adopted. The errors of these fluxes were adopted to be , where RMS is the scatter between multiple measurements, and is the error of the weighted mean value which characterizes the measurement uncertainty. In X-ray band, this source was observed by Chandra on 02/18/2007, i.e., MJD=54149, and it shows a low X-ray luminosity during that observation (Vignali et al., 2010; Jia et al., 2013). The count rate shown in Vignali et al. (2010) is converted to a flux of in keV with WebPIMMs, assuming a power law spectrum with Galactic neutral hydrogen . The X-ray net counts in 0.5-2 keV and 2-8 keV are and , respectively. The rest frame broadband SED is plotted in Fig. 7 with red points. The black line shows the composite spectrum of type I AGN.
The broadband SED peaks at Hz and shows a sharp cutoff in FUV/EUV band. We note that the Big Blue Bump (BBB), which peaks around Hz and is commonly seen in type I quasars (Ho, 2008), is not observed in SDSS J012032.19-005501.9. The IR bump, which peaks in Hz and is believed to originate from the dusty torus, is also absent.
We integrated the broadband SED from optical to X-ray and obtained the bolometric luminosity . Such a value is consistent with the bolometric luminosity estimated with the optical continuum, , although a little lower.
3. Discussion and Conclusion
As mentioned above, the spectrum of SDSS J012032.19-005501.9 lacks detectable BELs, with upper limits on the broad H EW 8.0 (68%) and 12.4 (90%). However, its variability properties are similar to typical type I AGNs: the significant variations, the color-magnitude relation, and the slope of the structure function. In addition, the bolometric luminosity of SDSS J012032.19-005501.9 is , which is much lower than the ionizing continuum predicted with [OIII] luminosity. Now we discuss possible scenarios to explain the strange properties of this intriguing source.
(1) A tidal Disruption Event (TDE) in a gas rich environment
Recently, several candidate TDEs in gas-rich environments have been discovered. Their emission-line signature consists of both broad and narrow lines, of which broad lines are only detected in the early stages (Komossa et al., 2008; Wang et al., 2011). However, if SDSS J012032.19-005501.9 is such an event, it would be difficult to understand the optical continuum brightness and the variability. In TDEs, the continuum fades away quickly, following approximately a law. Such a trend has not been seen in the optical lightcurve of SDSS J012032.19-005501.9.
(2) An AGN changing its type, from type I to type II, or vice versa
Several AGNs which change their classifications have been identified. Some Seyferts which were previously known as type II have changed to type I, and vise versa (Khachikian & Weedman, 1971; Tohline & Osterbrock, 1976; Shappee et al., 2014). However, in NGC 2617, the change in type was accompanied with very high-amplitude optical continuum variability (Shappee et al., 2014), while the variability of SDSS J012032.19-005501.9 we detect was only mild.
Furthermore, if SDSS J012032.19-005501.9 is such a case, it should be in a low state when it does not show broad emission lines in optical spectrum and/or when it shows small X-ray/[OIII] luminosity ratio. However, a detection of Palomar Transient Factury (PTF) on MJD=54090, around 60 days before Chandra observation, shows 20.38 0.33 mag in V band. The data likely indicate that this object was not in a low state during the Chandra observation. It would require that the changes of X-ray and optical continuum occur non-simultaneously. In addition, a neutral hydrogen density , as shown in Jia et al. (2013), is required for a median-high state AGN, which is also not easy to explain.
However, the uncertainty of PTF detection is very large, and SDSS J012032.19-005501.9 can still be type 1.9 during Chandra observation. It can alleviate the difficulty of high , although is still extreme for type 1.9 AGNs (Risaliti et al., 1999). As a result, this scenario cannot be fully excluded, although is not preferred. If SDSS J012032.19-005501.9 is such a case, further spectroscopic monitoring should reveal its change into a type I source at some time.
(3) An AGN with full or partial covering by a dusty absorber
If a dusty absorber fully covers the continuum source and a major part of the BLR, then the observed variability timescale of about 1 year would correspond to the travel time of the dusty absorber. In addition, the dust should be far enough away from the central continuum source in order to survive. With = and , we expect the dust survival distances to be and 0.8 ly (Netzer, 2006), and the required velocity of the dusty cloud would be and , assuming a BH mass of . If the short timescale variability is true, the required velocity would be even larger. Therefore, a full covering absorber is unlikely to explain the properties of SDSS J012032.19-005501.9.
Partial covering of the central source and BLR by a dusty absorber can provide us with a glimpse into the central engine, of which a certain fraction, say 10%, is seen directly. This can explain the observed variability. Partial covering in the UV has been identified before in several quasars (Hamann et al., 1997; Arav et al., 2002). Such a scenario can also account for the small [OIII] EW, provided the partial covering occurs mostly along our line-of-sight. However, to obscure a significant fraction of the BLR without obscuring the central source requires a rather massive and extended absorber with a very peculiar geometry. The probability of such a case is relatively small.
(4) An AGN which truly lacks a broad line region.
In this scenario, SDSS J012032.19-005501.9 is a “true” type II quasar, i.e. an unobscured type II quasar.
In the unified model of AGNs, the absence of BELs in normal type II AGNs is caused by obscuration. However, this is probably not applicable to SDSS J012032.19-005501.9 because the optical variability of this object indicates that the optical radiation is more likely emitted from the central engine directly, presumably the accretion disk, instead of being scattered as in “normal” type II AGNs. In other words, the central engine of SDSS J012032.19-005501.9 should not be obscured. This conclusion can be further supported by the analysis of the color-magnitude relation and the structure function. Like type I AGNs, SDSS J012032.19-005501.9 becomes bluer when brighter (Wamsteker et al., 1990; Giveon et al., 1999; Webb & Malkan, 2000; Vanden Berk et al., 2004). Further, its structure function can be fitted with a power law, with an index consistent with that of type I AGNs (Vanden Berk et al., 2004; Rengstorf et al., 2006; Wilhite et al., 2008; Meusinger et al., 2011).
Many hints show that the optical variability of AGNs is driven by fundamental processes, like the accretion rate (Pereyra et al., 2006; Wilhite et al., 2008). The similarity between the variability of this object with typical type I AGNs is likely caused by intrinsic mechanisms (e.g., an instability or variability in the accretion rate) rather than a variation of obscuration or extinction. Furthermore, as shown in Vignali et al. (2010), the X-ray net counts in 0.5-2 keV and 2-8 keV are and respectively, which are comparable. This indicates that the X-ray spectrum may not be as hard as predicted if there is significant obscuration of X-rays.
Since we argue that the optical emission of SDSS J012032.19-005501.9 is likely intrinsic (not scattered), the very small EW of the BEL, less than 8.0 (68%) and 12.4 (90%), should not be the result of obscuration — if any111A moderate obscuration may exist in the broadband SED, which can be reproduced by a reddened typical quasar spectrum with E(BV) .. This is because, in general, the dust obscuration is considered to be from the torus, i.e., dusty clouds between BLR and NLR. Obscuration from the torus should be the same for both the accretion disk and the BLR. Therefore, the extinction of the continuum emission and BELs should be similar. But such a scenario cannot explain the low EW of the BELs. We therefore conclude that SDSS J012032.19-005501.9 is a good candidate of a true type II AGN.
(5) An AGN switching off
The bolometric luminosity of SDSS J012032.19-005501.9 estimated from the broadband SED and the luminosity of 5100 is and respectively. However, according to the flux of [OIII] , the bolometric luminosity is , which is more than 20 times higher than and . The ratio is also smaller by more than one order of magnitude than the typical value (Vignali et al., 2010; Jia et al., 2013).
Another possible speculation is SDSS J012032.19-005501.9 may be switching off (Denney et al., 2014), or be undergoing large-amplitude variability (Grupe et al., 2013). In the case, the object may have already dropped to a very low state currently, in which the broad H line is too weak to be detectable. The narrow-line emission reflects a previous higher state emission. Note that the conversion between [OIII] luminosity and the bolometric luminosity has a large scatter (about 0.6 dex) (Richards et al., 2006; Shen et al., 2011), and so there is currently no compelling evidence for this scenario.
In summary, the multi-wavelength properties of SDSS J012032.19-005501.9 make it a good candidate of a true type II AGN, but we cannot yet fully exclude the partial obscuration scenario or an AGN changing its type. It is also possible that we see an AGN switching off. A number of future observations would uncover important clues as to the nature of this particular source. For example, deep X-ray observations will allow us to search for hard X-rays, present if this galaxy is heavily obscured. If a faint permanent BLR exists, it may be found with high S/N optical spectroscopy (or polarimetry) and long-term optical spectroscopic monitoring could probably detect a spectroscopic type change.
References
- Ai et al. (2013) Ai, Y. L., Yuan, W., Zhou, H., et al. 2013, AJ, 145, 90
- Antonucci (1993) Antonucci, R. 1993, ARA&A, 31, 473
- Antonucci & Miller (1985) Antonucci, R. R. J. & Miller, J. S. 1985, ApJ, 297, 621
- Arav et al. (2002) Arav, N., Korista, K. T., & de Kool, M. 2002, ApJ, 566, 699
- Avni (1976) Avni, Y. 1976, ApJ, 210, 642
- Baldwin et al. (1981) Baldwin, J. A., Phillips, M. M., & Terlevich, R. 1981, PASP, 93, 5
- Barth et al. (2014) Barth, A. J., Voevodkin, A., Carson, D. J., & Woźniak, P. 2014, AJ, 147, 12
- Bauer et al. (2009) Bauer, A., Baltay, C., Coppi, P., et al. 2009, ApJ, 705, 46
- Bianchi et al. (2008) Bianchi, S., Corral, A., Panessa, F., et al. 2008, MNRAS, 385, 195
- Bianchi et al. (2012) Bianchi, S., Panessa, F., Barcons, X., et al. 2012, MNRAS, 426, 3225
- Bramich et al. (2008) Bramich, D. M., Vidrih, S., Wyrzykowski, L., et al. 2008, MNRAS, 386, 887
- Brightman & Nandra (2008) Brightman, M. & Nandra, K. 2008, MNRAS, 390, 1241
- Collin et al. (2002) Collin, S., Boisson, C., Mouchet, M., et al. 2002, A&A, 388, 771
- Czerny et al. (2004) Czerny, B., Rózańska, A., & Kuraszkiewicz, J. 2004, A&A, 428, 39
- de Vries et al. (2005) de Vries, W. H., Becker, R. H., White, R. L., & Loomis, C. 2005, AJ, 129, 615
- Denney et al. (2014) Denney, K. D., De Rosa, G., Croxall, K., et al. 2014, ArXiv e-prints
- di Clemente et al. (1996) di Clemente, A., Giallongo, E., Natali, G., Trevese, D., & Vagnetti, F. 1996, ApJ, 463, 466
- Dong et al. (2009) Dong, X., Wang, J., Wang, T., et al. 2009, in Astronomical Society of the Pacific Conference Series, Vol. 408, The Starburst-AGN Connection, ed. W. Wang, Z. Yang, Z. Luo, & Z. Chen, 83
- Elitzur & Shlosman (2006) Elitzur, M. & Shlosman, I. 2006, ApJ, 648, L101
- Emmanoulopoulos et al. (2010) Emmanoulopoulos, D., McHardy, I. M., & Uttley, P. 2010, MNRAS, 404, 931
- Fitzpatrick (1999) Fitzpatrick, E. L. 1999, PASP, 111, 63
- Ghosh et al. (2007) Ghosh, H., Pogge, R. W., Mathur, S., Martini, P., & Shields, J. C. 2007, ApJ, 656, 105
- Giveon et al. (1999) Giveon, U., Maoz, D., Kaspi, S., Netzer, H., & Smith, P. S. 1999, MNRAS, 306, 637
- Goodrich et al. (1994) Goodrich, R. W., Veilleux, S., & Hill, G. J. 1994, ApJ, 422, 521
- Grupe et al. (2013) Grupe, D., Komossa, S., Scharwächter, J., et al. 2013, AJ, 146, 78
- Hamann et al. (1997) Hamann, F., Barlow, T. A., Junkkarinen, V., & Burbidge, E. M. 1997, ApJ, 478, 80
- Hawkins (2002) Hawkins, M. R. S. 2002, MNRAS, 329, 76
- Hawkins (2004) —. 2004, A&A, 424, 519
- Ho (2008) Ho, L. C. 2008, ARA&A, 46, 475
- Ho et al. (2012) Ho, L. C., Kim, M., & Terashima, Y. 2012, ApJ, 759, L16
- Jia et al. (2013) Jia, J., Ptak, A., Heckman, T., & Zakamska, N. L. 2013, ApJ, 777, 27
- Kaspi et al. (2005) Kaspi, S., Maoz, D., Netzer, H., et al. 2005, ApJ, 629, 61
- Kaspi et al. (2000) Kaspi, S., Smith, P. S., Netzer, H., et al. 2000, ApJ, 533, 631
- Kawaguchi et al. (1998) Kawaguchi, T., Mineshige, S., Umemura, M., & Turner, E. L. 1998, ApJ, 504, 671
- Kay (1994) Kay, L. E. 1994, ApJ, 430, 196
- Khachikian & Weedman (1971) Khachikian, E. Y. & Weedman, D. W. 1971, ApJ, 164, L109
- Komossa et al. (2008) Komossa, S., Zhou, H., Wang, T., et al. 2008, ApJ, 678, L13
- Laor (2003) Laor, A. 2003, ApJ, 590, 86
- Laor & Davis (2011) Laor, A. & Davis, S. W. 2011, MNRAS, 417, 681
- Liu & Taam (2009) Liu, B. F. & Taam, R. E. 2009, ApJ, 707, 233
- Matt et al. (2012) Matt, G., Bianchi, S., Guainazzi, M., Barcons, X., & Panessa, F. 2012, A&A, 540, A111
- Meusinger et al. (2011) Meusinger, H., Hinze, A., & de Hoon, A. 2011, A&A, 525, A37
- Miller & Goodrich (1990) Miller, J. S. & Goodrich, R. W. 1990, ApJ, 355, 456
- Moran (2007) Moran, E. C. 2007, in Astronomical Society of the Pacific Conference Series, Vol. 373, The Central Engine of Active Galactic Nuclei, ed. L. C. Ho & J.-W. Wang, 425–+
- Netzer (2006) Netzer, H. 2006, in Lecture Notes in Physics, Berlin Springer Verlag, Vol. 693, Physics of Active Galactic Nuclei at all Scales, ed. D. Alloin, 1
- Nicastro (2000) Nicastro, F. 2000, ApJ, 530, L65
- Page et al. (2011) Page, M. J., Carrera, F. J., Stevens, J. A., Ebrero, J., & Blustin, A. J. 2011, MNRAS, 416, 2792
- Panessa et al. (2009) Panessa, F., Carrera, F. J., Bianchi, S., et al. 2009, MNRAS, 398, 1951
- Pappa et al. (2001) Pappa, A., Georgantopoulos, I., Stewart, G. C., & Zezas, A. L. 2001, MNRAS, 326, 995
- Pereyra et al. (2006) Pereyra, N. A., Vanden Berk, D. E., Turnshek, D. A., et al. 2006, ApJ, 642, 87
- Rengstorf et al. (2006) Rengstorf, A. W., Brunner, R. J., & Wilhite, B. C. 2006, AJ, 131, 1923
- Reyes et al. (2008) Reyes, R., Zakamska, N. L., Strauss, M. A., et al. 2008, AJ, 136, 2373
- Richards et al. (2002) Richards, G. T., Fan, X., Newberg, H. J., et al. 2002, AJ, 123, 2945
- Richards et al. (2006) Richards, G. T., Lacy, M., Storrie-Lombardi, L. J., et al. 2006, ApJS, 166, 470
- Riffel et al. (2006) Riffel, R., Rodríguez-Ardila, A., & Pastoriza, M. G. 2006, A&A, 457, 61
- Risaliti et al. (1999) Risaliti, G., Maiolino, R., & Salvati, M. 1999, ApJ, 522, 157
- Sakata et al. (2011) Sakata, Y., Morokuma, T., Minezaki, T., et al. 2011, ApJ, 731, 50
- Shappee et al. (2014) Shappee, B. J., Prieto, J. L., Grupe, D., et al. 2014, ApJ, 788, 48
- Shen et al. (2011) Shen, Y., Richards, G. T., Strauss, M. A., et al. 2011, ApJS, 194, 45
- Shi et al. (2006) Shi, Y., Rieke, G. H., Hines, D. C., et al. 2006, ApJ, 653, 127
- Shi et al. (2010) Shi, Y., Rieke, G. H., Smith, P., et al. 2010, ApJ, 714, 115
- Simonetti et al. (1985) Simonetti, J. H., Cordes, J. M., & Heeschen, D. S. 1985, ApJ, 296, 46
- Steffen et al. (2006) Steffen, A. T., Strateva, I., Brandt, W. N., et al. 2006, AJ, 131, 2826
- Strateva et al. (2005) Strateva, I. V., Brandt, W. N., Schneider, D. P., Vanden Berk, D. G., & Vignali, C. 2005, AJ, 130, 387
- Tohline & Osterbrock (1976) Tohline, J. E. & Osterbrock, D. E. 1976, ApJ, 210, L117
- Tran (2001) Tran, H. D. 2001, ApJ, 554, L19
- Urry & Padovani (1995) Urry, C. M. & Padovani, P. 1995, PASP, 107, 803
- Valencia-S. et al. (2012) Valencia-S., M., Zuther, J., Eckart, A., et al. 2012, A&A, 544, A129
- Vanden Berk et al. (2004) Vanden Berk, D. E., Wilhite, B. C., Kron, R. G., et al. 2004, ApJ, 601, 692
- Veilleux et al. (1997) Veilleux, S., Goodrich, R. W., & Hill, G. J. 1997, ApJ, 477, 631
- Véron-Cetty & Véron (2006) Véron-Cetty, M.-P. & Véron, P. 2006, A&A, 455, 773
- Vignali et al. (2010) Vignali, C., Alexander, D. M., Gilli, R., & Pozzi, F. 2010, MNRAS, 404, 48
- Wamsteker et al. (1990) Wamsteker, W., Rodriguez-Pascual, P., Wills, B. J., et al. 1990, ApJ, 354, 446
- Wang & Lu (2001) Wang, T. & Lu, Y. 2001, A&A, 377, 52
- Wang et al. (2011) Wang, T.-G., Zhou, H.-Y., Wang, L.-F., Lu, H.-L., & Xu, D. 2011, ApJ, 740, 85
- Webb & Malkan (2000) Webb, W. & Malkan, M. 2000, ApJ, 540, 652
- Wilhite et al. (2008) Wilhite, B. C., Brunner, R. J., Grier, C. J., Schneider, D. P., & vanden Berk, D. E. 2008, MNRAS, 383, 1232
- Wilhite et al. (2005) Wilhite, B. C., Vanden Berk, D. E., Kron, R. G., et al. 2005, ApJ, 633, 638
- Xia et al. (2002) Xia, X. Y., Xue, S. J., Mao, S., et al. 2002, ApJ, 564, 196
- Xiao et al. (2011) Xiao, T., Barth, A. J., Greene, J. E., et al. 2011, ApJ, 739, 28
- Yip et al. (2009) Yip, C. W., Connolly, A. J., Vanden Berk, D. E., et al. 2009, AJ, 137, 5120
- Yuan et al. (1998) Yuan, W., Brinkmann, W., Siebert, J., & Voges, W. 1998, A&A, 330, 108
- Zakamska et al. (2005) Zakamska, N. L., Schmidt, G. D., Smith, P. S., et al. 2005, AJ, 129, 1212
- Zakamska et al. (2003) Zakamska, N. L., Strauss, M. A., Krolik, J. H., et al. 2003, AJ, 126, 2125
- Zhou et al. (2006) Zhou, H., Wang, T., Yuan, W., et al. 2006, ApJS, 166, 128