Quasi-Two Dimensional Spin and Phonon Excitations in
Abstract
We present time-of-flight inelastic neutron scattering measurements of (LBCO), a lightly doped member of the high temperature superconducting La-based cuprate family. By using time-of-flight neutron instrumentation coupled with single crystal sample rotation we obtain a four-dimensional data set (three Q and one energy) that is both comprehensive and spans a large region of reciprocal space. Our measurements identify rich structure in the energy dependence of the highly dispersive spin excitations, which are centered at equivalent () wave-vectors. These structures correlate strongly with several crossings of the spin excitations with the lightly dispersive phonons found in this system. These effects are significant and account for on the order of 25 of the total inelastic scattering for energies between 5 and 40meV at low . Interestingly, this scattering also presents little or no -dependence. As the phonons and dispersive spin excitations centred at equivalent () wave-vectors are common to all members of La-based 214 copper oxides, we conclude such strong quasi-two dimensional scattering enhancements are likely to occur in all such 214 families of materials, including those concentrations corresponding to superconducting ground states. Such a phenomenon appears to be a fundamental characteristic of these materials and is potentially related to superconducting pairing.
I Introduction
The mechanism underlying high temperature superconductivity (HTS) has been intensely debated since the discovery of the first HTS, (LBCO)Bednorz_ZPhysB_1986 . Much of this research has focused on the correlation between magnetic structures and fluctuations in these systems with their superconducting ground statesTimusk_RepProgPhys_1999 ; Fujita_JPhysSocJpn_2012 ; Birgeneau_JPhysSocJpn_2006 ; Kastner_RevModPhys_1998 . In the cuprates, this correlation is manifest as the evolution of an insulating, three dimensional, commensurate antiferromagnet to a superconducting, two dimensional (2D), incommensurate antiferromagnet with dopingKeimer_PRB_1992 ; Wagman_PRB_2013 ; DoironLeyraud_Nature_2007 ; Stock_PRB_2008 ; Enoki_PRL_2013 ; Armitage_RevModPhys_2010 ; Taillefer_AnnRevCondMattPhys_2010 . This phenomenon is rich, supporting viewpoints spanning those which focus on the competition between the two ground states, to those focused on their proximity and contiguous nature Sachdev_JPhysCondMatt_2012 ; Kivelson_RevModPhys_2003 ; Lake_Nature_2002 .
At doping levels for which commensurate antiferromagnetism is lost, the predominant magnetic excitations in La-based cuprates have a characteristic extended hour-glass dispersion, which is centered at equivalent () positions within the pseudo-tetragonal basal planeHayden_PRB_1996 . The dispersion approaches the commensurate position at an energy scale that is known to be dependent on the concentration of holes introduced into the copper oxide planesMatsuda_PRL_2008 , before dispersing out towards the Brillouin zone boundary at 200-300meVColdea_PRL_2001 ; Headings_PRL_2010 ; Tranquada_Nature_2004 ; Hayden_PRL_1996 . Notably, these excitations display little dependence, indicative of two dimensional (2D) dynamic spin correlations within a three dimesional (3D) crystal structureWagman_PRB_2013 ; Machida_JPhysSocJpn_1999 .
In the last few years, a number of studies have turned to investigate the structure in the energy dependence along these dispersive modes. Such studies have appeared for (LSCO)Matsuda_PRB_2013 ; Christensen_PRL_2004 ; Lipscombe_PRL_2009 ; Vignolle_NaturePhys_2007 , LBCOXu_Arxiv_2013 , as well as both Ni and Zn doped LSCOWilson_PRB_2012 ; Matsuura_PRB_2012 , Stock_PRB_2004 , and Li_NaturePhysics_2012 . In particular, some neutron scattering studiesChristensen_PRL_2004 ; Lipscombe_PRL_2009 ; Vignolle_NaturePhys_2007 on superconducting LSCO have reported striking correlations between superconductivity and a peak in the dynamic susceptibility near 20meVLipscombe_PRL_2009 ; Vignolle_NaturePhys_2007 . However, all of these studies focus exclusively on scattering at the smallest Q = () 2D magnetic zone centres (2DMZCs), and do not inform on the comprehensive scattering at larger Q, which is determined by both spin and lattice degrees of freedom, as well as any interaction between these.
Here, we report inelastic neutron scattering measurements on LBCO with x = 0.035. This sample is neither superconducting nor a 3D commensurate antiferromagnet. It displays frozen 2D incommensurate magnetic order at low temperatures, similar to LSCO of the same dopingKeimer_PRB_1992 ; Wagman_PRB_2013 . As we will report, we find that this sample exhibits large enhancements of its highly dispersive magnetic inelastic scattered intensity at energies that correspond to crossings of the spin excitations with lightly dispersive phonons. In particular, the strongest such enhancements occur at the lowest of such spin-phonon crossings, which are near 15 meV and 19 meV in LBCO.
II Experimental Details
Single crystals were grown by the floating zone method and aligned with the plane horizontalFujita_PRB_2002 ; Dunsiger_PRB_2008 . The sample was mounted in a closed cycle refrigerator, whose temperarture was controlled between 300 K and a base temperature of 7 K. Over this temperature range, the crystal structure for LBCO is orthorhombic with space group BmabZhao_PRB_2007 ; Axe_PRL_1989 . However, since the mismatch between the a and b lattice parameters is slight, we will approximate the crystal structure by the high temperature tetragonal structure of LBCO, whose space group is with a = b = 3.78 and c = 13.2Katano_PhysicaC_1993 ; Lee_JPhysSocJpn_2000 . Neutron scattering measurements were performed on the ARCS spectrometer at Oak Ridge National Laboratory using an incident energy of 60 meV. ARCS is a time-of-flight chopper spectrometer with large position-sensitive detector coverage Abernathy_RevSciInst_2012 . Coupled with single crystal sample rotation, the resulting four-dimensional (4D) neutron data set (three Q dimensions and energy) is comprehensive and reveals the full complexity of the inelastic spectrum below 40meV for Ei = 60 meV. Computation reduction and visualization were achieved using Mantid and Horace respectivelyMantid ; Horace .
III Results and Discussion
III.1 Energy Dependent Structure to the Dispersive Magnetic Excitations
Figure 1 shows a representative energy vs. wave-vector intensity contour at 7 K. This data, and all the data presented in this paper, have had an empty cryostat data set subtracted from them in order to better isolate the crystal signal from the background due to the cryostat. We discuss this subtraction further in the Supplemental Materialsupplemental . This projection of the master 4D data set employs two integrations. The first is a narrow integration along . We couple this with a fairly large integration along . This ensures we capture the full 2D magnetic scattering, which is evident as isotropic rods along (see the () rods in the panels of Fig. 3). As a result, Fig. 1 displays a series of equivalent 2DMZCs ranging from (,) to (,). Note that this measurement does not resolve the incommensuration of the magnetic scattering but instead shows highly dispersive rods of inelastic scattering centered on equivalent () positions.
We observe clear structure in Fig. 1 as a function of energy near the 2DMZCs. Focusing on (), where the magnetic scattering is strongest and the phonon scattering is weakest, the scattered intensity is much greater below 19meV than above. We also see considerable enhancement of the 19meV scattering, which is pronounced at higher- equivalent 2DMZCs, such as (). We find that this structure develops at the many positions in Q and energy that correspond to the crossings of the spin excitations with phonons. - particularily, the crossing where the low-lying 19 meV optic phonon crosses the 2DMZCsAxe_PRL_1989 .
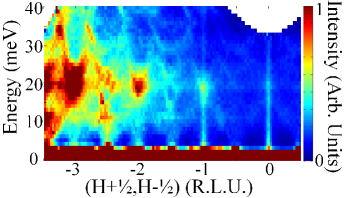
At higher , we find that this crossing enhancement grows dramatically in intensity and breadth in both energy and width along Q. While purely magnetic scattering drops off with increasing as the square of the magnetic form factor, phonon intensities scale roughly as the magnitude of Q squaredSquires_Text . Indeed, we see in Fig 1. that away from the spin-phonon crossings, the dispersive rods of magnetic excitations diminish with increasing , while the phonon-dominated non-magnetic background increases markedly with . Therefore, the large enhancement of the (-) and (-) scattering near 19 meV cannot be purely magnetic in origin. The enhancement is also surprisingly strong, given the modest phonon intensities at wave-vectors somewhat removed from these 2DMZCs, suggestive that the optic phonons near 2DMZCs qualitatively differ from those away from these wave-vectors.
III.2 Scattering within the and Planes
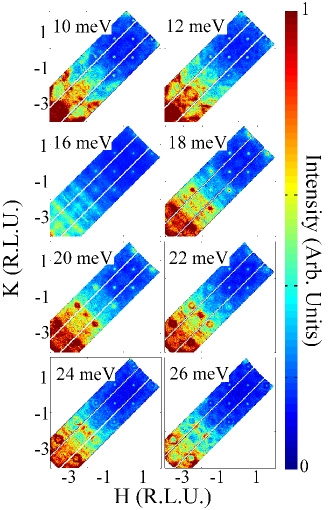
We take advantage of the 4D nature of our data to project into another scattering plane. In Fig. 2, we integrate over the same range as in Fig. 1, but instead we now integrate by 1 meV in energy to view the scattering in the plane. Beginning with the maps at 10 and 12 meV (top row of Fig. 2), we can see intense spots of scattering at equivalent 2DMZCs. Again, note the drop in intensity at equivalent positions with higher . Then, by 16 meV, the scattered intensity increases at these 2DMZCs. We emphasize that the scattered intensity at equivalent magnetic wave-vectors with higher is now distinguishable from background unlike at lower energies, which do not correspond to the crossing of spin excitations with phonons. At 18 and 20 meV, the scattering at all magnetic positions has increased dramatically in both intensity and breadth in the plane - particularily at higher . By 22 meV, clear ring-like excitations develop centered on the 2DMZCs. We identify these rings as arising from optic phonons, which disperse upwards in energy from a minimum near 19 meV at the equivalent (,) positions. The scattering from these phonons is strongest at high and is difficult to detect at low . Moreover, by 22 meV, the scattered intensity at equivalent 2DMZCs has decreased and is again strongest at low .
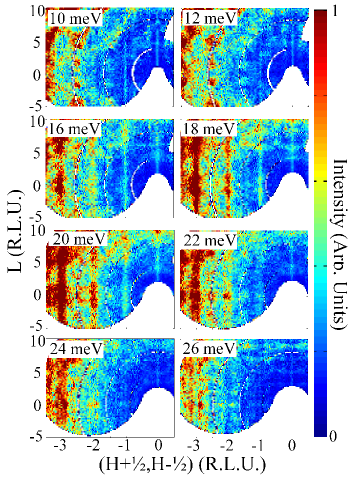
We can also explicitly look at the -dependence of the scattering at equivalent 2DMZCs. Fig. 3 shows another integration of our 4D data set in energy and such that we view reciprocal space maps within the plane. At energies below the spin-phonon crossing, such as 10 and 12 meV, magnetic rods of scattering, indicative of 2D correlations, are identified only at low () and (). Between 16-20 meV, these rods of scattering become stronger and broader within the plane and additional rod-like features appear at equivalent large positions, such as (), similar to the trend seen in Fig. 2. These results show that the inelastic scattering at 2DMZCs between 16 and 20 meV presents as extended rods of scattering along , at both relatively small positions such as (), where it would be expected to be magnetic in origin, and at relatively high positions such as (), where it would be expected to be mainly due to phonons. This suggests a quasi-2D composite spin-phonon excitation, wherein the relevant phonon eigenvectors would couple strongly to the magnetism in LBCO.
III.3 Quantitative Analysis of the Spin-Phonon Crossings and Their Temperature Dependence
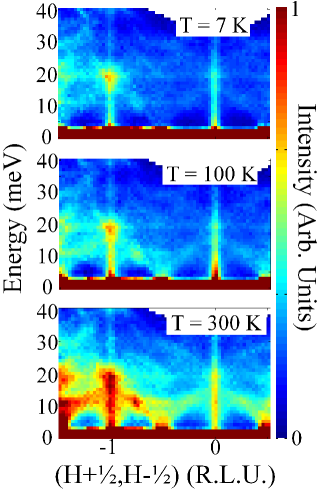
Figure 4, shows the temperature dependence of the energy vs. wave-vector maps over a low subset of the map shown in Fig. 1. Data is shown at three temperatures: 7, 100 and 300 K, located in panels a)-c) respectively. These three data sets have been normalized so as to be on the same intensity scale. Interestingly, the structure of the dynamics does not change significantly upon raising temperature, suggesting that they are independent of the 2D IC ordering temperatures in the system. That said, it is also clear that the scattered intensity increases markedly with temperature. However, this is, to some extent, an expected result, emanating from the temperature dependence of the Bose factor. As will become clear, a quantitative analysis is required to understand the the temperature dependence of the observed spin fluctuations.
A quantitative analysis of the inelastic scattering at and near the 2DMZCs requires a reliable background estimate. We consider two approaches to this issue. One is to estimate the inelastic background from the inelastic scattering at low temperatures and low , both below the dome of scattering formed by the acoustic phonons, as well as away from the 2DMZC. This background estimate should be largely and energy independent and can be subtracted off of the scattered intensity measured as a function of energy at the 2DMZC. Another approach is to use the intensity measured within the basal plane away from the 2DMZC as an energy-dependent background. This energy dependent background method allows us to remove the background as well as any phonon contribution to the scattering with little dispersion and little dependence to their intensity. We relegate the results of this energy-dependent background analysis to our supplemental materialssupplemental . In both methods, we employ an additional set of integrations, which instead of displaying slices of the data, as those shown in Figs. 1-3, yield effective constant energy and constant-Q cuts through the data.
We now analyse the inelastic scattering at the 2DMZC using the background analysis that we described at the beginning of this subsection. As can be seen in Fig. 4, surrounding the () peaks are regions of low scattering intensity, which are bounded by the nearby acoustic phonons. This scattering is largely comprised of incoherent scattering and the sample independent experimental background not captured by the empty cryostat subtraction. We can measure the total background scattering in these four regions by first integrating from -4 4 and -0.1 0.1. To then obtain the background scattering in these four background regions we further integrate in from 0.2 to 0.35 and 0.6 to 0.8. This yields the total background scattering in these four regions, which we note are quantitatively similar to each other. Given this similarity, we average the results from these four integrations together, and make the approximation that this background is a constant for all energies and Q. Our inelastic scattering signal at the 2DMZC is then given by effective constant-Q scans obtained by integrating from -4 to 4 in , -0.1 to 0.1 in and from 0.4 to 0.6 in , which we average over the four () positions and display in Fig. 5 a).
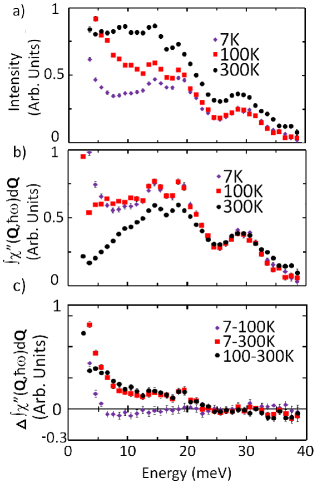
The aforementioned background is then subtracted from this signal to produce the inelastic scattering function, S() shown in Fig. 5 a) for 7, 100, and 300 K. These three temperatures correspond, respectively, to a temperature within the 2D IC AF frozen magnetic state, a temperature above any 2D IC AF magnetic transitions relevant to any doping x and representative of the “pseudogap” phase, and a temperature relevant to 3D C AF magnetic ordering of the parent compound with x = 0, respectively. S(Q,,T) is itself given by the product of the Bose thermal population factor, , which is an analytic function of the ratio of to temperature and enforces detailed balance, and the imaginary part of the dynamic susceptibility, . This latter function is the energy-absorbing part of the dynamic susceptibility. It is an odd function of and contains all the physics of the system of interest. Explicitly,
| (1) |
where
| (2) |
With a robust estimate for the background, and knowing the temperature, it is then straightforward to isolate . In Fig. 5 b) we show the integral in around = (), with the same limits of integration as decribed above for S(Q,,T). Fig. 5 b) then displays this integral of as a function of energy while Fig. 5 c) shows the difference between this integral of for T = 7 and 100 K, for T = 7 and 300 K and for 100 and 300 K. These results show that the strong enhancement in the Q-integral of S(Q,) at 15 meV and 19 meV is also seen in the Q-integral of around = () at T = 7 K.
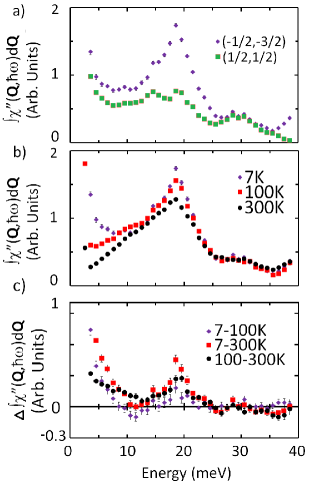
A similar analysis was also carried out for the = (-) 2DMZC, using the same background as for =(). This is shown in Fig. 6, where Fig. 6 a) compares the relevant Q-integrated from = () and = (-). We find that the same enhancement of the inelastic scattering occurs near 15 and 19 meV at T = 7 K at both equivalent 2DMZCs, although the 15 meV enhancement is difficult to resolve when compared to the 19 meV enhancement at (-). Similar to Figs. 5 b) and c), Fig. 6 b) shows the temperature dependence of the -integrated at =(-) as a function of energy while Fig. 6 c) shows the difference between this integral of for T = 7 and 100 K, for T = 7 and 300 K and for 100 and 300 K.
The temperature dependence of the integral of at the =() 2DMZC shown in Fig. 5 is striking, as it shows that all of the difference between this integral at 7 K and 100 K is below 7 meV, while that between either 7 or 100 K and 300 K is below 20 meV. The loss of spectal weight at the 2DMZC on going from the frozen 2D IC magnetic state to the “pseudo-gap” state at 100 K is at low energies, while most of the spectal weight between 7 and 20 meV remains unchanged. Instead, this 7-20 meV spectral weight diminishs on a temperature scale set by TN relevant to the undoped parent compound of LBCO with x = 0. A similar phenomenology is associated with the integral of at the =(-) 2DMZC shown in Fig. 6, although the temperature dependent spectral weight is concentrated more in the 15 - 20 meV regime.
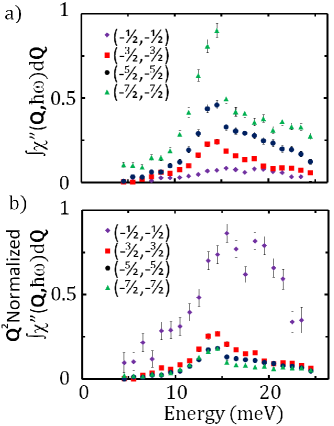
We conclude this section by examining integrals of at wavevectors of the form () with n odd. These are the 2DMZCs such as =() etc. The significance of these 2DMZCs, with = 0 is that the structure factor for all wave-vectors of the form () are identical within the space group. Thus, the inelastic scattering at these positions should scale only as if it is due solely to one phonon creation processes.
Fig. 7 a) shows the integral of at such wave-vectors of the form (), over a small range of about 0, namely -0.5 0.5. This integral of has been corrected for magnetic inelastic scattering at the () positions (whose intensity does not scale as ), by fitting the scattering at low energies (less than 10 meV) and assuming that this magnetic strength falls off as as is expected for spin wavesTranquada_Text . This correction may underestimate the magnetic contibution at low energies, but the net effect is to allow for the 2DMZC with the smallest , (), to go to zero at low energies, as is expected in the absence of magnetic scattering.
Fig. 7 b) shows the same integral of as shown in Fig. 7 a), but now with intensities scaled by . At large , such as () and (), where phonon scattering dominates all inelastic scattering, the integrals overlap very well, as is expected for phonons. However, at (), and, to a considerably lesser extent, (), the data deviates from this scaling. The scattering at the 2DMZCs correponding to the smallest displays inelastic spectral weight that is much stronger than that expected for phonons alone. From this we conclude that there must be a strong enhancement of the inelastic spectral weight between 15 and 20 meV that is not captured either by one phonon scattering processes or spin-waves. This analysis does not eliminate the possibility of a purely magnetic effect. That said, a hybrid spin-phonon origin is more plausible, as the enhanced intensity occurs only at coincidences between dispersive spin excitations at the 2DMZCs and non-dispersive phonons. A related effect appears to occur in superconducting LSCO samplesLipscombe_PRL_2009 . Independent of its origin, the enhancement is clearly a large and significant effect.
III.4 Comparison to Density Functional Theory and Discussion
The analysis pertaining to Figs. 4-7 reveals a consistent picture of robust enhancement of the inelastic spectrum at the low energy spin-phonon crossings. It is therefore important to, at least qualitatively, understand the nature of the relevant phonons involved. To do this, we turn to density functional theory (DFT) appropriate to La2CuO4, whose phonon spectrum should resemble that of LBCO with x = 0.035. Calculations were performed using the density functional perturbation approach as implemented in the mixed-basis pseudopotential frameworkDan_1 ; Dan_2 . The calculation was performed in the tetragonal structure, using the experimental lattice constants for Dan_3 . Internal parameters (z-positions of La and ) were optimized to obtain a force-free geometry. The local density approximation was used in the same parametrization employed in Perdew-Wang’s workDan_4 . The calculated phonon dispersion was obtained by interpolation of dynamical matrices, which were calculated on a 2x2x2 tetragonal mesh. We note that an instability at the M points in the Brillouin zone occurs because the tetragonal structure of pure is not stable at low temperatureZhao_PRB_2007 .
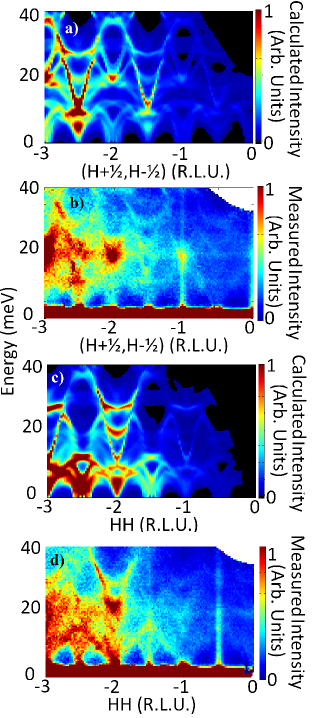
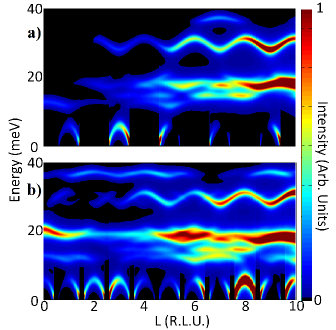
Typical results for these calculations are shown in Fig. 8, where we compare these calculations to their appropriate neutron scattering counterparts. In Fig. 8 a) and c), we show the calculated phonon dispersion and intensities along two parallel wave-vectors: in Fig. 8 a) in Fig. 8 c). These results can be compared with the corresponding neutron scattering data shown in Fig. 8 b) and d). All the panels in Fig. 8 have the same integration in , namely -44, and both the measured and calculated intensities are shown on full intensity scale. To illustrate the phonon dispersion, we have convolved our calculations with a resolution function that is narrower than the experimental resolution. From this, a rather hard comparison between the measured and calculated phonon spectra can be made.
We note that the DFT calculation does not capture any magnetic scattering. This can be readily seen as dispersive spin excitations emanate from the 2DMZCs in the experiment (Fig. 8 b) and d)), but are absent in the calculation (Fig. 8 a) and c)). However the DFT calculation does clearly capture optic phonons that are strong near 19 meV, and disperse upwards and away from the 2DMZCs, as is seen in the experiment. The strongest such optic phonon in the field of view for the direction shown in Figs. 8 a) and b), appears just above 20 meV at (-3,-3) in both the calculation and the experiment. These comparisons between theory and experiment give us confidence that the DFT calculation is capturing many of the key features in the phonon spectrum for LBCO x = 0.035. We can then use these calculations to understand which optic phonons are participating in the strong enhancement to the intensity that we observe at the 2DMZCs shown in Figs. 5-8. We note that at low energies the comparison between calculation and measurement appears less robust. This is caused by a series of phonon branches whose minima occur at less than 0 meV, a consequence of the proximity to a tetragonal to orthorhombic structural transition in this material.
We now consider the energy vs. dependence of the the calculated phonons at two wavevectors considered in this paper. These are the Q = () and () 2DMZCs, shown in Fig. 9 panels a) and b), respectively. At all values of , we observe relatively strong and dispersionless optic phonons near 30, 19 and 15 meV, although the calculated phonon mode with the largest spectral weight and least dispersion is the 19 meV mode. Focusing on the () 2DZMC, which presents the largest normalized enhancements (see Fig. 7), our DFT calculations show that the eigenvector for this 19 meV optic phonon involves atomic displacements that correspond primarily to oxygen displacements within the Cu-O basal plane. Moreover, these displacements do not occur for the oxygen within the La-O layers. Such a phonon eigenvector would be expected to possess a very 2D nature, as the stretching of relatively weak bonds in the third dimension are minimal. A similar case can be made for the nature of the optic phonon near 15 meV and the 2DMZC at (), although the isolation of the precise eigenvector of the 15 meV optic phonon is less robust than is the case for the 19 meV optic phonon.
These results strongly suggest that the large enhancements in the spectral weight observed at the 2DMZCs and near 15 and 19 meV in LBCO with x = 0.035 result from the confluence of quasi-2D spin fluctuations with quasi-2D optic phonons at the same 2D wave-vectors. As shown in Fig. 7, it is primarily the lowest 2DMZC whose intensity deviates most from the dependence of the scattered intensity seen at higher . Therefore, a possible explanation for the origin of this strong enhancement is hybridization between the quasi-2D spin fluctuations and quasi-2D phonons. Such an interpretation would be natural as the atomic displacements involved in the quasi-2D optic phonons are such that Cu-O-Cu bonds are stretched and distorted. Such distortions affect the nature of the strongest Cu-Cu superexchange pathways in the LBCO system. Independent of the precise origin of this resonant enhancement of the inelastic spectrum in LBCO, it is clear that the energy scale of these effects, which is 200 K, is large and large enough to play a role in the mechanism underlying high temperature superconductivity which occurs on the same temperature scale. However, any firm connection to superconductivity is lacking at present.
IV Conclusions
To conclude, comprehensive time-of-flight neutron scattering measurements have observed rich structure in the energy dependence of the inelastic scattering at 2DMZCs, in particular at those at the lowest-, such as (). This structure presents in the form of strong enhancements of the spectral weight at several crossings of highly dispersive spin excitations with relatively dispersionless phonons in LBCO with x = 0.035. The measured enhancements are large and account for as much as 25 of the spectral weight between 5 and 40 meV at the lowest- 2DMZC.
Modeling the phonons in La2CuO4 with density functional theory allowed us to identify the likely eigenvectors associated with the optic phonons involved in the enhancements. These phonon modes appear to be quasi-2D themselves, with appropriate atomic displacements that could affect the strongest Cu-O-Cu superexchange pathways.
This robust structure within the excitation spectrum at the 2DMZCs in LBCO appears on a high energy scale and therefore is of potential relevance to high temperature superconductivity itself. While the current study was carried out on a non-superconducting sample, both the quasi-2D spin fluctuations and the nature of the phonon spectrum for this material family should be slowly varying as a function of doping. We also note that superconducting ground states in LBCO form for x 0.05, which is only a modest change in x from the present sample. Therefore, the reported energy dependence in the 2DMZC spectral weight, resulting from a confluence of quasi-2D spin fluctuations and quasi-2D optic phonons, is likely a common feature for a broad range of concentrations relevant to superconductivity in the LBCO system.
V Acknowledgements
We would like to acknowledge useful conversations had with T. Timusk, J. P. Carbotte, I. A. Zaliznyak, J. M. Tranquada, G. E. Granroth, S. A. Kivelson, S. D. Wilson, N. B. Christensen, J. Gaudet, B. Jackel and J. L. Niedziela. Research at ORNL’s Spallation Neutron Source was sponsored by the Scientific User Facilities Division, Office of Basic Energy Sciences, U.S. Department of Energy. This work was supported by NSERC of Canada.
References
- [1] J.G. Bednorz and K.A. Muller. Z. Phys. B., 64(189), 1986.
- [2] T. Timusk and B. Statt. Rep. Prog. Phys, 62:61, 1999.
- [3] M. Fujita, H. Hiraka, M. Matsuda, M. Matsuura, J. M. Tranquada, S. Wakimoto, G. Xu, and K. Yamada. Journal of the Physical Society of Japan, 81(1):011007, 2012.
- [4] R. J. Birgeneau, C. Stock, J. M. Tranquada, and K. Yamada. Journal of the Physical Society of Japan, 75(11):111003, 2006.
- [5] M. A. Kastner, R. J. Birgeneau, G. Shirane, and Y. Endoh. Rev. Mod. Phys., 70:897–928, 1998.
- [6] B. Keimer, N. Belk, R. J. Birgeneau, A. Cassanho, C. Y. Chen, M. Greven, M. A. Kastner, A. Aharony, Y. Endoh, R. W. Erwin, and G. Shirane. Phys. Rev. B, 46(21):14034–14053, 1992.
- [7] J. J. Wagman, G. Van Gastel, K. A. Ross, Z. Yamani, Y. Zhao, Y. Qiu, J. R. D. Copley, A. B. Kallin, E. Mazurek, J. P. Carlo, H. A. Dabkowska, and B. D. Gaulin. Phys. Rev. B, 88:014412, 2013.
- [8] N. Doiron-Leyraud, C. Proust, D. Leboeuf, J. Levallois, J.-B. Bonnemaison, R. Liang, D. A. Bonn, W. N. Hardy, and L. Taillefer. Nature (London), 447:565–568, 2007.
- [9] C. Stock, W. J. L. Buyers, Z. Yamani, Z. Tun, R. J. Birgeneau, R. Liang, D. Bonn, and W. N. Hardy. Phys. Rev. B, 77(10):104513, 2008.
- [10] M. Enoki, M. Fujita, T. Nishizaki, S. Iikubo, D. K. Singh, S. Chang, J. M. Tranquada, and K. Yamada. Phys. Rev. Lett., 110:017004, 2013.
- [11] N. P. Armitage, P. Fournier, and R. L. Greene. Rev. Mod. Phys., 82:2421–2487, 2010.
- [12] L. Taillefer. Annual Review of Condensed Matter Physics, 1:51–70, 2010.
- [13] S. Sachdev, M. A. Metlitski, and M. Punk. Journal of Physics: Condensed Matter, 24(29):294205, 2012.
- [14] S. A. Kivelson, I. P. Bindloss, E. Fradkin, V. Oganesyan, J. M. Tranquada, A. Kapitulnik, and C. Howald. Rev. Mod. Phys., 75(4):1201–1241, 2003.
- [15] B. Lake, H. M. Runnow, N. B. Christensen, G. Aeppli, K. Lefmann, D. F. McMorrow, P. Vorderwisch, P. Smeibidl, N. Mangkorntong, T. Sasagawa, M. Nohara, H. Takagi, and T. E. Mason. Nature, 415:299, 2002.
- [16] S. M. Hayden, G. Aeppli, T. G. Perring, H. A. Mook, and F. Doğan. Phys. Rev. B, 54:R6905, Sep 1996.
- [17] M. Matsuda, M. Fujita, S. Wakimoto, J. A. Fernandez-Baca, J. M. Tranquada, and K. Yamada. Phys. Rev. Lett., 101(19):197001, 2008.
- [18] R. Coldea, S. M. Hayden, G. Aeppli, T. G. Perring, C. D. Frost, T. E. Mason, S.-W. Cheong, and Z. Fisk. Phys. Rev. Lett., 86:5377–5380, 2001.
- [19] N. S. Headings, S. M. Hayden, R. Coldea, and T. G. Perring. Phys. Rev. Lett., 105:247001, 2010.
- [20] J. M. Tranquada, H. Woo, T. G. Perring, H. Goka, G. D. Gu, G. Xu, M. Fujita, and K. Yamada. Nature (London), 429:534–538, 2004.
- [21] S. M. Hayden, G. Aeppli, H. A. Mook, T. G. Perring, T. E. Mason, S.-W. Cheong, and Z. Fisk. Phys. Rev. Lett., 76:1344–1347, 1996.
- [22] K. Machida and M. Ichioka. Journal of the Physical Society of Japan, 68:2168–2171, 1999.
- [23] M. Matsuda, G. E. Granroth, M. Fujita, K. Yamada, and J. M. Tranquada. Phys. Rev. B, 87:054508, 2013.
- [24] N. B. Christensen, D. F. McMorrow, H. M. Rønnow, B. Lake, S. M. Hayden, G. Aeppli, T. G. Perring, M. Mangkorntong, M. Nohara, and H. Takagi. Phys. Rev. Lett., 93:147002, 2004.
- [25] O. J. Lipscombe, B. Vignolle, T. G. Perring, C. D. Frost, and S. M. Hayden. Phys. Rev. Lett., 102(16):167002, 2009.
- [26] B. Vignolle, S.M. Hayden, D.F. McMorrow, H.M. Ronnow, B. Lake, C.D. Frost, and T.G. Perring. Nature (London), pages 163–167, 2007.
- [27] Z. Xu, C. Stock, S. Chi, A. I. Koleshnikov, G. Xu, G. D. Gu, and J. M. Tranquada. arxiv:1309.2718, 2013.
- [28] S. D. Wilson, Z. Yamani, C. Dhital, B. Freelon, P. G. Freeman, J. A. Fernandez-Baca, K. Yamada, S. Wakimoto, W. J. L. Buyers, and R. J. Birgeneau. Phys. Rev. B, 85:014507, 2012.
- [29] M. Matsuura, M. Fujita, H. Hiraka, M. Kofu, H. Kimura, S. Wakimoto, T. G. Perring, C. D. Frost, and K. Yamada. Phys. Rev. B, 86:134529, 2012.
- [30] C. Stock, W. J. L. Buyers, R. Liang, D. Peets, Z. Tun, D. Bonn, W. N. Hardy, and R. J. Birgeneau. Phys. Rev. B, 69:014502, 2004.
- [31] Y. Li, G. Yu, M. K. Chan, V. Valedent, N. Li, Y. Barisic, X. Zhao, K. Hradil, R. A. Mole, Y. Sidis, P. Steffens, P. Bourches, and M. Greven. Nature Physics, 8:404, 2012.
- [32] M. Fujita, K. Yamada, H. Hiraka, P. M. Gehring, S. H. Lee, S. Wakimoto, and G. Shirane. Phys. Rev. B, 65(6):064505, 2002.
- [33] S. R. Dunsiger, Y. Zhao, B. D. Gaulin, Y. Qiu, P. Bourges, Y. Sidis, J. R. D. Copley, A. Kallin, E. M. Mazurek, and H. A. Dabkowska. Phys. Rev. B, 78(9):092507, 2008.
- [34] Y. Zhao, B. D. Gaulin, J. P. Castellan, J. P. C. Ruff, S. R. Dunsiger, G. D. Gu, and H. A. Dabkowska. Phys. Rev. B, 76(18):184121, 2007.
- [35] J. D. Axe, A. H. Moudden, D. Hohlwein, D. E. Cox, K. M. Mohanty, A. R. Moodenbaugh, and Youwen Xu. Phys. Rev. Lett., 62(23):2751–2754, 1989.
- [36] S. Katano, J. A. Fernandez-Baca, S. Funahashi, N. Mori, Y. Ueda, and K. Koga. Physica C, 214:64 – 72, 1993.
- [37] Chul-Ho Lee, Kazuyoshi Yamada, Yasuo Endoh, Gen Shirane, R. J. Birgeneau, M. A. Kastner, M. Greven, and Y-J. Kim. Journal of the Physical Society of Japan, 69(4):1170–1176, 2000.
- [38] D. L. Abernathy, M. B. Stone, M. J. Loguillo, M. S. Lucas, O. Delaire, X. Tang, J. Y. Y. Lin, and B. Fultz. Review of Scientific Instruments, 83, 2012.
- [39] O. Arnold, J.C. Bilheux, J.M. Borreguero, A. Buts, S.I. Campbell, L. Chapon, M. Doucet, N. Draper, R. Ferraz Leal, M.A. Gigg, V.E. Lynch, A. Markvardsen, D.J. Mikkelson, R.L. Mikkelson, R. Miller, K. Palmen, P. Parker, G. Passos, T.G. Perring, P.F. Peterson, S. Ren, M.A. Reuter, A.T. Savici, J.W. Taylor, R.J. Taylor, R. Tolchenov, W. Zhou, and J. Zikovsky. Nuclear Instruments and Methods in Physics Research Section A: Accelerators, Spectrometers, Detectors and Associated Equipment, 764:156, 2014.
- [40] .
- [41] See Supplemental Material at [URL to be input by publisher] for a discussion of the strength and form of empty can background scattering, and the results of an energy-dependent background subtraction analysis.
- [42] G. L. Squires. “Introduction to the Theory of Thermal Neutron Scattering”. Dover Publications, 1978.
- [43] G. Shirane, S. M. Shapiro, and J. M. Tranquada. “Neutron Scattering with a Triple-Axis Spectrometer”. Cambridge University Press, 2002.
- [44] B. Meyer, C. Elsässer, and M. Fähnle. Unpublished.
- [45] R. Heid and K.-P Bohnen. Phys. Rev. B, 60:R3709, 1992.
- [46] P. G. Radaelli, D. G. Hinks, A. W. Mitchell, B. A. Hunter, J. L. Wagner, B. Dabrowski, K. G. Vandervoort, H. K. Viswanathan, and J. D. Jorgensen. Phys. Rev. B, 49:4163, Feb 1994.
- [47] J. P. Perdew and Y. Wang. Phys. Rev. B, 45:13244, 1992.