A Possible Extension of the Scutum-Centaurus Arm into the Outer Second Quadrant
Abstract
Combining HI data from the Canadian Galactic Plane Survey (CGPS) and CO data from the Milky Way Imaging Scroll Painting (MWISP) project, we have identified a new segment of a spiral arm between Galactocentric radii of 15 and 19 kpc that apparently lies beyond the Outer Arm in the second Galactic quadrant. Over most of its length, the arm is 400-600 pc thick in . The new arm appears to be the extension of the distant arm recently discovered by Dame & Thaddeus (2011) as well as the ScutumCentaurus Arm into the outer second quadrant. Our current survey identified a total of 72 molecular clouds with masses on the order of 102-104M☉ that probably lie in the new arm. When all of the available data from the CO molecular clouds are fit, the bestfitting spiral model gives a pitch angle of 9.3∘ 0.7∘.
1 Introduction
Our knowledge of the outer Galaxy to date is largely dependent on HI emission surveys. The 21cm line observations outline a spiral structure out to at least 25 kpc, implying a minimum radius for the gas disk (Levine et al., 2006). Through the International Galactic Plane Survey (IGPS), a widespread presence of cool HI (traced by HI absorption) was found between Galactocentric radii of 12 and 25 kpc (Strasser et al., 2007). It was not until 2011, however, that a segment of a spiral arm at radii of 15 kpc was identified by Dame & Thaddeus (2011) beyond the Outer Arm in the first Galactic quadrant. This was accomplished by using the Leiden/Argentine/Bonn (LAB) 21cm survey (Kalberla et al., 2005), and new CO observations with the 1.2 m telescope at the Harvard-Smithsonian Center for Astrophysics (CfA).
Because of the far distances involved, high-sensitivity CO observations are essential for delineating spiral structures in the extreme outer Galaxy. Digel et al. (1994) were the first to detect molecular clouds in this region. Due to the relatively low sensitivity of the Five College Radio Astronomy Observatory (FCRAO) CO survey (Heyer et al., 1998), only a few bright molecular clouds were identified there (Kerton & Brunt, 2003). Until now, no coherent, large-scale structures beyond the Outer Arm have been identified in the second quadrant.
We have carried out large-scale CO mapping in the second quadrant of the Galactic plane, which is part of the Milky Way Imaging Scroll Painting (MWISP) Project111http://www.radioast.nsdc.cn/yhhjindex.php. One of the goals of this project is to probe the spiral structures further than the Outer Arm. This mapping has completely covered the regions between 120 and -2.25, and between 144 and -3.75. In the longitude range of 100∘ to 120∘, the observations so far were guided by the latitude distribution of extreme outer molecular clouds previously reported by Brunt et al. (2003) and Kerton & Brunt (2003), rather than an unbiased survey.
2 CO observations and Archival Data of atomic hydrogen
2.1 CO observations
The observations were conducted during 2011 and 2014 using the 13.7-m telescope of the Purple Mountain Observatory (PMO) in Delingha, China. The receiver was the newly installed Superconducting Spectroscopic Array Receiver (SSAR; Shan et al., 2012). All observations were carried out in “on-the-fly” (OTF) mode. The 12CO, 13CO and C18O lines were observed simultaneously.
At 115 GHz, the main beam width was about 52, and the main beam efficiencies () were 0.46 for 12CO and 0.43 for 13CO and C18O. The typical rms noise level was 0.5 K for 12CO and 0.3 K for 13CO and C18O, corresponding to a channel width of 0.16 km s-1. All of the spectral data were processed using the GILDAS package. It should be noted that any results presented in the figures and tables are on the brightness temperature scale (T), corrected for beam efficiencies using Tmb=T/. Details on the observations, data collection, and data processing steps will be presented in Sun et al. (2014, in prep.).
2.2 Archival Data of atomic hydrogen
The 21-cm line data were retrieved from the Canadian Galactic Plane Survey (CGPS; Taylor et al., 2003), covering Galactic longitudes from = 63∘ to 175∘ and latitudes from = -3.5∘ to +5.5∘, and a latitude extension to = +17.5∘ between = 100∘ to 116.5∘. The velocity coverage of the data is in the range of -153 to 40 km s-1 with a channel separation of 0.82 km s-1. The survey has a spatial resolution of 58 which is comparable to our CO observations.
3 Results and Discussion
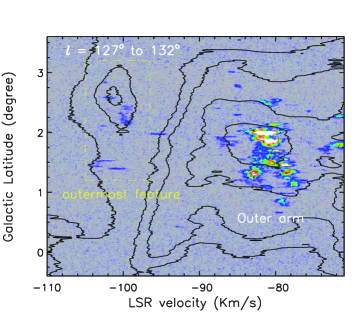
We created maps of the HI emission in the CGPS (66∘150∘) and the CO emission in the MWISP (100∘150∘), by obtaining average emissions over a 5∘ wide window in longitude. The data of the CGPS in the range of 150175∘ were excluded from this analysis because of the degeneracy of the radial velocity. The Outer Arm has been widely accepted as the outermost arm in the second quadrant (Russeil, 2003; Russeil et al., 2007). However, all maps reveal a clear and distinct feature distributed beyond the Outer Arm at a maximum negative velocity. This outermost feature varies in latitude and velocity. In Figure 1, we show one of these distributions from both the CO (image) and the HI (contours) emissions in longitude from 127∘ to 132∘. The Outer Arm and the outermost feature are clearly seen as strong, separate features.
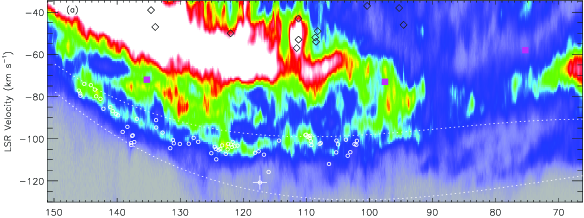
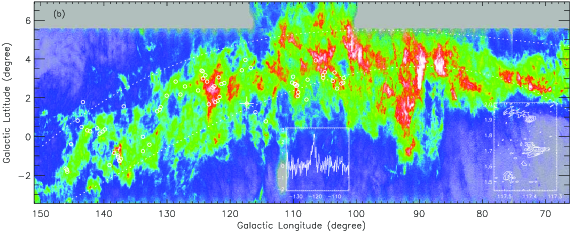
To highlight the outermost feature, a map of integrated HI emission over a window that follows the feature in latitude is shown in Figure 2a. The high-mass star forming regions (HMSFRs) assigned to the Outer and Perseus Arms are marked with squares and diamonds, respectively (Reid et al., 2014). Similarly, Figure 2b focuses on the outermost feature, obtained by integrating the HI emission over a window that follows the feature in velocity. It is worth noting that at large negative velocities, the HI emission forms an arc from 75∘, 3∘, -110 km s-1, through 110∘, 3.5∘, -105 km s-1, to 150∘, -2∘, -70 km s-1, running roughly parallel to the locus of the Outer Arm but shifted by 20-30 km s-1 to more negative velocities. This suggests that it may be a segment of a major spiral arm since spiral arms have long been recognized as presenting coherent arcs and loops in Galactic plots of atomic and molecular emissions (Weaver, 1974; Dame et al., 1986; Dame & Thaddeus, 2008, 2011). The present feature was largely overlooked in the past since only short segments of it appear in l-v diagrams at any specific latitude or even in an l-v diagram integrated over all latitudes covered by the CGPS (e.g., in Figure 3 of Strasser et al., 2007).
Before giving an explicit claim of a new spiral arm, we investigated the characteristics of the outermost feature in more detail. So far a total of 72 molecular clouds that are probably attributed to the outermost feature were detected by MWISP. These 72 clouds are marked with circles in Figures 2 and 3 and also summarized in Table 1. More than 10 clouds show clear 13CO detections while many of other clouds were only marginally detected. However, none of them show C18O detections. The isotope abundance ratios in the extreme outer Galaxy will be studied in the forthcoming deep observations. Actually, all known clouds in the extreme outer Galaxy reported by Digel et al. (1994) and Kerton & Brunt (2003) were detected by the present survey. We labelled all these known clouds in column (1) of Table 1. Note that the clouds reported by Digel et al. (1994) in the higher longitude range of 145151∘ are not included in Table 1, since these clouds are partially blended in velocity with emission at less negative velocities. Besides, they might lie in the Outer arm or in the inter-arm on the assumption of the rotation curve of Reid et al. (2014).
Most of the clouds are newly discovered, which suggests that we may still miss some molecular clouds in the interval 100120∘ due to the narrow latitude coverage. The derived masses, mainly on the order of 103M☉ to 104M☉, fall in the typical range for the masses of molecular clouds that are usually confined to spiral arms. Note that the mass is a lower limit, since the adopted CO-to-H2 X factor 1.81020 cm-2 is measured in the solar neighborhood. However, a recent study suggested that the X factor rises by a factor of 23 between the solar circle and the circle at =14 kpc (Abdo et al., 2010). In addition, the beam dilution effects lower the signal-to-noise ratio and hence also reduce the derived masses. We have selected one example with the largest negative velocities we recently detected (molecular cloud 24 marked with cross) and presented the velocity-integrated intensity and spectrum of the peak emission in Figure 2b. Although these molecular clouds are more sparsely distributed than the atomic gas, both explicitly trace the same coherent, large-scale structure, i.e., the new arm well.
The warp of the Galactic disk is obvious (Figure 2b), which exhibits a clear positive warp between = 66∘ and 135∘, and a negative warp between = 135∘ to 150∘. Assuming a mean distance of 12 Kpc, the new arm with thickness in of about 2∘ to 3∘ correspond to about 400 to 600 pc. Generally, the new arm is more severely warped and thicker than the Outer Arm. This is in good agreement with the theory for both external spiral galaxies and our Galaxy, which suggests that the warping and thicknesses of the disks increase with increasing distance from the galactic center (Wouterloot et al., 1990; Russeil, 2003; Bottema, 1996). Moreover, the new arm is distinct from the Outer Arm with a spatial separation of about 34 kpc, which is consistent with the typical span of the spiral arms outside the Perseus Arm (Reid et al., 2014; Vallée, 2014).
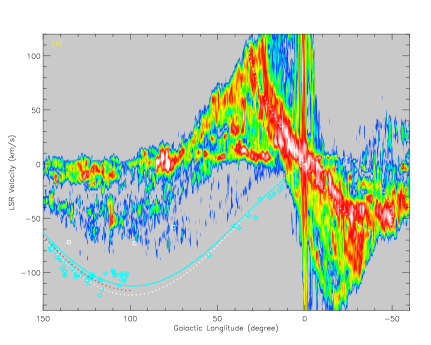
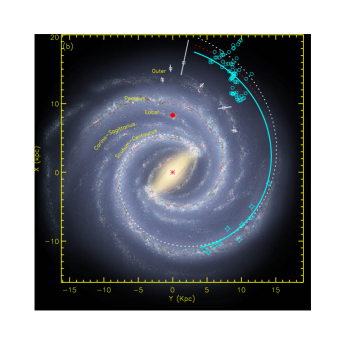
Locations of all available molecular clouds in the far outer Galaxy are compared with the spiral arm model in Figure 3, superposed on: (a) CO diagram from Dame et al. (2001), and (b) an artist’s conception of the Milky Way (R. Hurt: NASA/JPL-Caltech/SSC). The artist’s image has been scaled to place the HMSFRs in the spiral arms. These clouds are indicated by filled stars, triangles and circles, which cover Galactic longitudes from =13∘ to 55∘ detected by Dame & Thaddeus (2011), and from =100∘ to 150∘ detected by us. The squares indicate the locations of the HMSFRs associated with the Outer Arm (Reid et al., 2014). The white dashed line in Figure 3 is a log spiral that was fit to the Scutum-Centaurus arm in the inner Galaxy (Vallée, 2008, 2014). Generally, our data are in agreement with the far-extension of the Scutum-Centaurus Arm in the second quadrant. However, confirmation of this hypothesis would be a challenge as suggested by Dame & Thaddeus (2011).
We attempted to fit the distribution of these outermost clouds, adopting a logperiodic spiral model defined by , where is the Galactocentric radius at a Galactocentric azimuth for an arm with a radius at reference azimuth and pitch angle . The Bayesian Markov chain Monte Carlo (McMC) procedure was adopted to estimate the parameters and (see paper of Reid et al. (2014) for more details). The bestfitting spiral model for the CO data on the interval 120150∘ is = 17.81.0 kpc at = 27.0∘ and = 10.8∘ 7.6∘ (indicated by the red dashed line in Figure 3). The bestfitting spiral model for all of the available CO data including clouds detected by Dame & Thaddeus (2011) is = 16.11.0 kpc at = 43.9∘ and = 9.3∘ 0.7∘ (indicated by the cyan solid line in Figure 3). The uncertainties give a 68% confidence range.
The consistent fitting results confirm that the new arm can be interpreted as the far-extension of the distant arm recently discovered by Dame & Thaddeus (2011). Apparently, both models fit the data well over a wide longitude range, except in =100∘ to 116∘, where the model deviates from the data. Such departures might be caused by the kinematic distance uncertainty. Indeed, any systematic velocity departures can lead to distance uncertainty. The velocity departures, including both positive and negative values have already been observed, e.g., in the Perseus Arm between 90∘ and 150∘ and the Sagittarius-Carina Arm (Russeil, 2003). Another possibility is the bias introduced by the incompleteness of the sample due to the narrow latitude coverage in this longitude interval, as mentioned above. The parallax measurements and MWISP projects in progress will be required to solve the problem and determine the new arm more accurately.
We are grateful to all of the staff of the 14-m telescope of the PMO for their dedicated assistance. We would like to thank Dr. Mark Reid for using of his fitting procedure. We thank Dr. Yuan-Wei Wu for his useful discussions. We also thank the anonymous referee for very helpful suggestions and comments that help improved the paper. Research for this project is supported by the National Natural Science Foundation of China (grant Nos. 11003046, 11233007, 11133008, 11403104), the Strategic Priority Research Program of the Chinese Academy of Sciences (grant No. XDB09000000), and the Key Laboratory for Radio Astronomy, CAS.
References
- Abdo et al. (2010) Abdo, A. A. et al. 2010, ApJ, 710, 133
- Brand & Wouterloot (1994) Brand, J., & Wouterloot, J. G. A. 1994, A&AS, 103, 503
- Bottema (1996) Bottema, R. 1996, A&A, 306, 345
- Brunt et al. (2003) Brunt, C. M., Kerton, C. R., Pomerleau, C. ., & Thaddeus, P. 1985, ApJ, 297, 751
- Dame et al. (1986) Dame, T. M., Elmegreen, B. G., Cohen, R. S., & Thaddeus, P. 1986, ApJ, 305, 892
- Dame et al. (1987) Dame, T. M. et al. 1987, ApJ, 322, 706
- Dame et al. (2001) Dame, T. M., Hartmann, D., Thaddeus, P. 2001, ApJ, 547, 792
- Dame & Thaddeus (2008) Dame, T. M., & Thaddeus, P. 2008, ApJ, 683L, 143
- Dame & Thaddeus (2011) Dame, T. M., & Thaddeus, P. 2011, ApJ, 734L, 24
- Digel et al. (1994) Digel, S., de Geus, E., & Thaddeus, P. 1994, ApJ, 422, 92
- Heyer et al. (1998) Heyer, M. H., Brunt, C., Snell, R. L., Howe, J. E., Schloerb, F. P., & Carpenter, J. M. 1998, ApJS, 115, 241
- Kalberla et al. (2005) Kalberla, P. M. W., Burton, W. B., Hartmann, D., Arnal, E. M., Bajaja, E., Morras, R., Pöppel, W. G. L. 2005, A&A, 440, 775
- Kerton & Brunt (2003) Kerton, C. R., & Brunt, C. M. 2003, A&A, 399, 1083
- Levine et al. (2006) Levine, E. S., Blitz, L., Heiles, C. 2006, Science, 312, 1773
- Reid et al. (2014) Reid, M. J. et al. 2014, ApJ, 783, 130
- Russeil (2003) Russeil, D., 2003, A&A, 397, 133
- Russeil et al. (2007) Russeil, D., Adami, C., Georgelin, Y. M., 2007, A&A, 470, 161
- Shan et al. (2012) Shan, W., Yang, J., Shi, S., et al. 2012, IEEE Trans. Terahertz Sci. Technol., 2, 593
- Strasser et al. (2007) Strasser, S. T. et al. 2007, AJ, 134, 2252
- Sun et al. (2014) Sun et al. 2014, in prep.
- Taylor et al. (2003) Taylor et al. 2003, AJ, 125, 3145
- Weaver (1974) Weaver, H. 1974, IAUS, 60, 573
- Wouterloot et al. (1990) Wouterloot, J. G. A., Brand, J., Burton, W. B., Kwee, K. K., 1990, A&A, 230, 21
- Vallée (2008) Vallée, J. P., 2008, AJ, 135, 1301
- Vallée (2014) Vallée, J. P., 2014, AJ, 148, 5
| Number | area | scale | radius | Mass | ||||||||
|---|---|---|---|---|---|---|---|---|---|---|---|---|
| () | () | (km s-1) | (K) | (km s-1) | (K.km s-1) | (arcmin2) | (kpc) | (kpc) | (kpc) | (pc) | (103M☉) | |
| (1) | (2) | (3) | (4) | (5) | (6) | (7) | (8) | (9) | (10) | (11) | (12) | (13) |
| 1 | 101.992 | 3.016 | -101.0 | 3.0 | 3.3 | 10.4 | 39.4 | 9.8 | 14.2 | 0.5 | 10.1 | 13.0 |
| 2 | 102.092 | 2.776 | -102.9 | 3.5 | 2.4 | 8.9 | 13.4 | 10.1 | 14.4 | 0.5 | 5.9 | 3.9 |
| 3 | 102.375 | 2.733 | -102.6 | 4.6 | 1.3 | 6.2 | 29.0 | 10.0 | 14.4 | 0.5 | 8.8 | 5.9 |
| 4 | 103.042 | 2.475 | -106.4 | 2.5 | 1.2 | 3.3 | 3.2 | 10.5 | 14.8 | 0.5 | 2.8 | 0.3 |
| 5 | 103.458 | 3.300 | -108.1 | 3.0 | 0.9 | 2.8 | 3.7 | 10.7 | 15.0 | 0.6 | 3.1 | 0.3 |
| 6 | 103.729 | 2.867 | -100.5 | 3.2 | 1.8 | 6.1 | 6.5 | 9.7 | 14.2 | 0.5 | 3.9 | 1.1 |
| 7* | 104.983 | 3.317 | -102.7 | 5.8 | 1.9 | 11.4 | 36.2 | 9.9 | 14.5 | 0.6 | 9.7 | 13.1 |
| 8* | 105.242 | 3.025 | -100.9 | 4.0 | 1.7 | 7.5 | 37.5 | 9.6 | 14.3 | 0.5 | 9.6 | 8.5 |
| 9 | 105.283 | 3.175 | -106.5 | 3.9 | 2.0 | 8.1 | 5.6 | 10.4 | 15.0 | 0.6 | 3.8 | 1.5 |
| 10 | 106.417 | 3.925 | -112.0 | 1.5 | 1.1 | 3.2 | 18.3 | 11.1 | 15.7 | 0.8 | 7.6 | 2.3 |
| 11* | 107.725 | 2.933 | -102.1 | 2.5 | 1.8 | 4.8 | 27.5 | 9.7 | 14.6 | 0.5 | 8.2 | 4.0 |
| 12 | 107.900 | 1.908 | -102.5 | 1.8 | 2.4 | 4.5 | 10.9 | 9.7 | 14.7 | 0.3 | 5.1 | 1.5 |
| 13 | 109.200 | 2.283 | -103.0 | 4.3 | 0.7 | 3.4 | 5.9 | 9.8 | 14.8 | 0.4 | 3.7 | 0.6 |
| 14* | 109.292 | 2.083 | -101.2 | 5.2 | 2.1 | 11.5 | 22.1 | 9.5 | 14.6 | 0.3 | 7.3 | 7.5 |
| 15* | 109.375 | 2.642 | -98.6 | 3.6 | 1.5 | 5.9 | 11.9 | 9.2 | 14.3 | 0.4 | 5.1 | 1.9 |
| 16* | 109.500 | 2.608 | -99.6 | 4.5 | 1.5 | 7.4 | 55.8 | 9.3 | 14.5 | 0.4 | 11.3 | 11.7 |
| 17* | 109.642 | 2.700 | -98.8 | 4.8 | 1.8 | 9.1 | 40.8 | 9.2 | 14.4 | 0.4 | 9.6 | 10.3 |
| 18* | 109.790 | 2.717 | -99.2 | 5.8 | 1.7 | 10.3 | 21.9 | 9.2 | 14.4 | 0.4 | 7.0 | 6.2 |
| 19 | 110.025 | 3.083 | -98.1 | 3.3 | 0.8 | 2.9 | 22.5 | 9.1 | 14.3 | 0.5 | 7.0 | 1.7 |
| 20 | 110.167 | 2.783 | -98.3 | 3.2 | 1.0 | 3.3 | 8.1 | 9.1 | 14.4 | 0.4 | 4.1 | 0.7 |
| 21* | 114.342 | 0.781 | -100.9 | 7.9 | 2.1 | 18.0 | 113.7 | 9.5 | 15.0 | 0.1 | 16.5 | 60.5 |
| 22 | 115.992 | 1.250 | -115.8 | 2.4 | 1.1 | 2.6 | 6.2 | 11.9 | 17.3 | 0.3 | 4.7 | 0.7 |
| 23* | 116.725 | 3.542 | -107.6 | 5.5 | 1.9 | 11.3 | 22.8 | 10.5 | 16.1 | 0.6 | 8.1 | 9.2 |
| 24 | 117.367 | 1.700 | -120.8 | 2.1 | 2.3 | 5.1 | 83.7 | 13.0 | 18.4 | 0.4 | 19.5 | 23.8 |
| 25* | 117.576 | 3.950 | -106.0 | 5.9 | 1.2 | 7.7 | 18.7 | 10.3 | 16.0 | 0.7 | 7.2 | 4.9 |
| 26* | 118.143 | 3.417 | -106.7 | 2.8 | 1.6 | 4.9 | 18.1 | 10.4 | 16.2 | 0.6 | 7.2 | 3.1 |
| 27 | 120.925 | 2.758 | -103.3 | 2.8 | 1.6 | 4.8 | 6.3 | 10.1 | 16.1 | 0.5 | 4.0 | 0.9 |
| 28 | 121.375 | 2.708 | -103.6 | 2.3 | 0.9 | 2.4 | 22.2 | 10.2 | 16.2 | 0.5 | 7.8 | 1.8 |
| 29* | 121.675 | 2.042 | -101.5 | 2.6 | 1.4 | 3.9 | 32.7 | 9.9 | 16.0 | 0.4 | 9.2 | 4.1 |
| 30* | 121.817 | 3.052 | -103.9 | 5.6 | 2.3 | 13.7 | 78.7 | 10.3 | 16.4 | 0.5 | 14.9 | 37.6 |
| 31 | 121.967 | 1.842 | -102.8 | 2.5 | 1.1 | 3.0 | 25.9 | 10.1 | 16.2 | 0.3 | 8.4 | 2.6 |
| 32* | 122.375 | 1.775 | -102.5 | 3.0 | 1.2 | 3.9 | 70.0 | 10.1 | 16.3 | 0.3 | 13.9 | 9.2 |
| 33 | 122.492 | 2.592 | -105.1 | 2.4 | 1.4 | 3.5 | 31.5 | 10.6 | 16.7 | 0.5 | 9.7 | 4.0 |
| 34* | 122.775 | 2.522 | -107.2 | 5.5 | 2.2 | 12.8 | 91.8 | 11.0 | 17.1 | 0.5 | 17.3 | 47.0 |
| 35* | 123.367 | 1.659 | -103.2 | 2.6 | 2.3 | 6.5 | 66.0 | 10.4 | 16.5 | 0.3 | 13.8 | 15.2 |
| 36 | 123.650 | 2.833 | -104.9 | 3.1 | 1.1 | 3.6 | 35.5 | 10.7 | 16.9 | 0.5 | 10.4 | 4.8 |
| 37 | 123.925 | 3.158 | -105.4 | 2.9 | 1.1 | 3.2 | 13.6 | 10.8 | 17.0 | 0.6 | 6.4 | 1.6 |
| 38 | 124.292 | 3.000 | -109.8 | 1.9 | 1.8 | 3.6 | 15.1 | 11.7 | 17.9 | 0.6 | 7.4 | 2.4 |
| 39 | 124.342 | 3.367 | -104.9 | 1.8 | 1.4 | 2.8 | 8.7 | 10.8 | 17.0 | 0.6 | 5.1 | 0.9 |
| 40 | 124.525 | 3.400 | -103.9 | 2.7 | 0.8 | 2.3 | 15.3 | 10.6 | 16.8 | 0.6 | 6.7 | 1.3 |
| 41 | 125.075 | 2.375 | -106.9 | 1.7 | 2.1 | 3.9 | 41.4 | 11.3 | 17.5 | 0.5 | 11.9 | 6.8 |
| 42 | 127.150 | 2.583 | -101.5 | 2.1 | 1.4 | 3.1 | 35.0 | 10.6 | 17.0 | 0.5 | 10.2 | 4.0 |
| 43* | 127.875 | 2.167 | -99.6 | 2.4 | 2.0 | 4.9 | 81.0 | 10.4 | 16.9 | 0.4 | 15.3 | 14.1 |
| 44 | 128.633 | 2.833 | -102.4 | 2.2 | 0.9 | 2.2 | 8.0 | 11.1 | 17.6 | 0.5 | 5.0 | 0.7 |
| 45 | 130.050 | 2.108 | -102.5 | 3.6 | 0.9 | 3.4 | 18.6 | 11.4 | 18.0 | 0.4 | 8.0 | 2.7 |
| 46 | 131.016 | 1.524 | -102.2 | 2.5 | 2.7 | 7.2 | 33.8 | 11.6 | 18.3 | 0.3 | 11.0 | 10.8 |
| 47* | 131.157 | 1.390 | -100.6 | 3.8 | 2.2 | 8.6 | 15.9 | 11.3 | 18.0 | 0.3 | 7.3 | 5.6 |
| 48 | 131.575 | 1.300 | -104.5 | 1.9 | 0.8 | 1.6 | 6.1 | 12.4 | 19.0 | 0.3 | 4.8 | 0.5 |
| 49 | 132.792 | -0.425 | -97.1 | 1.8 | 2.1 | 3.9 | 10.2 | 11.0 | 17.8 | -0.1 | 5.6 | 1.5 |
| 50 | 133.817 | -0.758 | -94.7 | 4.6 | 1.1 | 5.4 | 31.3 | 10.7 | 17.6 | -0.1 | 9.8 | 6.3 |
| 51 | 133.825 | -0.017 | -91.2 | 1.7 | 1.0 | 1.8 | 3.0 | 10.0 | 16.9 | -0.0 | 2.6 | 0.2 |
| 52 | 136.859 | 1.557 | -90.6 | 2.3 | 1.5 | 3.5 | 16.3 | 10.7 | 17.8 | 0.3 | 7.0 | 2.1 |
| 53* | 137.283 | -1.150 | -101.6 | 2.7 | 2.4 | 6.9 | 13.2 | 14.0 | 20.9 | -0.3 | 8.2 | 5.7 |
| 54 | 137.517 | -1.267 | -98.4 | 1.7 | 1.8 | 3.2 | 10.5 | 13.1 | 20.1 | -0.3 | 6.8 | 1.8 |
| 55 | 137.617 | -1.225 | -98.7 | 3.4 | 1.5 | 5.6 | 10.6 | 13.2 | 20.2 | -0.3 | 6.9 | 3.3 |
| 56* | 137.759 | -0.983 | -103.0 | 5.9 | 2.8 | 17.6 | 41.0 | 14.7 | 21.7 | -0.3 | 15.4 | 51.4 |
| 57* | 137.775 | -1.067 | -102.1 | 5.0 | 2.3 | 12.2 | 43.0 | 14.4 | 21.4 | -0.3 | 15.4 | 35.9 |
| 58 | 138.373 | -0.850 | -94.4 | 1.9 | 1.6 | 3.2 | 8.7 | 12.3 | 19.4 | -0.2 | 5.8 | 1.3 |
| 59 | 139.116 | -1.475 | -96.8 | 4.9 | 1.3 | 6.7 | 4.6 | 13.4 | 20.5 | -0.3 | 4.4 | 1.6 |
| 60 | 139.850 | 0.368 | -88.9 | 1.9 | 1.4 | 2.9 | 5.2 | 11.4 | 18.6 | 0.1 | 4.0 | 0.6 |
| 61 | 140.183 | 0.258 | -88.3 | 2.0 | 0.8 | 1.8 | 8.1 | 11.4 | 18.6 | 0.1 | 5.1 | 0.6 |
| 62 | 140.700 | 0.150 | -86.9 | 1.9 | 1.2 | 2.5 | 8.0 | 11.2 | 18.5 | 0.0 | 5.0 | 0.8 |
| 63 | 141.083 | 0.425 | -85.0 | 1.3 | 1.9 | 2.6 | 8.3 | 10.8 | 18.2 | 0.1 | 5.0 | 0.8 |
| 64 | 142.167 | 0.267 | -85.8 | 1.6 | 1.3 | 2.3 | 9.5 | 11.6 | 18.9 | 0.1 | 5.7 | 0.9 |
| 65 | 142.642 | 0.317 | -81.1 | 2.0 | 1.0 | 2.0 | 49.0 | 10.5 | 17.9 | 0.1 | 12.0 | 3.5 |
| 66 | 143.325 | 1.775 | -79.9 | 2.7 | 1.1 | 3.1 | 17.9 | 10.4 | 17.9 | 0.3 | 7.1 | 1.9 |
| 67 | 143.533 | 0.492 | -76.7 | 4.0 | 1.6 | 6.5 | 12.8 | 9.7 | 17.2 | 0.1 | 5.6 | 2.5 |
| 68 | 144.167 | 0.817 | -74.6 | 3.0 | 1.4 | 4.6 | 6.3 | 9.4 | 16.9 | 0.1 | 3.7 | 0.8 |
| 69 | 145.208 | -0.392 | -74.0 | 4.8 | 1.7 | 8.8 | 7.5 | 9.7 | 17.2 | -0.1 | 4.2 | 1.9 |
| 70 | 145.808 | -1.817 | -79.6 | 1.8 | 1.8 | 3.6 | 17.1 | 11.6 | 19.2 | -0.4 | 7.8 | 2.7 |
| 71 | 145.850 | -1.717 | -78.6 | 2.5 | 1.7 | 4.4 | 60.0 | 11.3 | 18.9 | -0.3 | 14.3 | 11.2 |
| 72 | 146.059 | -1.650 | -77.2 | 4.9 | 1.7 | 8.7 | 17.6 | 11.0 | 18.6 | -0.3 | 7.5 | 6.0 |
Note. — Column (1): source number which is organized by increasing galactic longitude. Sources detected by Digel et al. (1994) and Kerton & Brunt (2003) are marked with and *. Columns (2)-(3): Galactic coordinates of the CO emission peak. Columns (4)-(7): results of Gaussian fit to the spectra. Column (8): angular area of the complex defined by the 3 limits. Columns (9)-(10): the heliocentric distance , and the Galactocentric distance , respectively; both are derived from the rotation curve of Reid et al. (2014), assuming = 8.34 kpc and = 240 km s-1. Column (11): scale height, , . Column (12): equivalent radii of the molecular clouds corrected by the beam size of the telescope. Column (13): cloud mass calculated using = 1.81020 (Dame et al. 2001).