Measurements of -channel single top-quark production cross sections at TeV with the ATLAS detector
Abstract
This article presents measurements of the t-channel single top-quark and top-antiquark total production cross sections and , their ratio . Differential cross sections for the and processes are measured as a function of the transverse momentum and the absolute value of the rapidity of and , respectively. The analysed data set was recorded with the ATLAS detector and corresponds to an integrated luminosity of 4.59 fb−1. The cross sections are measured by performing a binned maximum-likelihood fit to the output distributions of neural networks. The resulting measurements are pb, pb, , consistent with the Standard Model expectation.
1 Introduction
In proton–proton () collisions at the LHC, top quarks are produced at unprecedented rates. Single top-quark production is described by three subprocesses that are distinguished by the virtuality of the exchanged boson. The dominant process is the -channel exchange. A light quark from one of the colliding protons interacts with a -quark from another proton by exchanging a virtual boson (). Since the -quark density of the proton is about twice as high as the -quark density, the production cross section of single top quarks is expected to be about twice as high as the cross section of top-antiquark production . In collisions at TeV, the total inclusive cross sections of top-quark and top-antiquark production in the -channel are predicted to be with approximate next-to-next-to-leading-order (NNLO) precision [1].
2 Event selection and background estimation
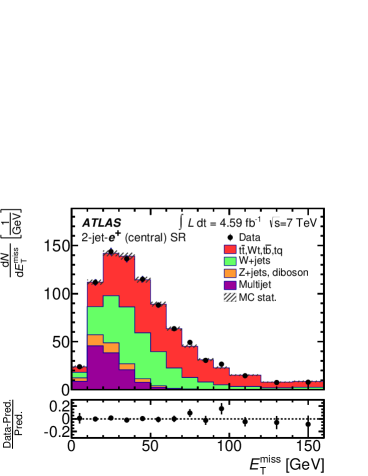
The analysis described in this article [2] uses LHC collision data collected at a center-of-mass energy of 7 TeV with the ATLAS detector [3]. Stringent detector and data quality requirements are applied, resulting in a data set corresponding to an integrated luminosity of fb-1. The event selection requires exactly one charged isolated lepton ( or ), exactly two or three jets, and GeV. Electron candidates are selected from energy deposits in the LAr electromagnetic calorimeter matched to tracks and are required to have GeV and . Muon candidates are reconstructed by combining track segments found in the inner detector and the muon spectrometer. Only candidates that have GeV and are considered. Jets are reconstructed using the anti- algorithm with a radius parameter of 0.4 and have to have GeV and . Jets in the endcap/forward-calorimeter transition region, corresponding to , must have GeV. At least one of the jets must be -tagged. Since the multijet background is difficult to model precisely, its contribution is reduced by 30 GeV and by requiring , where denotes the leading jet. The +jets background is initially normalized to the theoretical prediction and then subsequently determined simultaneously both in the context of the multijet background estimation and as part of the extraction of the signal cross section. The estimated number of events of the theoretically well know (, , -channel single top-quark production) or small processes ( , and , +jets background) are calculated using the theoretical prediction. Data driven techniques are used to derive the multijet background. In the electron channel the jet-lepton method is used. There an electron-like jet is selected with special requirements and redefined as a lepton. A binned maximum-likelihood fit to observed data in the distribution, omitting the requirement in the selection, to obtain the normalization, as shown in \Freffig:missetfit.
In the muon channel, the matrix method is used to obtain both the normalization and shape of the multijet background. The method estimates the number of multijet background events in the signal region based on loose and tight lepton isolation definitions, the latter selection being a subset of the former.
3 Signal extraction
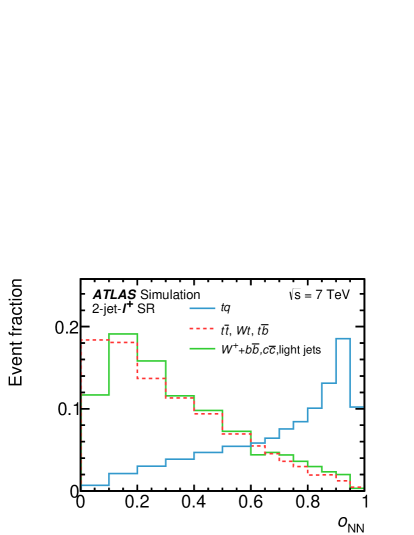
To separate -channel single top-quark signal events from background events, several kinematic variables are combined to form powerful discriminants by employing neural networks. The NeuroBayes [4] tool is used for preprocessing the input variables and for the training of the NNs. A large number of potential input variables were studied and the correct modeling of the variables is checked in a control region. In \Freffig:nn_templates, the probability densities of the resulting NN discriminants in one channel for the signal and the most important backgrounds is shown.
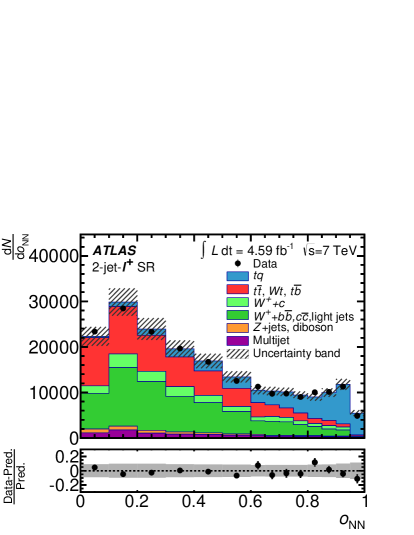
The cross sections and are extracted by performing a binned maximum-likelihood fit to the NN discriminant distributions in the 2-jet-, 2-jet-, 3-jet--1-tag, and 3-jet--1-tag channels and to the event yield in the 3-jet-2-tag channel, treating -channel top-quark and -channel top-antiquark production as independent processes. The cross-section ratio is subsequently computed as . In \Freffig:nnout_fit_results the observed NN discriminant distribution in the 2-jet- channel is shown compared to the compound model of signal and background normalized to the fit results.
4 Systematic uncertainties
Systematic uncertainties are assigned to account for detector calibration and resolution uncertainties, as well as the
uncertainties of theoretical predictions.
Uncertainties on the reconstruction and energy calibration of
jets, electrons and muons are propagated through the entire analysis.
Systematic uncertainties arising from the modeling of the single top-quark signal,
the background, and the +jets background are taken into account as well as
uncertainties related to the PDFs.
The systematic uncertainties on the individual top-quark and top-antiquark
cross-section measurements and their ratio are determined using pseudo-experiments
that account for variations of the signal acceptance, the background rates, and the shape of the NN discriminant.
The correlations between the different channels and the physics processes are fully accounted for.
The dominant systematic uncertainty on the cross sections is the JES -intercalibration
uncertainty.
5 Total cross-section measurements
After performing the binned maximum-likelihood fit and estimating the total uncertainty the results are:
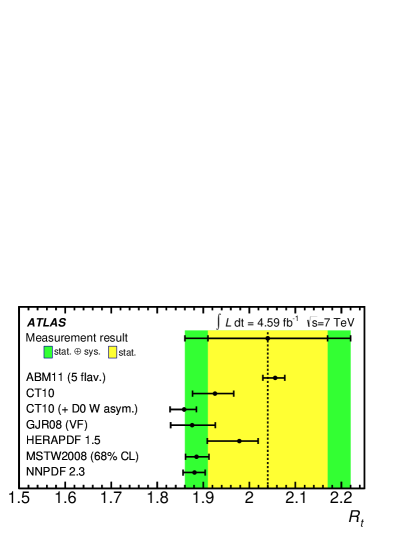
fig:rtop compares the measured values of to NLO predictions from MCFM [5] and Hathor [6] using different PDF sets.
6 Differential cross-section measurements
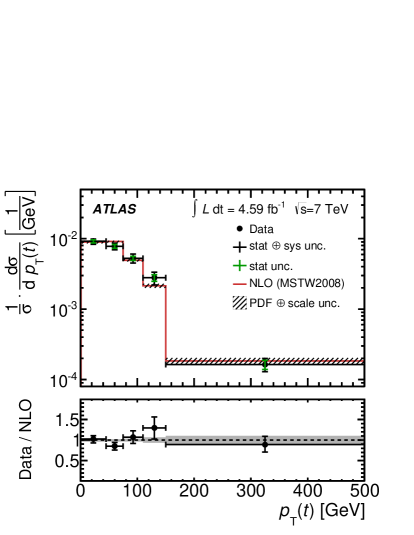
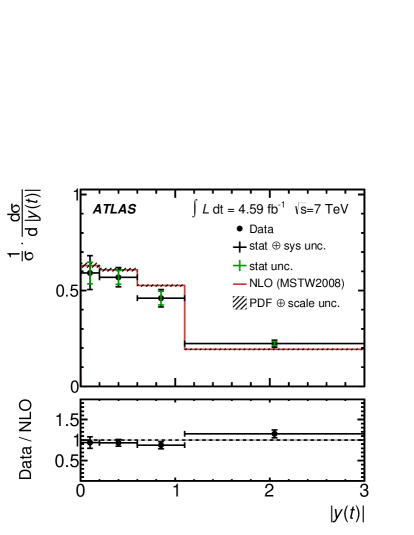
A high-purity region (HPR) is defined to measure the differential cross sections in the 2-jet- and 2-jet- channels, by requiring the NN discriminant to be larger than . In the 2-jet- HPR the signal contribution is twice as large as the background contribution, while it is approximately the same size in the 2-jet- HPR. Differential cross sections are measured as a function of the and of and . The binning of the differential cross sections is chosen based on the experimental resolution of the and distributions as well as the data statistical uncertainty. The measured distributions are distorted by detector effects and acceptance effects therefore the observed distributions are unfolded to the four-momenta of the top quarks before the decay and after QCD radiation. A migration matrix is built by relating the variables at the reconstruction and at the parton level using the signal simulation and the selection efficiency of each variable is defined as the ratio of the parton-level yield before and after selection. A graphical representation of the unfolded top quark distribution is shown in \Freffig:toppt and for the rapidity in \Freffig:toprap. Both distributions are compared to NLO predictions from MCFM using the MSTW2008 PDF set. For of the normalized differential cross sections many systematic uncertainties cancel and thus the measurement is dominated by the statistical uncertainty and the uncertainty due to the Monte Carlo sample size.
References
References
- [1] Kidonakis N 2011 Phys. Rev. D 83 091503
- [2] ATLAS Collaboration 2014 (Preprint 1406.7844)
- [3] ATLAS Collaboration 2008 JINST 3 S08003
- [4] Feindt M and Kerzel U 2006 Nucl. Instrum. Meth. A 559 190–194
- [5] Campbell J M, Frederix R, Maltoni F and Tramontano F 2009 Phys. Rev. Lett. 102 182003
- [6] Kant P, Kind O, Kintscher T, Lohse T, Martini T, Moelbitz S, Rieck P and Uwer P 2014 (Preprint 1406.4403)