Pressure-Induced Enhancement of the Magnetic Anisotropy in Mn(N(CN)2)2
Abstract
Using dc and ac magnetometry, the pressure dependence of the magnetization of the three-dimensional antiferromagnetic coordination polymer Mn(N(CN)2)2 was studied up to 12 kbar and down to 8 K. The magnetic transition temperature, , increases dramatically with applied pressure , where a change from K to kbar K was observed. In addition, a marked difference in the magnetic behavior is observed above and below 7.1 kbar. Specifically, for kbar, the differences between the field-cooled and zero-field-cooled (fc-zfc) magnetizations, the coercive field, and the remanent magnetization decrease with increasing pressure. However, for kbar, the behavior is inverted. Additionally, for kbar, minor hysteresis loops are observed. All of these effects are evidence of the increase of the superexchange interaction and the appearance of an enhanced exchange anisotropy with applied pressure.
pacs:
Valid PACS appear herepacs:
75.50.Xx, 75.30.Gw, 75.30.Kz, 75.50.EeI Introduction
There is a growing interest in the magnetic properties of molecule-based magnets under hydrostatic pressure. Due to the compressibility of the compounds containing organic ligands these materials can show enhanced transition temperatures and new magnetic behaviors when subject to applied pressure.DaSilva and Miller (2013); Miller (2014) One interesting example is the compound Mn(N(CN)2)2, which belongs to the isostructural family M(N(CN)2)2 (M = Mn, Fe, Co, Ni). These materials have a three-dimensional (3D) rutile-like structure with the metal centers connected by dicyanamide ligands (NC-N-CN)-, so each metal is surrounded by a N6 octahedron, and images of the crystal structure are readily available in the literature.Kurmoo and J. Kepert (1998); Kmety et al. (2000) All the members in the family show long range magnetic order attributed to interactions between the metal centers along the M-[N-C-N]-M superexchange path. In spite of the similarity of the crystal structures, different metals show strikingly different magnetic behaviors, where the Mn and Fe analogues are long-range canted-antiferromagnets while the Co and Ni systems are ferromagnets.Kurmoo and J. Kepert (1998); Kurmoo and Kepert (1999); R. Batten et al. (1999); Batten and Murray (2003) Based on crystallographic information, it has been suggested the nature of the magnetic interaction between the metal centers depends solely on the angle between the metals and the carbon along the superexchange path , where a crossover from non-collinear antiferromagnetism to ferromagnetism occurs for a an angle of 142∘.Kmety et al. (2000) However, magnetic measurements with compounds of mixed metals and computational studies suggest some other factors beyond such an angle also play a role in determining the sign of the superexchange interaction.Lappas et al. (2003); Demchenko et al. (2004)
Previously, dc and ac magnetometry, Batten and Murray (2003) muon-spin rotation, Jestädt et al. (2001) specific heat, and powder neutron diffraction measurements were employed to explore the magnetism of Mn(N(CN)2)2.Kmety et al. (2000); Lappas et al. (2003) Long-range canted-antiferromagnetic ordering is observed below K, with the spins of the Mn centers oriented in the ab crystallographic plane so no component is in the c axis and a small uncompensated moment is along the b axis. In the ab plane, the spins show antiparallel arrangement along the a axis and parallel orientations along the b axis.Kmety et al. (2000); Lappas et al. (2003) The spin canting has been attributed to the Dzyaloshinskii-Moriya (DM) antisymmetric interaction, which also explains the magnitude of the canting angle.Lappas et al. (2003)
The M = Fe, Co, and Ni compounds have been previously studied using low field ac magnetometry under pressure. The Fe(N(CN)2)2 and Ni(N(CN)2)2 compounds show an increase of the transition temperature of 26% and 6%, respectively, for pressures as large as 17 kbar, whereas the Co(N(CN)2)2 undergoes a transition from ferromagnetic to antiferromagnetic interactions at nominally 13 kbar.Nuttall et al. (2000) Herein, low and high field dc and ac magnetization studies for Mn(N(CN)2)2 are reported as a function of pressure up to 12.1 kbar. The data indicate an increase in the strength of the superexchange interaction with pressure and the appearance of a large magnetic anisotropy above 8.6 kbar. These results allow a phase diagram for Mn(N(CN)2)2 to be constructed. Finally, the study of a model Hamiltonian for this system suggests the pressure-induced changes in the spin-flop field and in the ordering temperature are driven by a change in the exchange anisotropy.
II Experimental section
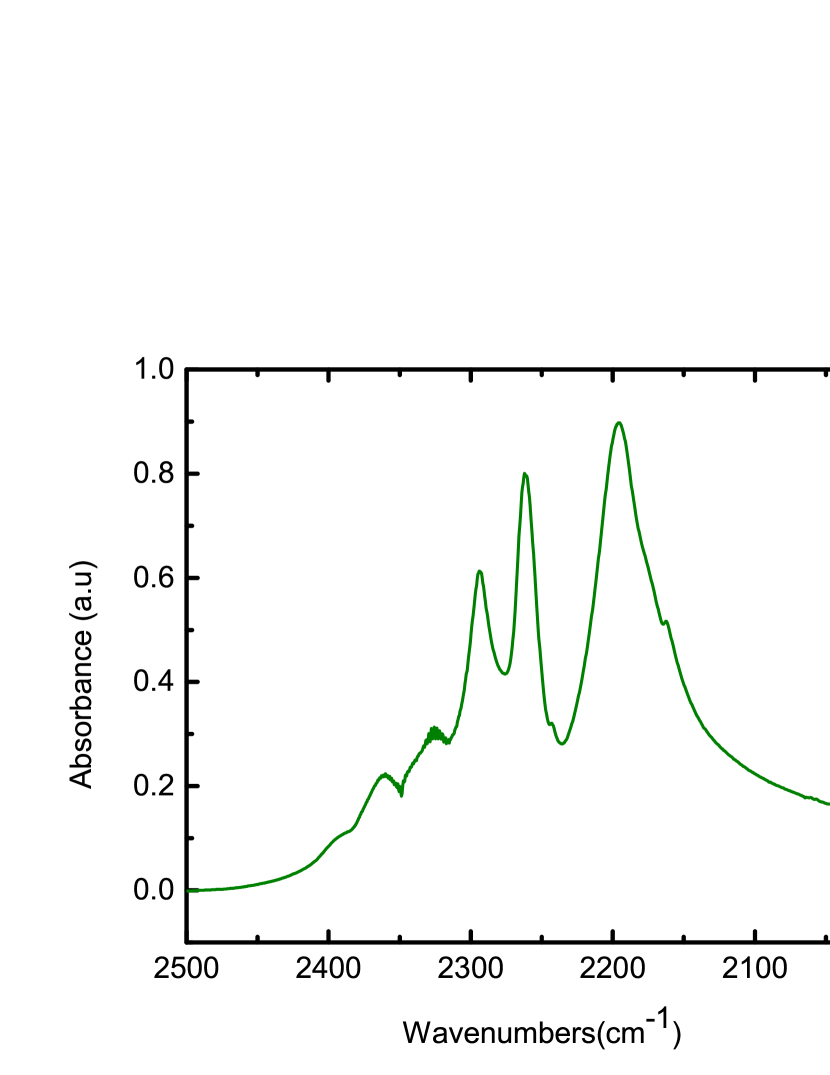
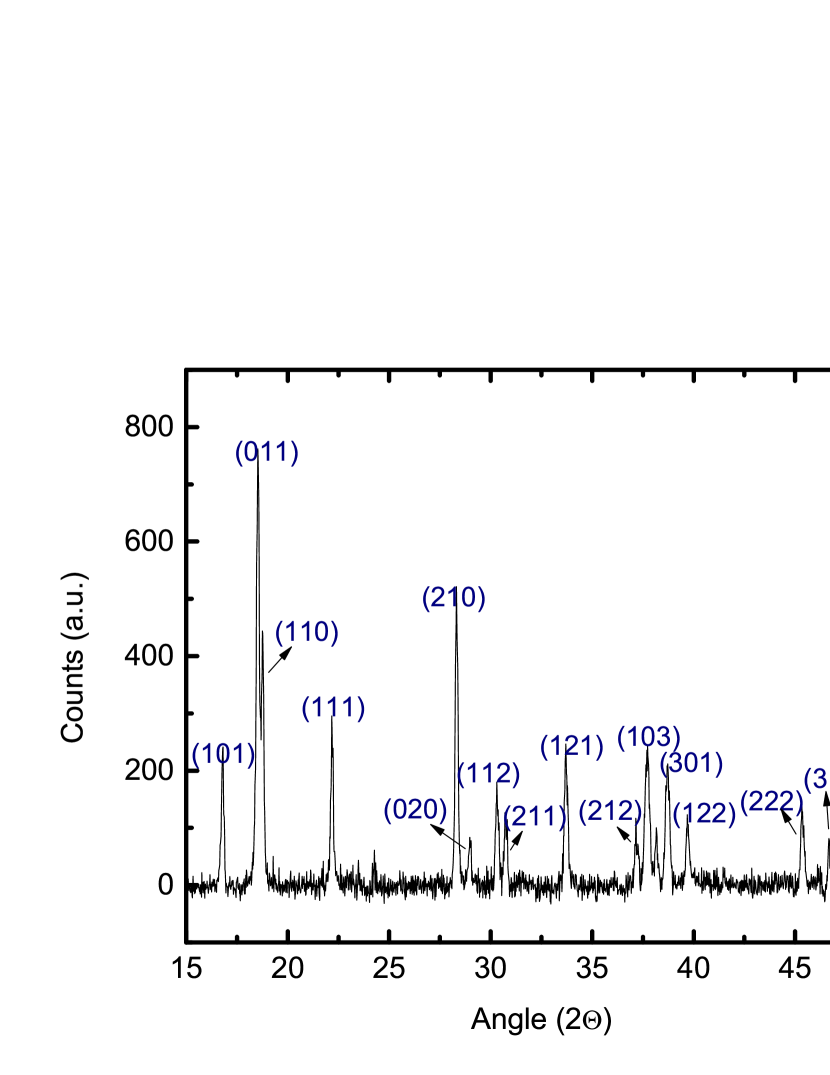
To synthesize the Mn(N(CN)2)2 crystalline powder, a procedure described in the literature was followed.R. Batten et al. (1999) Specifically, Mn(ClO4)6H2O (1.81 g, 5 mmol) was mixed with Na(N(CN)2)2 (0.89 g, 10 mmol) and 2 mL of deionized water was added to the mixture. The solution was then heated to boiling for 10 minutes. The obtained white solid was washed with ethanol and diethyl ether. CHN analyses for MnN6C4: Calculated (): C, 25.69; H, 0.0; N, 44.92; Found (): C, 25.78; H, 0.0; N, 43.94. The FTIR absorption peaks in the region 2360 cm-1 to 2192 cm-1 are consistent with the tridentate binding mode of the dicyanamide ligand through the nitrile and amide N atoms.Holub et al. (1986) In addition, the powder XRD peaks agree with the reported crystal structure of the title compound.R. Batten et al. (1999) The FTIR and XRD data sets are given as Figs. S1 and S2 in the Supplemental Material (SM) at the end of the manuscript.
Using commercial Quantum Design MPMS-XL7 and MPMS-5S SQUID magnetometers, dc and ac magnetic measurements of as-grown crystalline powder of Mn(N(CN)2)2 were performed by employing standard techniques for the ambient pressure studies and a home-made pressure cell for the high pressure investigations. Specifically, for the ambient pressure studies, the sample was weighed mg) and placed between two gelatin capsules, which were housed in a transparent drinking straw that was attached to a standard probe. Contrastingly, the pressure cell, which is a modified self-clamping device,Thompson (1984) is made of beryllium copper, the sample holder is made of teflon, and the pressure transmitting fluid is Daphne oil 7373. Pressurization is achieved by the use of two screws that cap the ends of the cell body, while the superconducting transition temperature of Pb was used to determine the pressure at low temperatures and nominally mg of sample were loaded in the teflon can.Peprah (2015)
The sample was initially cooled and the magnetization measured from 6 K to 8 K in a field of 10 Oe to establish the superconducting transition temperature of the Pb. Then the sample was warmed to room temperature and field-cooled (fc) to a base temperature of 8 K in a field of 100 Oe, and the data were collected while warming. Next, the magnetic field was zeroed by using a degaussing sequencePajerowski (2010) while at room temperature, and the sample was then cooled to a base temperature where a 100 Oe field was applied so the zero-field cooled (zfc) magnetization data could be collected while warming. Finally, the isothermal magnetization as a function of field was acquired at 8 K after field-cooling in a field of 100 Oe. The previous sequence was repeated for all the pressures studied. Even though the pressure was measured at the beginning of the sequence, before the temperature sweeps, additional studies show the pressure value at low temperatures is robust upon temperature and field cycling.Quintero (2015) Upon release of the pressure, the magnetization values returned to the ones measured at ambient pressure, indicating the pressure-induced changes were completely reversible. The magnetic background signal of the beryllium copper pressure cell at low temperature was typically two orders of magnitude lower than the signal of the Mn(N(CN)2)2 samples being studied.
III Results and discussion
Prior to the pressure-dependent magnetization studies, the sample of Mn(N(CN)2)2 was measured between two gelatin capsules. The canted-antiferromagnetic ordering was observed at K, where as the remanent magnetization and coercive field at K were = 55 emu Oe/mol and Oe, in agreement with previously reported values.Kmety et al. (2000); Lappas et al. (2003); Manson et al. (2001) Similar values were measured in the pressure cell near ambient pressure.
III.1 Low magnetic field behavior
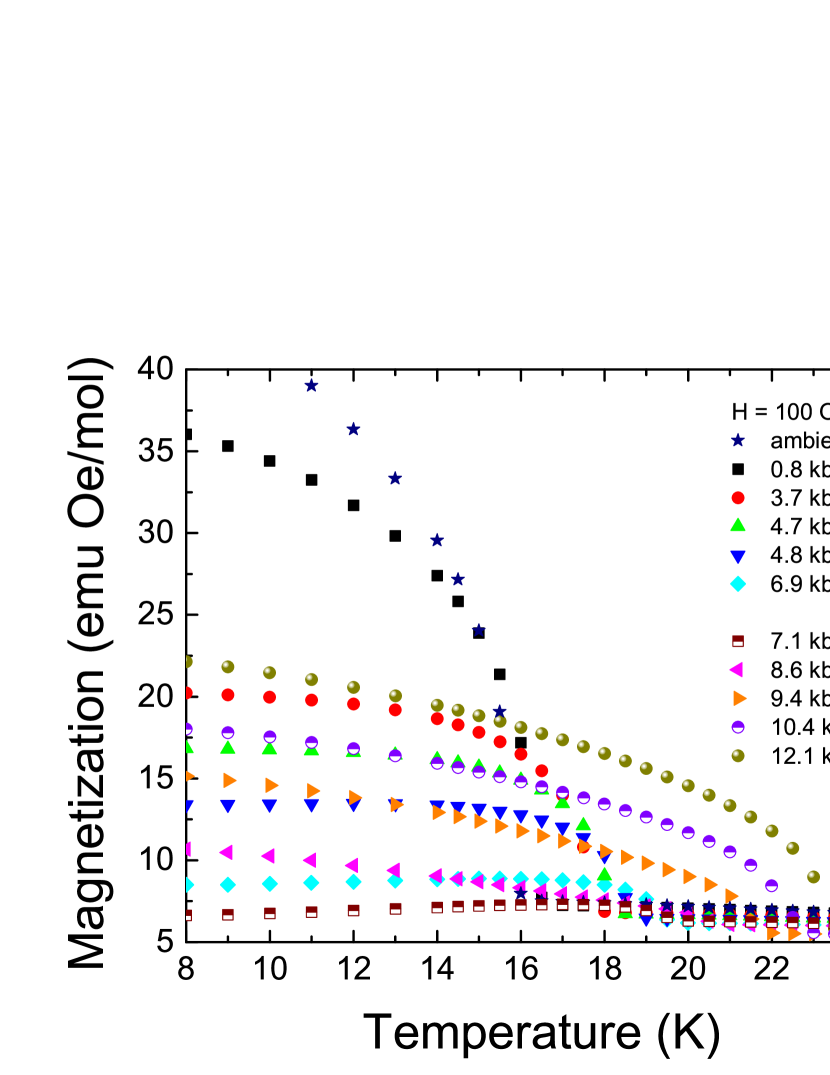
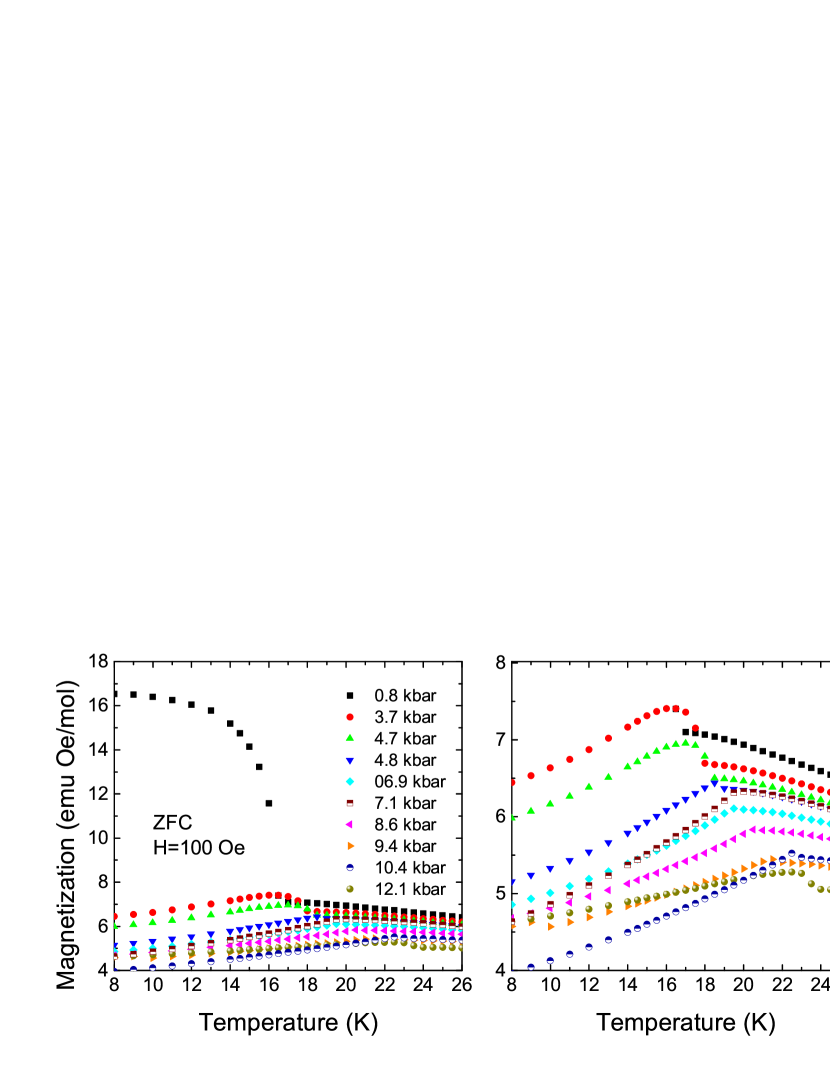
The fc magnetization for 11 different pressures is shown in Fig. 1. The value of the magnetization at 8 K decreases with increasing pressure for kbar, and the behavior is inverted for kbar, reaching a value of 22.1 emu Oe/mol at the maximum pressure, which is half of the initial value at ambient pressure. The shape of the fc magnetization curves is also notably different above and below kbar, suggesting different magnetic anisotropy regimes. Specifically, for 3.7 kbar 6.9 kbar, the magnetization increases with decreasing temperature and quickly becomes temperature independent as expected for a system with low magnetic anisotropy.Joy et al. (1998) The data for kbar shows a large increase at and then constantly decreases, simulating the typical shape of a (non-canted) antiferromagnet. For kbar, the magnetization keeps increasing without reaching a plateau, and this behavior is associated with high anisotropy.Joy et al. (1998) At this point, it is important to clarify that a qualitative distinction between low and high magnetic anisotropy will be used during this subsection, but the high field data of the next subsection will allow an estimate the high magnetic anisotropy in this system.
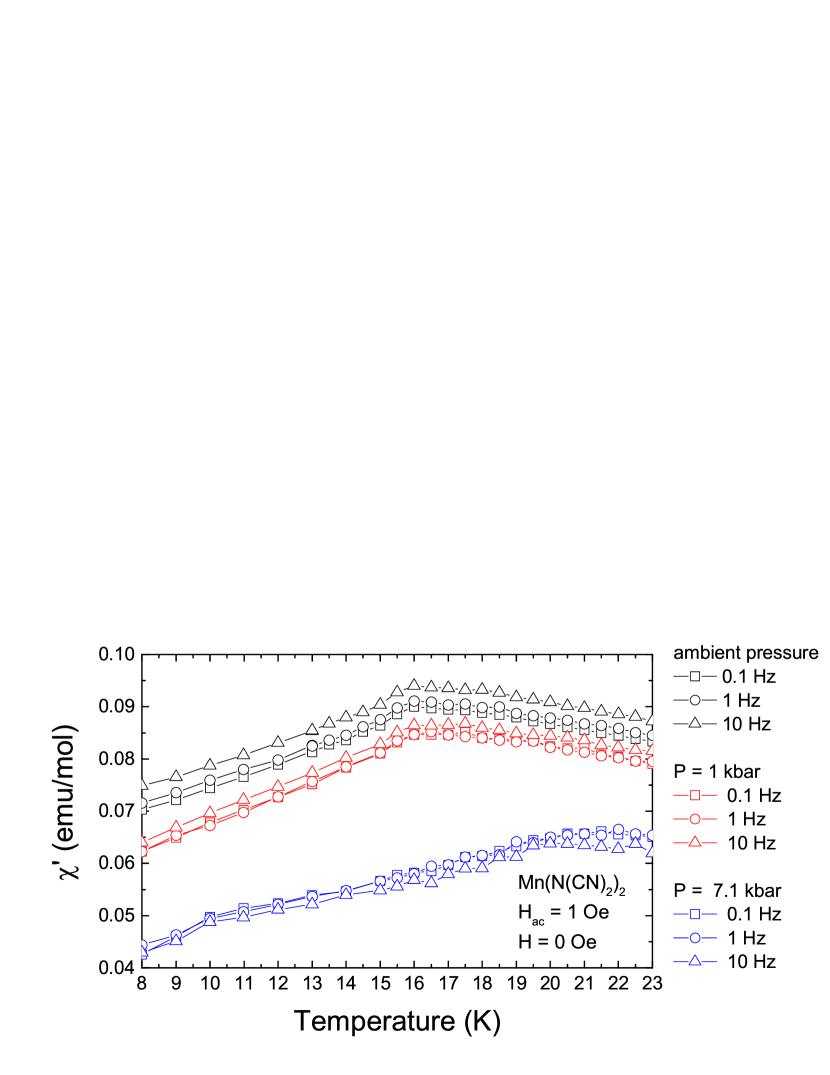
The pressure-dependences of the differences between the fc and zfc magnetizations (fc-zfc) are shown in Fig. 2. For kbar, the magnetization below the transition temperature decreases with increasing pressure, and for kbar, the trend is inverted. This behavior derives from the fc magnetization given that the value of the zfc magnetization decreases monotonically with pressure, and the detailed data sets are presented in Fig. S3 in the SM. The non-zero fc-zfc magnetization in this system can be attributed to spin-glass-like behavior or significant magnetic anisotropy. The shapes of the fc and zfc magnetization, where the signals quickly increase after and then become flat or slowly increase, suggest the differences comes from magnetic anisotropy rather than glassy behavior.Joy et al. (1998); Kumar et al. (1999) The lack of glassy behavior was confirmed by ac magnetic measurements at three different pressures and at different frequencies. For all pressures, the real component of the ac magnetization showed a transition temperature coincident with the value obtained from the dc measurement, and no frequency dependence of the magnetization was observed, Fig. S4.
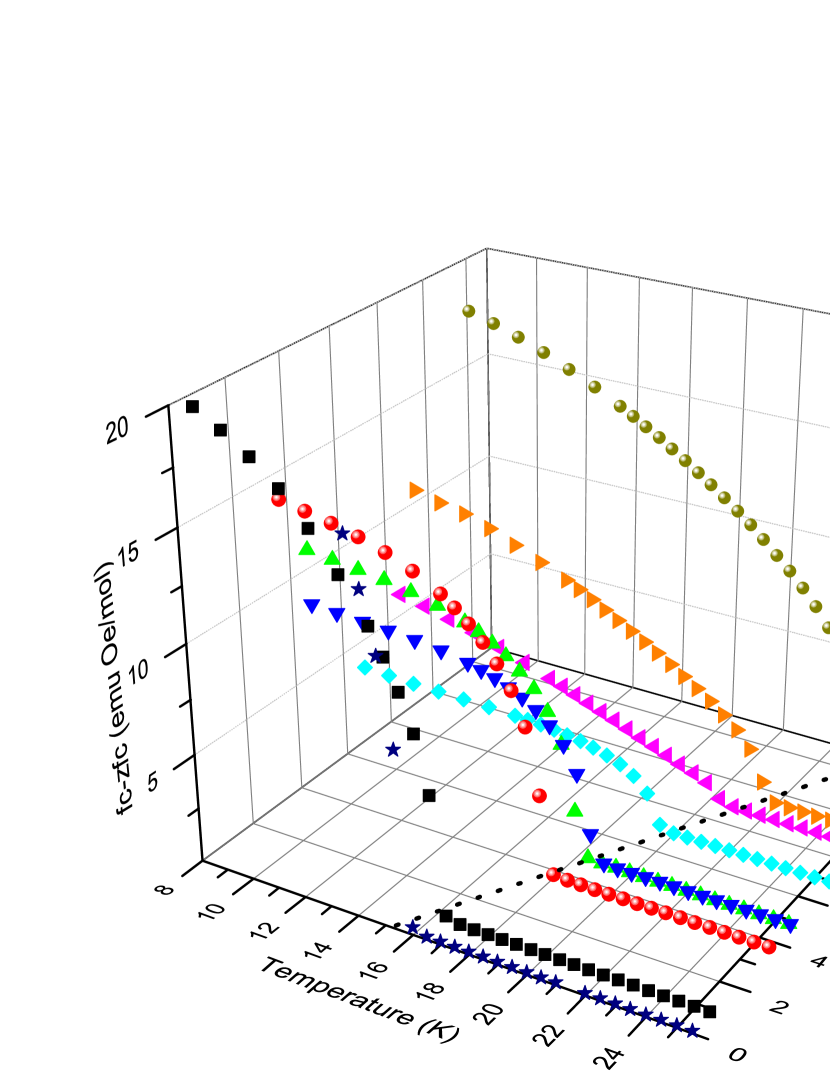
The magnetic anisotropy plays a fundamental role in the differences between the fc and zfc magnetizations. During the zfc measurement, no external field is present when the sample is cooled through the ordering temperature, and the magnetic domains formed during the phase transition will have random orientations. Consequently, at base temperature when a small magnetic field of 100 Oe is applied, the magnetic response will depend on the magnitude of the anisotropy. For a low anisotropy system, the small field will be enough to reorient the domains in the direction of the field, and the magnetization will be similar to the response reflected in the fc data, making the fc-zfc magnetization small. By the same argument, a system with high anisotropy will show a large fc-zfc magnetization.
The temperature at which the canted-antiferromagnetic order occurs, , increases with pressure over the entire range of pressures studied as shown in Fig. 3. The transition temperature increases from K to ( kbar) = 23.5 K, see Fig. 3. This value corresponds to a change in of 48 at 12.1 kbar, which is larger than the changes reported for the isostructural compounds M(N(CN)2)2 with M = Fe, Co, and Ni, which show variations of up to 26 for the Ni analogue at 17 kbar.Nuttall et al. (2000)
The pressure-induced enhancement of can be understood in terms of an increase in the magnitude of the superexchange parameter . The coupling of the metal ions in Mn(N(CN)2)2 is antiferromagnetic, and the Pauli principle suggest that the anti-parallel coupling between spins comes from the overlap of like orbitals (instead of unlike orbitals for ferromagnetic interaction).Goodenough (1963) The overlap, then, increases with external pressure and, consequently, the magnetic interaction and transition temperature also increase.

The low field magnetization measurements suggest the following picture for Mn(N(CN)2)2. The pressure monotonically increases the strength of the antiferromagnetic interaction, , favoring a smaller canting angle between the spins, thereby driving the fc and zfc magnetization to monotonically decrease with pressure while increases. However above 7.1 kbar, a large magnetocrystalline anisotropy appears, and as a result, a small field of 100 Oe is not enough to reorient the spins along the easy-axis, causing significant differences between the the fc and zfc data sets, Fig 2. Moreover the opposite pressure dependences of the fc and zfc magnetizations for kbar suggest the anisotropy is increasing with pressure. In the next subsection, the high field behavior of the magnetic response of Mn(N(CN)2)2 will be presented and discussed within the framework of this emerging interpretation.
III.2 High magnetic field behavior
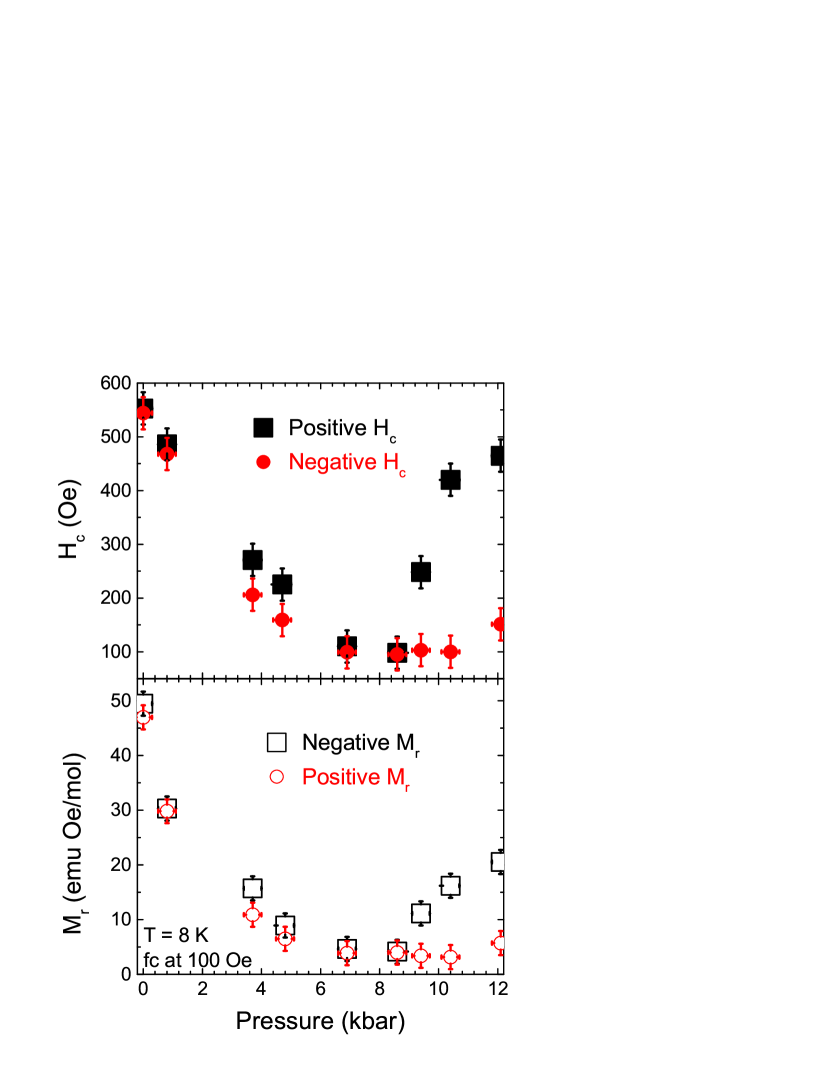
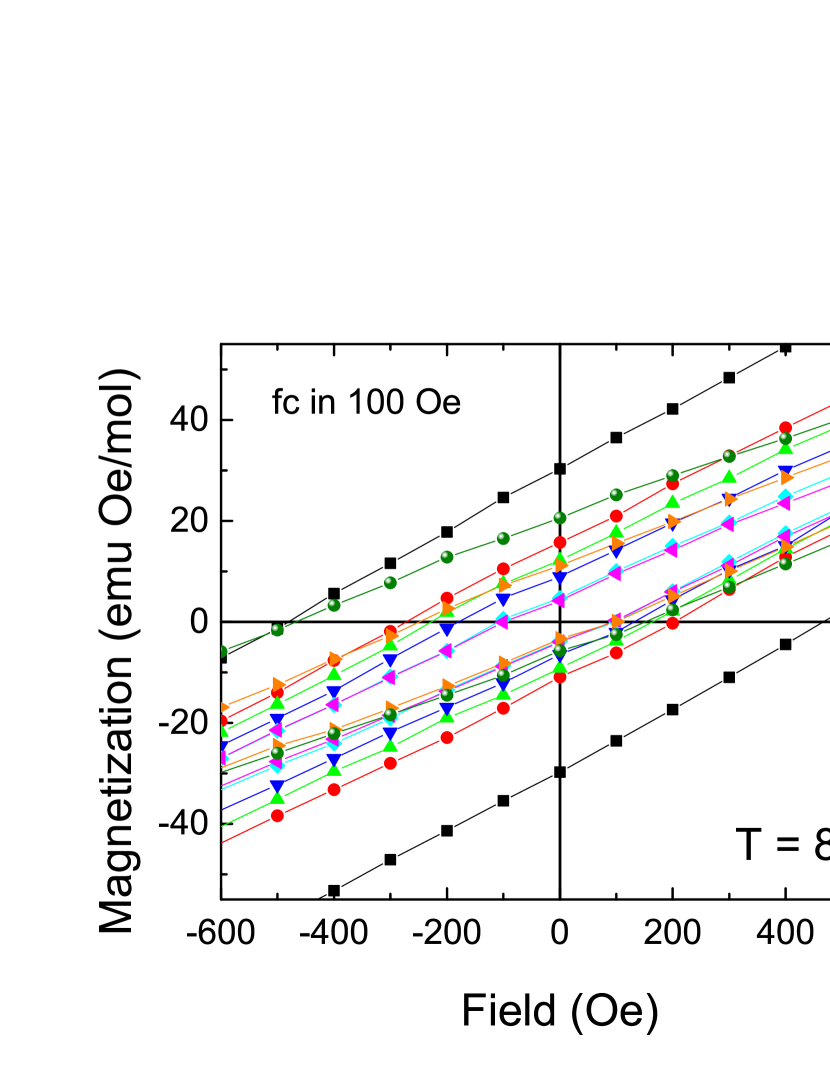
The field dependences of the fc magnetizations at K were measured at different pressures. Figure 4 shows the coercive fields, , and remanent magnetization values, , extracted from each hysteresis loop. The complete hysteresis data sets are plotted in Fig. S5 in the SM. The positive and negative are defined as the crossing of the magnetic hysteresis loop with the positive and negative x-axis, respectively. In the same way, the positive and negative are defined as the crossing of the hysteresis loop with the positive and negative y-axis.
The coercive field decreases with increasing pressure for kbar, while the trend is inverted for kbar, and the same behavior is followed by the remanent magnetization values, as shown in Fig. 4. Additionally, for kbar, the positive and negative coercive fields and remanent magnetization values are the same within experimental resolution, but for 8.6 kbar, they become visibly different. The difference between the positive and negative values for and increases with pressure, reaching values of 314 Oe and 14.8 emu Oe/mol, respectively, at 12.1 kbar.
The magnetic field necessary to flip a spin will increase if the magnetic anisotropy barrier increases. The similarity of the pressure-dependent behavior of the coercivity and the low field fc-zfc magnetization, Fig. 2, is another signature that a change in the magnetic anisotropy is driving the behavior of Mn(N(CN)2)2 for large pressures.
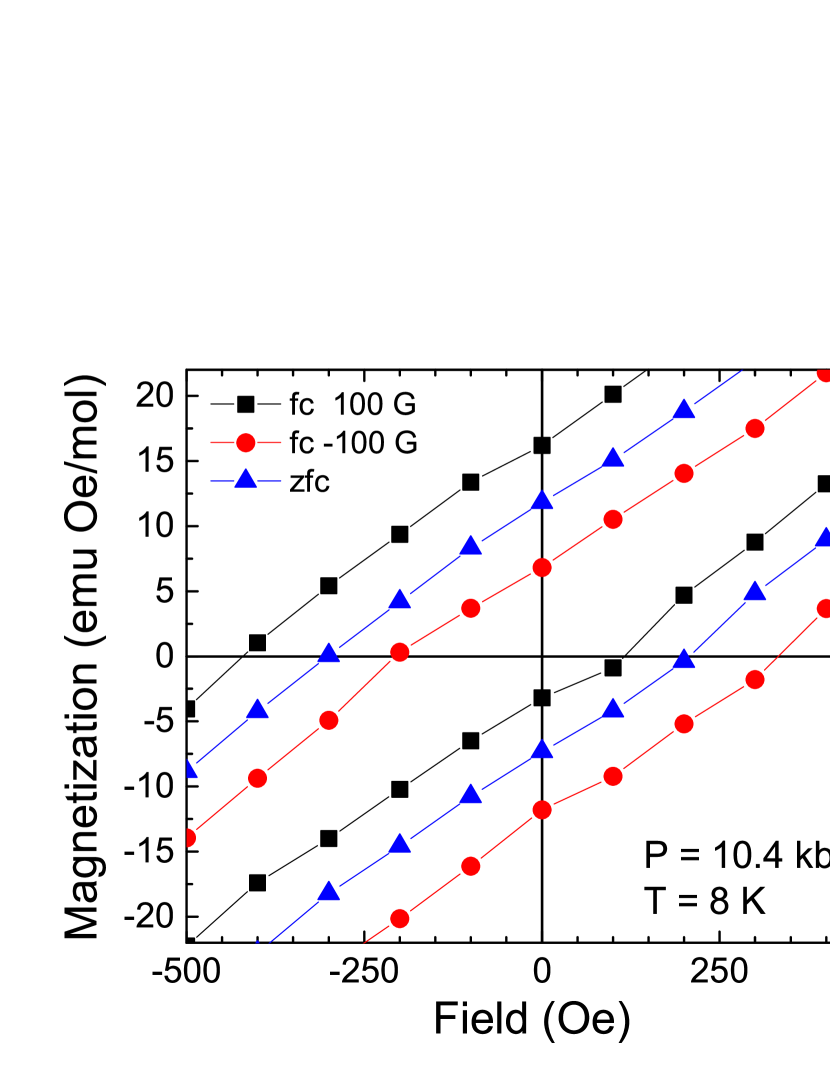
To study the asymmetry of the magnetic hysteresis loops in more detail, the data collection sequence was repeated after cooling the sample from room temperature in different fields. For pressures lower than 8.6 kbar, the hysteresis curves were independent of the value and orientation of the cooling field, but this behavior changed at larger pressures. For example, a typical data set is shown in Fig. 5 for a pressure of 10.4 kbar. When the sample was cooled in 100 Oe, the hysteresis loop appeared shifted towards negative fields and positive magnetization, while the opposite behavior was observed when the cooling field was Oe. On the other hand, when cooled in zero field, the hysteresis loops appears roughly symmetric with respect to the origin. Even though the field-dependent shifts along the x-axis are consistent with what would be expected from an exchange-bias system, in the case of Mn(N(CN)2)2, these shifts are caused by an anisotropy-driven minor loop effect. Exchange-bias effects are ruled out since the maximum field used in our measurements, kOe is lower than the saturation field of Mn(N(CN)2)2, which has been previously measured to be kOe at 4 K.Brinzari et al. (2013) Moreover, the interactions between the metal centers are antiferromagnetic in the range of pressure studied, and additionally the shifts along the y-axis are not expected in a typical exchange-bias system.Nogués and Schuller (1999); Giri et al. (2011)
The reason for the minor loop effects above 8.6 kbar is the appearance of a large magnetic anisotropy that is not present at lower pressures, and the fact that the maximum applied field of 70 kOe is not enough to saturate the sample, .Nogués and Schuller (1999); Giri et al. (2011); Geshev (2008) Furthermore, in the literature,Giri et al. (2011); Geshev (2008); Pradheesh et al. (2012) a stronger bound is used, and minor loop effects are expected just when the maximum applied field is not enough to overcome the anisotropy of the system. According to this statement, the minor loops are present if , where is the anisotropy field of the system. This phenomenological relationship suggests the anisotropy field is of the order of 70 kOe for Mn(N(CN)2)2 at pressures larger than 8.6 kbar.
The explanation of the minor loop effect for a system with large magnetic anisotropy is as follows. When the sample is fc in a positive field through the ordering temperature, the domains are oriented in the direction of the field, and given the large magnetic anisotropy in the system, it will be hard to rotate the spins in a different direction. In particular, when the sample is at base temperature of 8 K, the maximum negative field applied of kOe is not enough to overcome the anisotropy and align the domains in the negative direction. Therefore, the magnetic field required to flip the spins from the negative to the positive direction is lower than than the field required to flip the spins in the opposite way, and as a result, positive is lower than negative . Naturally, for the fc protocol in a negative field, the behavior is inverted, and when zfc is used, the hysteresis loop is roughly symmetric. In other words, the high magnetic anisotropy is the reason why the system remembers the sign of the field used to cool through the ordering temperature.
III.3 Discussion
Given the previously observed magnetoelastic coupling in the M(N(CN)2)2 family,Lappas et al. (2003); Brinzari et al. (2013) the pressure-induced changes seen in Mn(N(CN)2)2 are most likely driven by magnetocrystalline anisotropy. Recent spectroscopic work at 300 K revealed a series of pressure-driven transitions in Mn(N(CN)2)2 with changes in the phonon behavior near kbar and kbar. The transition at kbar was interpreted as a lattice distortion, while the more dramatic transition at kbar was associated with a reduction of the crystal symmetry.Brinzari et al. (2014) It is possible that the pressure-induced magnetic anisotropy change seen in Mn(N(CN)2)2 at low temperature is driven by the same distortions of the lattice. However, crystallographic data as a function of pressure are necessary to confirm these conjectures.
IV Extended phase diagram
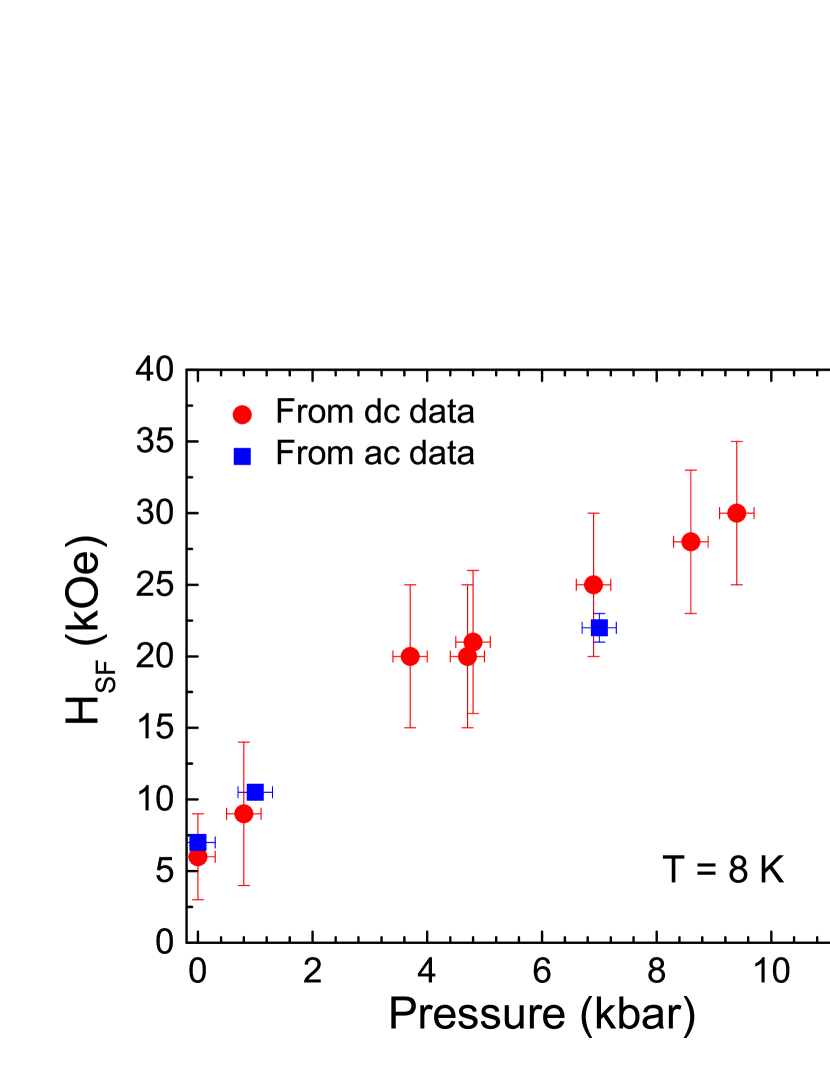
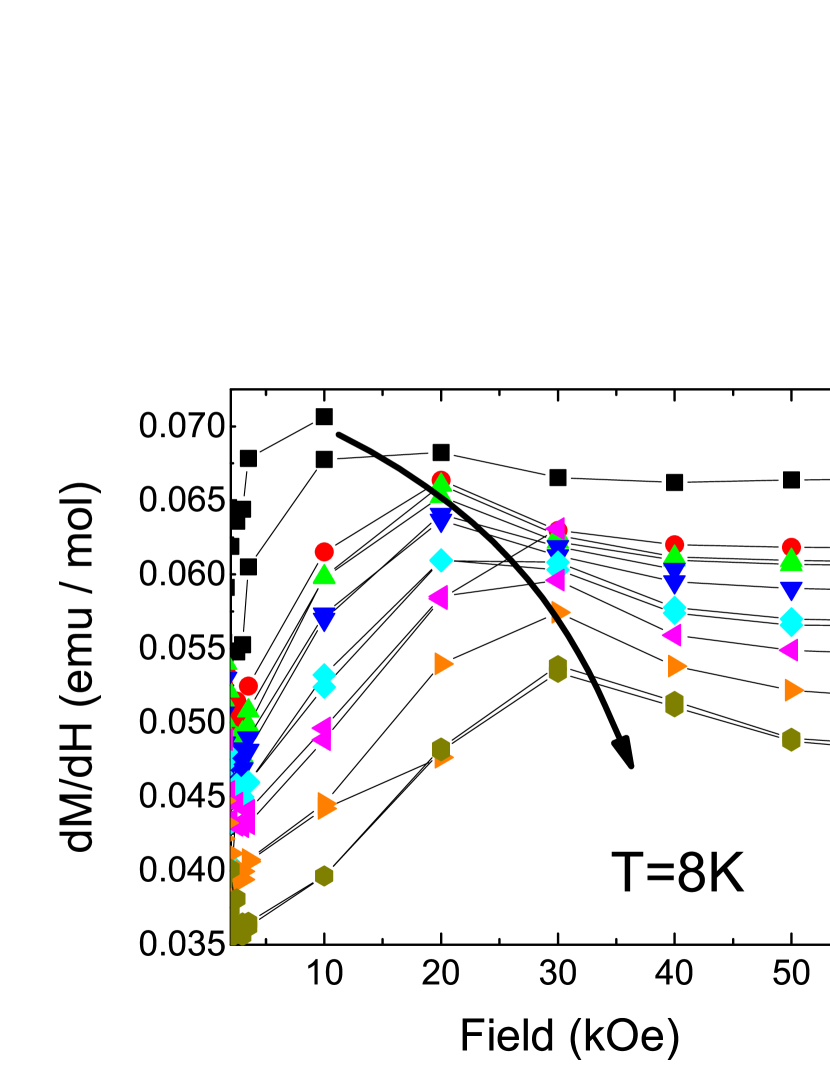
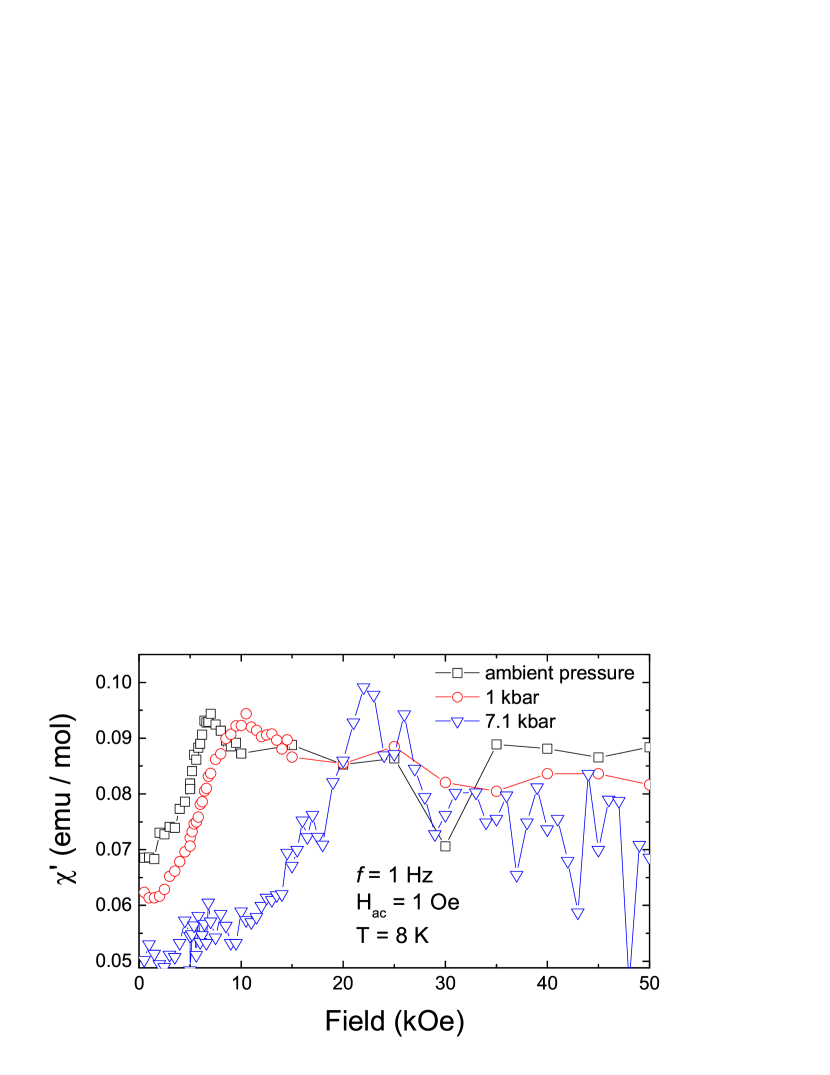
Using the high field magnetic data, the phase diagram of Mn(N(CN)2)2 can be explored. The spin-flop field for Mn(N(CN)2)2 can be observed using either ac or dc field-dependent magnetization measurements.Kmety et al. (2000); Lappas et al. (2003); Manson et al. (2001) In the dc magnetic data, the spin-flop field appears as a peak in the derivative of the magnetization as a function of field, and in the ac magnetic data, as a peak in the in-phase component of the magnetization, see Figs. S6 and S7. Figure 6 shows the pressure dependence of the the spin-flop field at base temperature extracted from the ac and dc field-dependent magnetization data. The spin-flop field of 7 kOe at ambient pressure and 8 K coincides with previous reportsManson et al. (2001) and increases with pressure, reaching a value of 31 kOe at 12.1 kbar.
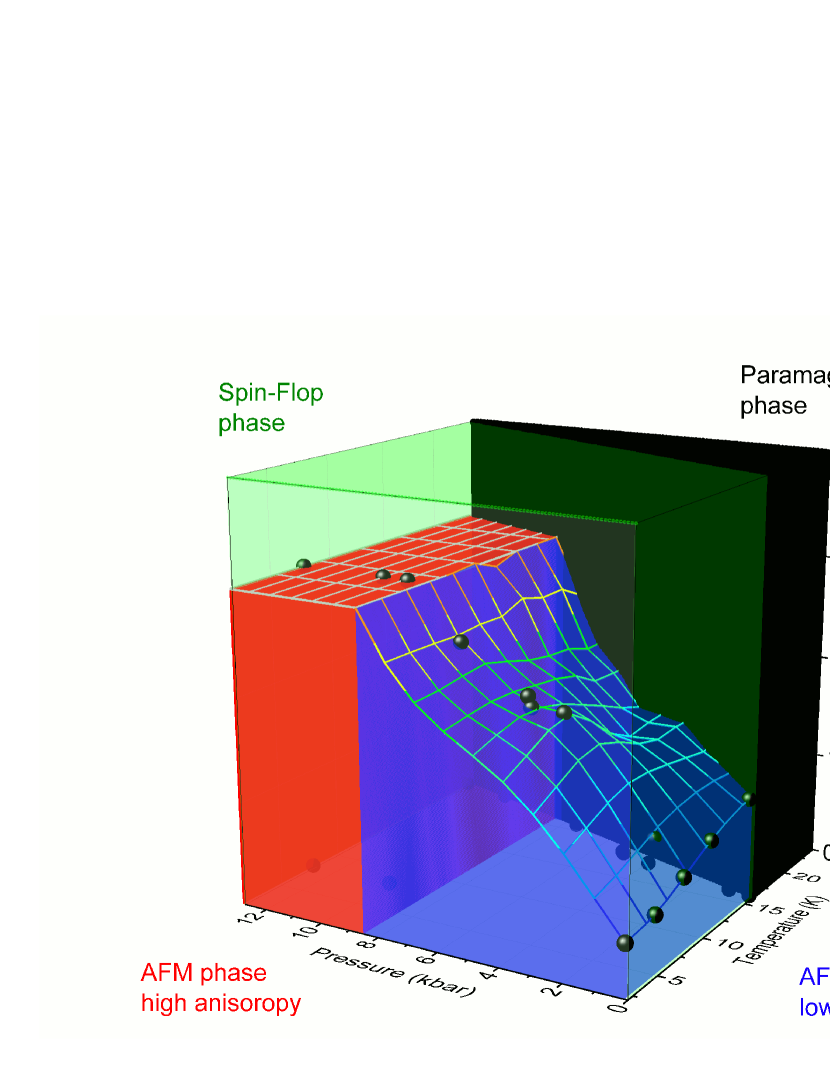
The phase diagram is shown in Fig. 7, where the data from Figs. 3 and 6 have been combined with the results of reported by Manson et al.Manson et al. (2001) Four regions have been identified by making some extrapolations of the existing data sets. For example, the surface separating the AFM-PM regions is a horizontal wall, meaning that the transition temperature for all pressures is field independent up to 40 kOe. In addition, the AFM-SF surface was extrapolated using the data at 8 K, and the separation from the low anisotropy and high anisotropy regions inside the AFM phase was marked at a field-independent pressure of 8.6 kbar. Finally, it is important to note that the magnetic field axis extends to 40 kOe, which is significantly lower than the saturation value of 304 kOe.Brinzari et al. (2013)
V Model
To develop a model for this compound in a magnetic field, the polycrystalline nature of sample is accommodated by averaging over all field orientations. As a next step, consider a model with only (possibly anisotropic) nearest-neighbor interactions between Mn2+ spins. In a magnetic field along , the Hamiltonian is then given by
| (1) |
where is the easy-axis anisotropy that aligns the spins along the axis. Due to the small canted moment of 0.002 ,Lappas et al. (2003) the small Dzyaloshinskii-Moriya interaction can be ignored.
Assuming that the exchange anisotropy is small, can be estimated from the saturation field in zero pressure.Brinzari et al. (2013) Averaging over all field directions, , kOe implies that meV. This exchange coupling then implies K, which overestimates by about 50%, as expected from mean-field theory.
Now consider the origin of the spin-flop field, , and its increase by a factor of 6 from 5 kOe at ambient pressure to 30 kOe at 12.1 kbar, Fig. 6. There are two possible origins for the spin-flop field. Firstly, may be caused by the easy-axis anisotropy . Such an anisotropy would be unexpected for Mn2+ spins because its orbital angular momentum is quenched. Nevertheless, after averaging over orientations of the magnetic field, one obtains
| (2) |
Since , the increase in with pressure from 16 K to 24 K, Fig. 3, implies increases by about 50%. So the observed rise of from 5 kOe to 30 kOe requires that increases from meV to meV, or an increase by a factor of 24. This dramatic rise might occur due to a spin transition from to (an spin would also not have easy-axis anisotropy). But there are two problems with this explanation. Firstly, a change in crystal field would result in both electrons paring with electrons of the opposite spin, thereby producing not . Secondly, easy-axis anisotropy would cause to drop with temperature from .Rives and Benedict (1975) However, is observed to rise with temperature for this material, see Fig. 7.
The other possible origin for is anisotropic exchange with and , so the exchange favors antiferromagnetic alignment of the spins along the axis. Anisotropic exchange is believed to be present in many materials.Manson et al. (2001) In all such materials, initially rises with temperature from its value at , in agreement with the prediction by Rives and Benedict. Rives and Benedict (1975) After averaging over orientations of the field, one obtains
| (3) |
At ambient pressure, this relation implies that meV so that the exchange anisotropy is .
Since , the increase in with pressure from 16 K to 24 K implies that rises by about 50%. The relations for and imply that at high pressures, meV and meV. So the exchange anisotropy rises from 0.05% at ambient pressure to 0.8% at 12.1 kbar. This last possibility seems like the most plausible explanation for the increase in . Since depends very weakly on , the saturation field should also rise by about 50% with pressure, which will hopefully be verified by future measurements.
VI Conclusions
The magnetic behavior of Mn(N(CN)2)2 was studied under hydrostatic pressure using dc and ac magnetometry. The long-range canted-antiferromagntic ordering temperature increases with pressure from 16 K at ambient pressure to 23.5 K at 12 kbar, which corresponds to a change of 48, and this value is larger than those previously reported for the isostructural compounds M(N(CN)2)2 with M = Fe, Co, and Ni. The fc-zfc magnetization, the coercive field, and the remanent magnetization values decrease as the applied pressure increases for kbar, and the behavior is inverted for kbar. Additionally, a field-cool dependent asymmetry in the magnetic hysteresis loop is observed at 8 K for kbar. All of these effects are understood in terms of a monotonic increase of the superexchange interaction with pressure and the appearance of an enhanced magnetic anisotropy. The spin-flop field was found to monotonically increase with pressure, and a phase diagram was sketched in temperature, magnetic field, and pressure space. Finally, the changes in the spin-flop field and the ordering temperature were shown to be consistent with an increase in the exchange anisotropy parameter from 0.05% at ambient pressure to 0.8% at 12.1 kbar.
Acknowledgements.
This work is supported, in part, by NSF DMR-1202033 (MWM), DMR-1405439 (DRT), and DMR-1157490 (NHMFL). Research by RSF is sponsored by the Office of Science, Materials Sciences and Engineering Division, Office of Basis Energy Sciences, U.S. Department of Energy. We gratefully acknowledge enlightening conversations with Jamie L. Manson and Janice L. Musfeldt.Supplemental Material
Supplemental characterization data for Mn(N(CN)2)2 are presented. Specifically, the XRD data, FTIR data, the dc zero-field-cooled magnetization as a function of pressure, the ac magnetization as a function of temperature and field for three different pressures, and the isothermal dc magnetization as a function of field for different pressures are shown.
References
- DaSilva and Miller (2013) J. G. DaSilva and J. S. Miller, Inorganic Chemistry 52, 1418 (2013).
- Miller (2014) J. S. Miller, Materials Today 17, 224 (2014).
- Kurmoo and J. Kepert (1998) M. Kurmoo and C. J. Kepert, New J. Chem. 22, 1515 (1998).
- Kmety et al. (2000) C. R. Kmety, Q. Huang, J. W. Lynn, R. W. Erwin, J. L. Manson, S. McCall, J. E. Crow, K. L. Stevenson, J. S. Miller, and A. J. Epstein, Phys. Rev. B 62, 5576 (2000).
- Kurmoo and Kepert (1999) M. Kurmoo and C. J. Kepert, Mol. Cryst. Liq. Cryst. Sci. Technol. Sect. A 334, 693 (1999).
- R. Batten et al. (1999) S. R. Batten, P. Jensen, C. J. Kepert, M. Kurmoo, B. Moubaraki, K. S. Murray, and D. J. Price, J. Chem. Soc., Dalton Trans. , 2987 (1999).
- Batten and Murray (2003) S. R. Batten and K. S. Murray, Coordination Chemistry Reviews 246, 103 (2003).
- Lappas et al. (2003) A. Lappas, A. S. Wills, M. A. Green, K. Prassides, and M. Kurmoo, Phys. Rev. B 67, 144406 (2003).
- Demchenko et al. (2004) D. O. Demchenko, A. Y. Liu, E. Z. Kurmaev, L. D. Finkelstein, V. R. Galakhov, A. Moewes, S. G. Chiuzbǎian, M. Neumann, C. R. Kmety, and K. L. Stevenson, Phys. Rev. B 69, 205105 (2004).
- Jestädt et al. (2001) T. Jestädt, M. Kurmoo, S. J. Blundell, F. L. Pratt, C. J. Kepert, K. Prassides, B. W. Lovett, I. M. Marshall, A. Husmann, K. H. Chow, R. M. Valladares, C. M. Brown, and A. Lappas, Journal of Physics: Condensed Matter 13, 2263 (2001).
- Nuttall et al. (2000) C. J. Nuttall, T. Takenobu, Y. Iwasa, and M. Kurmoo, Mol. Cryst. Liq. Cryst. Sci. Technol. Sect. A 343, 227 (2000).
- Holub et al. (1986) A. M. Holub, H. Köhler, and V. V. Skopenk, Chemistry of Pseudohalides, Topics in Inorganic and General Chemistry (Elsevier, 1986).
- Thompson (1984) J. D. Thompson, Rev. Sci. Instrum. 55, 231 (1984).
- Peprah (2015) M. K. Peprah, Ph.D. thesis, University of Florida (2015).
- Pajerowski (2010) D. M. Pajerowski, Ph.D. thesis, University of Florida (2010).
- Quintero (2015) P. A. Quintero, Ph.D. thesis, University of Florida (2015).
- Manson et al. (2001) J. L. Manson, C. R. Kmety, F. Palacio, A. J. Epstein, and J. S. Miller, Chemistry of Materials 13, 1068 (2001).
- Joy et al. (1998) P. A. Joy, P. S. A. Kumar, and S. K. Date, Journal of Physics: Condensed Matter 10, 11049 (1998).
- Kumar et al. (1999) P. Kumar, P. Joy, and S. Date, Physica B: Condensed Matter 269, 356 (1999).
- Goodenough (1963) J. B. Goodenough, Magnetism and the Chemical Bond, Interscience Monographs on Chemistry: Inorganic Chemistry Section (Interscience Publishers, 1963).
- Brinzari et al. (2013) T. V. Brinzari, P. Chen, Q.-C. Sun, J. Liu, L.-C. Tung, Y. Wang, J. A. Schlueter, J. Singleton, J. L. Manson, M.-H. Whangbo, A. P. Litvinchuk, and J. L. Musfeldt, Phys. Rev. Lett. 110, 237202 (2013).
- Nogués and Schuller (1999) J. Nogués and I. K. Schuller, J. Magn. Magn. Mater. 192, 203 (1999).
- Giri et al. (2011) S. Giri, M. Patra, and S. Majumdar, Journal of Physics: Condensed Matter 23, 073201 (2011).
- Geshev (2008) J. Geshev, J. Magn. Magn. Mater. 320, 600 (2008).
- Pradheesh et al. (2012) R. Pradheesh, H. S. Nair, V. Sankaranarayanan, and K. Sethupathi, Applied Physics Letters 101, 142401 (2012).
- Brinzari et al. (2014) T. V. Brinzari, K. R. O’Neal, J. L. Manson, Z. Liu, and J. L. Musfeld, “Local structure evolution of Mn[N(CN)2]2 under pressure,” (2014), preprint.
- Rives and Benedict (1975) J. E. Rives and V. Benedict, Phys. Rev. B 12, 1908 (1975).