A NuSTAR observation of the fast symbiotic nova V745 Sco in outburst
Abstract
The fast recurrent nova V745 Sco was observed in the 3-79 keV X-rays band with NuSTAR 10 days after the optical discovery. The measured X-ray emission is consistent with a collisionally ionized optically thin plasma at temperature of about 2.7 keV. A prominent iron line observed at 6.7 keV does not require enhanced iron in the ejecta. We attribute the X-ray flux to shocked circumstellar material. No X-ray emission was observed at energies above 20 keV, and the flux in the 3-20 keV range was about 1.6 10-11 erg cm-2 s-1. The emission measure indicates an average electron density of order of 107 cm-3. The X-ray flux in the 0.3-10 keV band almost simultaneously measured with Swift was about 40 times larger, mainly due to the luminous central supersoft source emitting at energy below 1 keV. The fact that the NuSTAR spectrum cannot be fitted with a power law, and the lack of hard X-ray emission, allow us to rule out Comptonized gamma rays, and to place an upper limit of the order of 10-11 erg cm-2 s-1 on the gamma-ray flux of the nova on the tenth day of the outburst.
keywords:
binaries: close, stars, white dwarfs, X-rays: stars1 Introduction
Classical novae in outburst are very luminous X-ray sources for two reasons. One source of X-ray emission is the very hot white dwarf, burning hydrogen in a shell which is covered by only a thin atmosphere. In most novae the ejecta become transparent to X-rays before hydrogen burning has been completely quenched, so the X-ray emission is extremely soft, peaking below 1 keV, and very luminous, usually exceeding 1037 erg s-1 and often reaching a few times 1038 erg s-1 (see Orio, 2012, and numerous references therein). In this work we deal with the second important source of X-ray emission, the nova ejecta. X-ray emission due to photoionization by the extremely hot central source cannot be completely ruled out, but most nova shells appear to contain collisionally ionized plasma, as expected from internal shocks (e.g. Metzger et al., 2014), even at late post-outburst phases (e.g. Rohrbach et al., 2009; Orio et al., 2013; Tofflemire et al., 2013), or in symbiotic novae because the nova wind impacts a previous red giant wind. This second phenomenon occurs in the early phases of the outburst (a typical case is RS Oph, see Nelson et al., 2008). The energy range of X-ray emission observed from the ejected nebula varies by orders of magnitude in different novae. The hard X-ray emission peaked in the third week after the eruption for V382 Vel (Mukai & Ishida, 2001), after a week for RS Oph (Sokoloski et al., 2006), and after only 5 days for V838 Her (Lloyd et al., 1992).
In the last four years, GeV gamma rays have been detected in a handful of very luminous novae leaving open the possibility that all other novae may be gamma ray sources at a level below the luminosity detection threshold of Fermi (which is of the order of 1036 erg s-1 at a few kpc distance). For the symbiotic nova V407 Cyg, the gamma rays were attributed to pion decay, resulting from proton-proton interactions in the thick red giant wind in which particles are accelerated by of the nova outflows (Abdo et al., 2010), although Martin & Dubus (2013) favored instead a “leptonic origin”, like in the other novae detected with Fermi (N Sco 2012, N Mon 2012, V339 Del, and V1369 Cen). In all these cases the gamma ray flux was attributed to a combination of inverse Compton scattering with low energy photons, and bremsstrahlung, when the electrons are accelerated in strong shocks in the circumstellar medium (see Ackerman et al. 2014 and references therein). A question that naturally arises is whether the hard X-ray emission of novae in outburst originates in the same medium, and from the same mechanisms, as the gamma ray emission. The X-rays may be due to Compton downscattering of gamma rays (see for instance Livio et al., 1992). The X-ray flux would then increase with energy, so it is important to monitor the hard X-ray window. The hard X-rays may also be due to a later phase in the evolution and cooling of the same shocked circumstellar plasma where the gamma rays originated. Hard X-rays were already detected from V745 Sco with Swift almost at the same time as the gamma ray emission (Page et al., 2014), but the range above 10 keV was not observed, and this nova evolves very rapidly.
Recent observations at radio wavelengths indicate that the mass outflow from novae is not a smooth phenomenon, and that new episodes of mass ejection may occur long after maximum (e.g. Nelson et al., 2014). In this scenario, a faster nova wind at some point may collide into a slower, initial nova wind, giving rise to a new burst of X-ray emission. Hard X-rays may also be associated with bipolar outflows (e.g. RS Oph, Sokoloski et al., 2008; Nelson et al., 2008). Finally, it has been speculated that hard X-rays offer diagnostics of the origin of mass outflows. They would be associated with outflow from the white dwarf in an early outburst phase, as opposed to large mass loss occurring later from the secondary (Williams, 2013). Williams (2013) noted that in the X-ray spectra of V382 Vel Orio et al. (2001), and later Ness et al. (2005), did not detect iron lines, and suggested that the X-ray flux is emitted in the same ejecta as the optical “He/N spectrum”, while the “Fe II” emission region is instead due to an outflow from the secondary, occurring without generating any X-ray flux. If the X-ray emitting gas is from the WD, iron lines should not be detectable. However, we do know that at least RS Oph had a clear iron emission feature, at least immediately after the outburst (Sokoloski et al., 2006; Bode et al., 2006).
Because of all these reasons, it is crucial to monitor X-rays from novae since the beginning of the eruption, in order to understand when the hard X-ray emission starts and whether there is a single emission region for the gamma and hard X-rays. The NuSTAR satellite is ideal for following the early X-ray emission of a nova shell, because of its broad energy range up to 79 keV and its excellent sensitivity in the iron lines region around 7 keV.
2 A remarkable recurrent nova
V745 Sco is a remarkably fast nova, and one of only a handful of recurrent novae (RN) with giant secondaries (Duerbeck, 1989; Sekiguchi et al., 1990; Williams et al., 1991). An orbital period of 51020 days has been proposed (Schaefer 2009), but it has not been confirmed by OGLE data (Mróz et al., 2014). Such novae are thus also symbiotic stars, a spectroscopic definition of an interacting binary with a hot component and a cold, luminous one (a red giant, supergiant or AGB star). Symbiotics usually contain an accreting compact object, a white dwarf in the vast majority of cases.
V745 Sco is the fastest Galactic nova. Three outbursts were observed in 1937, 1989 and 2014, all characterized by a very rapid decline of the light curve (t2=2 day and t3=4 days were the times to decay by 2 and 3 magnitudes, respectively, in the AAVSO light curves of 2014). Each time the ejecta expanded at very high velocity (Duerbeck, 1989; Banerjee et al., 2014). Because the outbursts evolved so rapidly, we cannot rule out that they occur more frequently and have not been observed each time. Dürbeck (1989) described the 1989 outbursts and classified the nova as a symbiotic system because of the TiO bands, clearly detected already in outburst, which are typical of an M6 III spectral type. In subsequent observations in quiescence the secondary was classified in the range M62 III, depending on indicators in the infrared and optical spectrum (see brief review by Banerjee et al., 2014). V745 Sco was observed in X-rays in quiescence in 2010, and appeared as a faint, absorbed X-ray source (Luna et al., 2014). Despite poor statistics, Luna et al. (2014) performed a “tentative fit” with an absorbed optically thin thermal plasma at temperature kT 10 keV and N(H)1.5 cm-2 and attributed the X-ray emission to a disk boundary layer.
Already at the beginning of the outburst, long before the nebular phase, a strong and broad [O III] line was detected in the optical spectrum at 5007 Å. This line seems to be clearly associated with the red giant wind and not with the nova outflow (Duerbeck, 1989). A [Fe II] line was present from the beginning, and within two weeks the nova showed a coronal spectrum with other strong coronal lines of high excitation potential, including [Fe VII], [Fe X], [Fe XI], [Fe XIV], and [Ni XII]. The early evolution after the discovery on 2014, February 6, (R. Stubbings, AAVSO special notice no. 380) has been described in a number of Astronomer’s Telegrams (see e.g. Anupama et al., 2014; Page et al., 2014; Rupen et al., 2014). Banerjee et al. (2014) have described the development of the infrared spectrum: the ejecta initial velocity exceeded 4000 km s-1, and there was no “free expansion stage”, but only a Sedov-Taylor expansion, indicating a violent shock at the beginning of the outburst, in a region of high density material already present before the explosion.
Fermi detected the nova in gamma rays at a 2 and 3 level on the first day after the outburst was announced (Cheung et al., 2014). Hard X-rays were also observed with Swift on the same day, and could be fitted with a thermal spectrum with kT8 keV (Mukai et al., 2014).
3 The NuSTAR Observation
V745 Sco was observed with NuSTAR 10 days after the announced optical discovery on 2014 February 16 at 00:51:07 UT in a net, not continuous exposure lasting 22.5 kiloseconds, ending at 12:51:07 UT. NuSTAR, the first focusing hard X-ray telescope in 3-79 keV energy range, consists of two co-aligned telescopes with two focal planes, FPMA and FPMB (Harrison et al. 2013). The data were processed and screened using the standard pipeline for on-axis point sources (NUPIPELINE) in the NuSTAR Data Analysis Software (NUSTARDAS) version 1.3.1, recently included in the HEASOFT distribution. The NuSTAR calibration database (CALDB) version 20131223 was used throughout the analysis. The light curves and the spectra were extracted from the cleaned event files using NUPRODUCTS tool. The source photons were extracted from a circular region centered on the source position with a radius of 60 arcsec. A detailed background model for the source position in each of the two NuSTAR telescopes was derived by using the nuskybgd tool (Wik et al. 2012) to fit blank sky regions covering the entire field of view for each focal plane. This is more accurate than the usual method of simply scaling from the background of a nearby blank sky region, especially for faint sources, because it correctly accounts for gradients across the detectors.
By the time of the NuSTAR observation, the central supersoft X-ray source was the dominant source of X-ray flux (see e.g. Page et al. 2014b), but it is not observable in NuSTAR’s bandpass. The count rates measured with the two telescopes in different ranges are reported in Table 1. A luminous source was detected up to about 20 keV, and above this energy the observation is dominated by the background. The flux was 1.68 erg cm-2 s-1 in the 3-20 keV range. The upper limit for the flux in the 20-70 keV range is erg cm-2 s-1.
| Range (keV) | FPMA cts/s | FPMB cts/s |
|---|---|---|
| 3-79 | 0.33540.0040 | 0.31580.0039 |
| 3-20 | 0.33490.0039 | 0.31540.0038 |
| 3-10 | 0.32410.0038 | 0.30460.0037 |
| 10-20 | 0.00950.0007 | 0.00980.0007 |
We clearly detect the unresolved iron He-like triplet at 6.730.02 keV, with an equivalent width of about 1 keV. We show in the next Section that the flux and plasma temperature are consistent with those derived analysing a Swift observation done while the NuSTAR exposures were ongoing (observation id. 00033136033), however, the Swift spectrum in the SSS phase requires an extremely hot and luminous stellar atmosphere, which cannot be observed at all in the NuSTAR range.
| Parameter | NuSTAR | Swift | Swift* | Swift & NuSTAR | Swift & NuSTAR * | |
|---|---|---|---|---|---|---|
| 3-10 keV | 0.3-10 keV | 0.3-10 keV | 0.3-79 keV | 0.3-79 keV | ||
| N(H) (1021 cm-2) | 1.15 | 8.7 | 6.8 | 8.0 | 6.9 | |
| kTc1 (keV) | 2.66 | 1.62 | 2.77 | 2.76 | 2.76 | |
| kTc2 (keV) | 0.068 | 0.86 | 0.83 | 0.87 | ||
| Fe/Fe⊙ | 0.51 | 0.51 | 0.51 | 0.51 | 0.51 | |
| Teff (105 K) | 9.81 | 10.00.2 | 9.790.04 | 10.0 | ||
| F(0.3-1 keV) | 1.71 | 1.81 | 1.66 | 1.81 | ||
| Fc1 | 1.60 | 4.02 | 3.95 | 2.97 | 3.04 | |
| Fc2 | 4.31 | 1.70 | 1.91 | 1.90 | ||
| Ftot | 1.60 | 2.11 | 2.26 | 2.16 | 2.39 | |
| Ftot,u | 1.62 | 3.66 | 3.66 | 7.39 | 3.81 | |
| /d.o.f. | 1.3 | 2.3 | 1.06 | 1.6 | 1.3 |
4 Spectral fits and additional Swift data
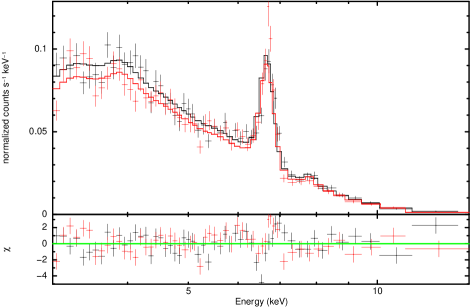
A fit to the NuSTAR spectrum is shown in Fig. 1 and Table 2, using an XSPEC “VAPEC” model of plasma in collisional ionization equilibrium at kT=2.66 keV, flux 1.6 erg cm-2 s-2 and iron abundance [Fe/Fe⊙]=0.51. This best fit yields a reduced value of 1.3. We were not able to obtain a better fit with different models, even by adding more model components. From the emission measure fit we can obtain the average electron density of the ejecta emitting the X-rays, by making an assumption about the distance traveled by the ejecta. The work of Banjeree et al. (2014) is very useful, because these authors measured the velocity on different dates. They comment that the velocity law can be fitted with a third degree polynomial law, but they do not specify how their fit in their figure 3 was obtained. To find the range of interest of the electron density we can simply assume that radius of an idealized spherical shell would be smaller that reached with the initial epansion velocity (4825 km s-1), but larger than reached with the velocity at day 10.3 (the time of the NuSTAR observation, that is 1930 km s-1. We thus obtain a value of ne between 4.7 cm-3 and 7.4 cm-3. This range is only indicative of the average value, and is obtained with the assumption that the flux was emitted in a spherical shell around the WD, of homogeneous density. The corresponding mass of the ejecta, if the hard X-ray emission region represents all the ejected mass, would be 5 M⊙. We note that a power law component does not improve the fit, and clearly the data cannot be well fitted with a power law. The prominence of the iron feature is only due to the sensitivity of NuSTAR in the range around 7 keV, but the iron abundance we obtained from the best fit is only [Fe/Fe⊙=0.51. We kept this abundance value fixed in the other fits described below.
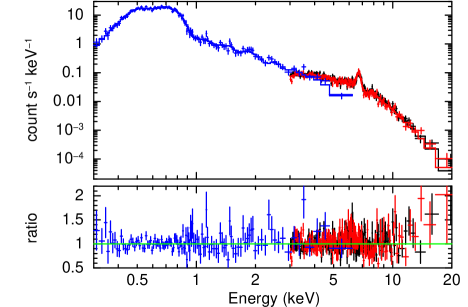
Swift data were taken at semi-regular intervals of half a day or less, and those obtained just a few hours before the NuSTAR exposure (2014 February 16 1:35:17 UT for an exposure time of 1038 s, observation 00033136033) explain the difficulty in finding an optimal fit: the central source is more luminous than the nova shell and the lower limit of the NuSTAR bandpass is higher than the energy at which most of the X-rays are emitted. The soft part of the spectrum is very luminous and probably due to more than one emission mechanism, so the range around 3 keV is not well constrained. The full Swift dataset describing the nova evolution with snapshot exposures taken even three times a day is being analysed by the Swift team with several coauthors (Page et al. 2014c, in preparation), but here suffice it to say that we checked two additional exposures taken a few hours after the NuSTAR one and did not find significant spectral evolution in this short time. The large luminosity of the supersoft source (see Fig. 2) is still below a critical threshold of about 50 cts s-1 that may cause pile-up for the supersoft sources in windowed timing mode, used for this observation. In Table 2 we report the results of two fits of the Swift spectrum of this observation. In the first one we used a stellar atmosphere at 930,000 K (Rauch 2010, model ), a low temperature plasma VAPEC model component in XSPEC at 68 eV, and a third a component, VAPEC at about 1.6 keV, obtaining a value 2.3 for the reduced . We cannot improve the fit with additional components, but it improves by using a blackbody with an oxygen absorption edge at 0.87 keV of arbitrary depth. An even better fit was obtaining by superimposing additional emission features of oxygen on the VAPEC models, H-like Lyman at 0.65 keV and a blended He-like triplet at 0.57 keV. The fit results statistically acceptable, with . The total flux is 2.26 erg cm-2 s-1, largely due to the supersoft source, with an unabsorbed flux 3.66 erg cm-2 s-1. The physical reason behind the need to add these “artificial” features is not due to an unusually high oxygen abundance in the plasma component. We did not have available grids of atmospheric models with a lower oxygen abundance, so that the oxygen absorption features were too deep and needed to be “corrected”. Since atmospheric models with appropriate abundances are not available yet, we resorted to this arbitrary addition.
The best fit to the Swift and the NuSTAR spectra together is shown in Fig. 2, with the parameters in Table 2. We can constrain the hotter component and the value of N(H) using both sets of X-ray telescopes, and obtain N(H)=(6.90.9) 1021 cm-2, while the hot plasma has kT=2.76 keV. We note that N(H) is higher than the value cm-2 that one would expect applying e.g. the relationship derived by Güver & Özel (2009) to the interstellar reddening E(B-V)=0.7 given in Banerjee et al. (2014), impling a certain amount of intrinsic absorption, likely due to the red giant wind.
5 Conclusions
The observation of the very fast RN V745 Sco with NuSTAR 10 days after the discovery of the optical outburst and the observed maximum indicates that the hard X-ray emitting region at this stage had already cooled. We rule out plasma components hotter than 2.8 keV. Hard X-ray emission due to Comptonized gamma rays can also be ruled out because it would produce a power law spectrum with copious flux above 20 keV (e.g. Livio et al., 1992), which was not observed in the high energy band of NuSTAR.
The threshold detection flux of Fermi is of the order of 10-10 erg cm-2 s-1, so we do not know whether there was gamma-ray emission with flux below this level, but hard X-rays are also an important indicator of gamma rays because the flux due to Comptonized down-scattered photons should be measurable. The optical depth of Compton scattering is
where ne is the electron density and the Thomson cross section is =6.6524 cm2. Adopting n cm-3 derived above, and assuming that the photons have to cross a region of depth D as large as the distance to which the ejecta at have expanded in 10 days. Given the range of velocities from the first and tenth day (Banerjee et al. 2014, see above), 1.7 cmD cm, so we derive te to be in the range 1.1-2.8 . Optical depth t indicates that the ejecta are optically thin to the Comptonized radiation, which should be clearly detectable for V745 Sco.
Do we have enough material in the shell to degrade the gamma-ray photons to X-rays with a significant Comptonized flux? Livio et al. (1992) calculated the X-ray light curve due to Comptonized gamma rays in the case of the radioactive decay of 22Na, at the specific fixed energy of the line at 1.22 MeV, which is two orders of magnitude lower than the lower range of the continuum gamma-ray emission of V745 Sco detected with Fermi. Despite the different gamma-ray range, these authors’ Monte Carlo simulations should be relevant also for V745 Sco. In Livio et al. (1992) a peak of X-ray emission of order of one hundredth the value of the gamma-ray flux was predicted 200 days after the burst of gamma-ray emission, for ejecta with mass of 10-5 M⊙ and a residual velocity of 10 km s-1. The time to reach peak emission is directly proportional to the ejected mass and inversely proportional to its expansion velocity. Since the ejecta mass in a fast RN like V745 Sco is likely to be at least a factor of 10 lower than above, and the ejecta velocity after 10 days was still 200 times higher, a straightforward analogy would imply that the maximum emission of Comptonized X-rays for V745 Sco is expected within a few hours. The flux in our case should decay very quickly, like in the case analysed by Livio et al. (1992), peaking at a value around one hundredth the value of the gamma-ray flux. The upper limit for X-ray flux above 50 keV measured with NuSTAR is about 10-13 erg cm-2 s-1, roughly translating into an upper limit estimate of the gamma ray flux 10 days after the outburst of V745 Sco of the order of 10-11 erg cm-2 s-1.
We attribute the X-ray flux we measured with NuSTAR to shocks in the ejected shell, most likely as they impacted the red giant wind of the companion, like in the cases of V407 Cyg and RS Oph. We cannot tell at this stage whether the emission was due to the same region where the gamma rays originated on the first day, but it appears that in RN nova shells there are multiple regions of shocked material at different temperatures.
Acknowledgements
We wish to acknowledge the support of the following awards and funding agecies: M. Orio of ASI (Italian Space Agency) through an INAF-ASI grant, J.L. Sokoloski of the NSF award AST-1211778, and K.L. Page of the UK Space Agency funding the UK Swift Science Data Centre.
References
- Abdo et al. (2010) Abdo A. A., Ackermann M., Ajello M., Atwood W. B., Baldini L., Ballet J., Barbiellini G., Bastieri D., Bechtol K., Bellazzini R., et al. 2010, Science, 329, 817
- Anupama et al. (2014) Anupama G. C., Selvakumar G., Moorthy V., Velu C., Dinakaran N., 2014, The Astronomer’s Telegram, 5871, 1
- Banerjee et al. (2014) Banerjee D. P. K., Joshi V., Venkataraman V., Ashok N. M., Marion G. H., Hsiao E. Y., Raj A., 2014, ApJ, 785, L11
- Bode et al. (2006) Bode M. F., O’Brien T. J., Osborne J. P., Page K. L., Senziani F., Skinner G. K., Starrfield S., Ness J.-U., Drake J. J., Schwarz G., Beardmore A. P., Darnley M. J., Eyres S. P. S., Evans A., Gehrels N., Goad M. R., Jean P., Krautter J., Novara G., 2006, ApJ, 652, 629
- Cheung et al. (2014) Cheung C. C., Jean P., Shore S. N., 2014, The Astronomer’s Telegram, 5879, 1
- Duerbeck (1989) Duerbeck H. W., 1989, The Messenger, 58, 34
- Güver & Özel (2009) Güver T., Özel F., 2009, MNRAS, 400, 2050
- Livio et al. (1992) Livio M., Mastichiadis A., Oegelman H., Truran J. W., 1992, ApJ, 394, 217
- Lloyd et al. (1992) Lloyd H. M., O’Brien T. J., Bode M. F., Predehl P., Schmitt J. H. M. M., Truemper J., Watson M. G., Pounds K. A., 1992, Nature, 356, 222
- Luna et al. (2014) Luna G. J. M., Pillitteri I., Mukai K., Sokoloski J. L., 2014, The Astronomer’s Telegram, 5881, 1
- Martin & Dubus (2013) Martin P., Dubus G., 2013, A&A, 551, A37
- Metzger et al. (2014) Metzger B. D., Hascoët R., Vurm I., Beloborodov A. M., Chomiuk L., Sokoloski J. L., Nelson T., 2014, MNRAS, 442, 713
- Mróz et al. (2014) Mróz P., Poleski R., Udalski A., Soszyński I., Szymański M. K., Kubiak M., Pietrzyński G., Wyrzykowski Ł., Ulaczyk K., Kozłowski S., Pietrukowicz P., Skowron J., 2014, MNRAS, 443, 784
- Mukai & Ishida (2001) Mukai K., Ishida M., 2001, Apj, 551, 1024
- Mukai et al. (2014) Mukai K., Page K. L., Osborne J. P., Nelson T., 2014, The Astronomer’s Telegram, 5862, 1
- Nelson et al. (2014) Nelson T., Chomiuk L., Roy N., Sokoloski J. L., Mukai K., Krauss M. I., Mioduszewski A. J., Rupen M. P., Weston J., 2014, ApJ, 785, 78
- Nelson et al. (2008) Nelson T., Orio M., Cassinelli J. P., Still M., Leibowitz E., Mucciarelli P., 2008, Apj, 673, 1067
- Ness et al. (2005) Ness J.-U., Starrfield S., Jordan C., Krautter J., Schmitt J. H. M. M., 2005, MNRAS, 364, 1015
- Orio (2012) Orio M., 2012, Bulletin of the Astronomical Society of India, 40, 333
- Orio et al. (2013) Orio M., Behar E., Gallagher J., Bianchini A., Chiosi E., Luna G. J. M., Nelson T., Rauch T., Schaefer B. E., Tofflemire B., 2013, MNRAS, 429, 1342
- Orio et al. (2001) Orio M., Parmar A., Benjamin R., Amati L., Frontera F., Greiner J., Ögelman H., Mineo T., Starrfield S., Trussoni E., 2001, MNRAS, 326, L13
- Page et al. (2014) Page K. L., Osborne J. P., Beardmore A. P., Mukai K., 2014, The Astronomer’s Telegram, 5870, 1
- Rohrbach et al. (2009) Rohrbach J. G., Ness J.-U., Starrfield S., 2009, AJ, 137, 4627
- Rupen et al. (2014) Rupen M. P., Mioduszewski A. J., Chomiuk L., Sokoloski J., Nelson T., Mukai K., 2014, The Astronomer’s Telegram, 5884, 1
- Sekiguchi et al. (1990) Sekiguchi K., Whitelock P. A., Feast M. W., Barrett P. E., Caldwell J. A. R., Carter B. S., Catchpole R. M., Laing J. D., Laney C. D., Marang F., van Wyk F., 1990, MNRAS, 246, 78
- Sokoloski et al. (2006) Sokoloski J. L., Luna G. J. M., Mukai K., Kenyon S. J., 2006, Nature, 442, 276
- Sokoloski et al. (2006) Sokoloski J. L., Mukai K., Luna G. J. M., 2006, The Astronomer’s Telegram, 737, 1
- Sokoloski et al. (2008) Sokoloski J. L., Rupen M. P., Mioduszewski A. J., 2008, ApJ, 685, L137
- Tofflemire et al. (2013) Tofflemire B. M., Orio M., Page K. L., Osborne J. P., Ciroi S., Cracco V., Di Mille F., Maxwell M., 2013, ApJ, 779, 22
- Williams (2013) Williams R., 2013, AJ, 146, 55
- Williams et al. (1991) Williams R. E., Hamuy M., Phillips M. M., Heathcote S. R., Wells L., Navarrete M., 1991, ApJ, 376, 721