Mixed mode synchronization and network bursting of neurons with post-inhibitory rebound
Abstract
We study activity rhythms produced by a half-center oscillator – a pair of reciprocally coupled neurons that are capable of producing post-inhibitory rebounds. Network (coupling-induced) burstings possessing two time scales, one of fast spiking and another of slow bursting and quiescent periods, are shown to exhibit nontrivial synchronization properties. We consider several network configurations composed of both endogenously bursting, tonic spiking and quiescent neurons, as well as various mixed combinations. We show that synchronization at low frequency of bursting can be accompanied by complex, sometimes chaotic, patters of fast spikes.
This study is focused on the mechanisms of rhythmogenesis and robustness of anti-phase bursting in half-center-oscillators (HCOs) consisting of two reciprocally inhibitory coupled neurons. There is a growing body of experimental evidence that a HCO is a universal building block for larger neural networks, including central pattern generators (CPGs) controlling a variety of locomotion behaviors in spineless animals and mammals. It remains unclear how CPGs achieve the level of robustness and stability observed in nature. There has been a vastly growing consensus in the community of neurophysiologists and computational researchers that some basic structural and functional elements are likely shared by CPGs of both invertebrate and vertebrate animals. In this study we consider several configurations of HCOs including coupled endogenous bursters, tonic spiking, and quiescent neurons, that become network bursters only when coupled by fast inhibitory synapses through the mechanism of post-inhibitory-rebound (PIR). The goal is better understanding the PIR mechanism as a key component for robust anti-phase bursting in generic HCOs.
I Introduction
Synchronization of coupled oscillators is a fundamental phenomenon in nonlinear systems that has been observed in a wide range of diverse applications Pikovsky, Rosenblum, and Kurths (2003). The mathematical concept of synchronization, first introduced and developed for periodic oscillators Shilnikov, Shilnikov, and Turaev (2004), has further been generalized for other aperiodic systems, including ones with chaotic dynamics. In life sciences, of a keen interest is synchronization or phase locking among oscillators with multiple time scales. They may include mixed-mode and slow-fast relaxation-type oscillators Desroches et al. (2012), whose synergetic interaction can give rise to the onset of a variety of synchronization patterns Jalil, Belykh, and Shilnikov (2010); Omelchenko, Rosenblum, and Pikovsky (2010); Jalil, Belykh, and Shilnikov (2012); Wojcik et al. (2014). In neuroscience, a plethora of rhythmic motor behaviors with diverse time scales, such as heartbeat, respiration, chewing, and locomotion on land and in water are produced and governed by neural networks called Central Pattern Generators (CPGs) Selverston (1985); Marder and Calabrese (1996). A CPG is a microcircuit of neurons that is able to autonomously generate an array of polyrhythmic bursting patterns, underlying various motor behaviors.
Endogenous (self-sustained) bursting and network (coupling-induced) bursting are composite oscillatory behaviors, featuring active phases during which a neuron or a group of neurons generates trains of fast action potentials, which are alternated with long interburst intervals during which it remains inactive or quiescent, until a new cycle of bursting occurs. In this paper we examine synchronization of bursting patterns emerging through interactions of two interneurons coupled reciprocally by fast inhibitory synapses. This study has been driven by two major motivations: first, a general one concerning questions on synchronization of mixed-mode oscillators. The second is a neuroscience related one, aimed at understanding of intrinsic mechanisms of rhythmogenesis in CPGs composed, often symmetrically, of such small networks of interneurons, as outlined below. It is still unclear how CPGs can achieve the level of synergy and robustness to produce a plethora of rhythmic patterns observed in nature.
Recent experimental and theoretical studies have disclosed a distinct role of CPGs in generation of adaptive and coordinated motor activity of animals Marder and Calabrese (1996); Gillner and Wallen (1985); Rabinovich et al. (2006); Shaw et al. (2014). An important feature of CPGs is their ability to produce various types of rhythmic bursting activity, what causes flexible and adaptive locomotion of an organism. To robustly govern motor patterns, CPGs are able to flexibly adjust their oscillatory properties (such as bursts duration, frequency of spiking, phase relations of bursts) due to feedback from sensory inputs, for example, in response to changes of environment Marder and Calabrese (1996); Gillner and Wallen (1985). Up to a certain extent, the flexibility of CPG behaviors may be attributed to its multistability (of several coexistent attractors representing different bursting rhythms in a phase space of the dynamical system) allowing for fast switching between operating modes Schwabedal, Neiman, and Shilnikov (2014); Wojcik et al. (2014).
From the theoretical point of view, a CPG is modeled as a small network of coupled oscillatory, or quiescent, interneurons, each described by a system of nonlinear ordinary differential or difference equations (dynamical system) Rabinovich et al. (2006); Izhikevich (2007). The study of CPGs allows one to develop a general understanding of synchronization patterns in mixed-mode oscillators, applicable to systems of different physical and biological origin.
There is a growing body of experimental evidence that a universal building block of most identified CPGs is a half-center oscillator (HCO) Hill, Van Hooser, and Calabrese (2003). A HCO is a pair of two reciprocally inhibitory interneurons bursting in alternation. Such a pair can be composed of endogenously bursting interneurons, as well as of endogenously tonic spiking or quiescent ones that start bursting only when they are coupled in a network. Theoretical studies Wang and Rinzel (1985); Daun, Rubin, and Rybak (2009) have indicated that formation of an anti-phase bursting rhythm is always based on some slow subsystem dynamics. The slow subsystem is strongly associated with the slow membrane current, such as persistent sodium current or slow calcium-dependent current; following Destexhe et al. (1994) we term currents associated with slow-varying concentrations and gating variables as slow ones. There are three basic mechanisms to generate alternating bursting in the HCO: release, escape, and post-inhibitory rebound (PIR). The first mechanism is typical for endogenously bursting neurons Jalil, Belykh, and Shilnikov (2010, 2012). The other two mechanisms underlie network bursting in HCOs comprised of neurons which are depolarized or hyperpolarized quiescent interneurons, respectively, in isolation Perkel and Mulloney (1974); Skinner, Kopell, and Marder (1994); Angstadt et al. (2005); Marder and Calabrese (1996); Kopell and Ermentrout (2002)
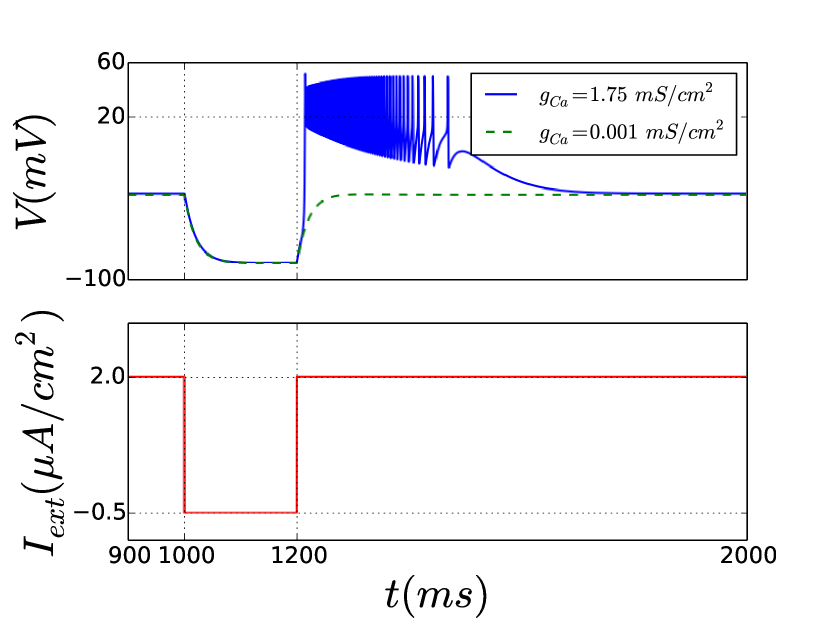
The PIR mechanism uses reciprocal inhibition to keep network bursting. It triggers an onset of a single or a series of action potentials in the post-synaptic neuron after it has been prolongedly hyperpolarized and abruptly released from inhibition generated by the pre-synaptic neuron during an active, tonic spiking phase of bursting. After that, the neurons of the HCO swap their opposite roles to repeat the PIR mechanism. The PIR promotes the action potential generation after a period of sufficiently strong hyper-polarizing (inhibiting) input, as illustrated in Fig. 1. PIR is often caused by a low-threshold activated calcium current in neurons and their biophysically plausible models.
This paper examine the PIR contribution to formation, synchronization and robustness of bursting rhythms in inhibitory coupled neurons. Here, we employ a modification of the Hodgkin-Huxley-type model introduced in Destexhe et al. (1994), to plausibly describe the PIR mechanism. Depending on its parameters, the model is known to produce an array of typical neuronal activities such as excitable dynamics, periodic spiking and bursting.
Below we first examine the conditions that confirm and reproduce the PIR mechanism in the neurons. We will argue that the PIR is a pivotal component that promotes an alternating bursting rhythm in the HCO made of intrinsically spiking and excitable neurons. Finally, we will show that the PIR mechanism makes anti-phase network bursting even more robust and easier to initiate in the case of endogenously bursting neurons.
The paper is organized as follows: in Section II we introduce the neuronal model, and discuss its dynamical properties in Section III. Section IV is focused on synchronization properties of a pair of endogenous bursters, while Section IV examines anti-phase bursting onset in coupled tonic-spiking neurons. Sections VI and VII discusses the PIR-mechanisms of the HCO, and synergetic dynamics of mixed neurons: individually tonic spiking and hyperpolarized quiescent.
II Basic Model
In this study we use a neuronal model of the Hodgkin-Huxley type that has been introduced in Destexhe et al. (1994). The basic equations describing the dynamics of the membrane potentials of the neurons read as follows (prime denotes the time derivative, ):
| (1) | ||||
The variable describes evolution of the membrane potential of the -th neuron. The first two terms on the right-hand side of Eq. (1) govern intrinsic dynamics of the neuron: stands for a constant external current applied to the neuron, while term represents the sum of intrinsic ionic currents. The sum of synaptic currents describes the coupling interactions between the neurons. The full details of current representation are given in the Appendix below.
There are two principal control parameters in this system: the external current, , governs the activity type in an isolated, uncoupled neuron. The second parameter, the maximal conductance of the synaptic current given by Eq. (13), controls the coupling strength, and thus the network dynamics of the coupled neurons.
The low-threshold activated calcium current , modeled by Eq. (7) and regulated by the maximal conductance , causes the PIR mechanism in the neurons (1), this effect is illustrated in Fig. 1. Rebound bursts can be triggered by injection of a hyper-polarizing pulse of external current (bottom panel in Fig. 1). If the impact of current is strong enough, the neuron generates bursts of spikes, after recovering from the hyperpolarized quiescent state (top panel in Fig. 1).
III Dynamics of an isolated neuron
Let us first consider the dynamics of an isolated neuron at in Eq. (1). We treat the external current as the primary bifurcation parameter in both computational and biological experiments, which allows one to examine and plausibly model various neuron activities and transitions between them. For the same purpose, we employ interspike intervals (ISIs), which are distances between adjacent spikes generated by the neuron, as measurements characterizing the neuron’s dynamical regimes. Figure 2 serves as an illustration of how the ISIs changes with variations of .
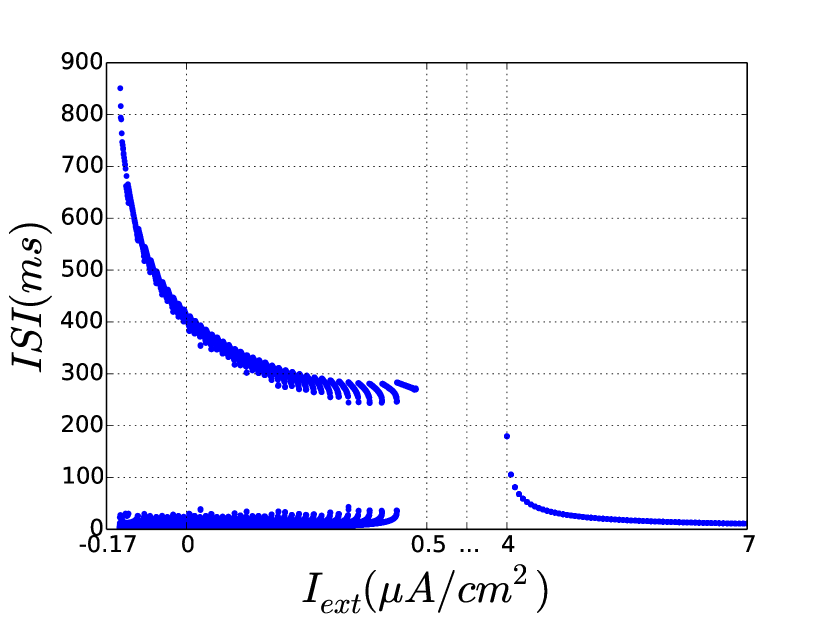
First we describe the neuron dynamics at large values. For the neuron produces tonic spiking activity (corresponding to a stable periodic orbit in the phase space of the model (1)). Here, the value of ISI (which is the period of the stable orbit) is inversely proportional to the -value. The period decreases with increase of , and vice-versa. As one can see from Fig. 2, near a critical value the ISI shows an “unbounded” growth, which is an indication of a bifurcation of the stable periodic orbit with an arbitrarily long period. Detailed examinations indicate the occurrence of a homoclinic saddle-node bifurcation Shilnikov et al. (2001) underlying the transition from tonic spiking activity to hyperpolarized quiescence, represented by a stable equilibrium state at low values of the membrane potential . This stable equilibrium state (a node with real and negative characteristic exponents) persists within the parameter window , where the neuron remains ready for PIRs. Small perturbations of the quiescent state of the neuron have no pronounced effects. Relatively strong perturbations can trigger a spike, after which the neuron comes back to the over-damped quiescence state. With decreases of from the threshold , the steady state becomes a focus. The stable focus loses the stability through a supercritical Andronov-Hopf bifurcation at . These oscillations are not seen in Fig. 2 because they are under the threshold of spike generation. The amplitude of the oscillations increases rapidly as is further decreased. At the shape of the periodic orbit in the phase space changes via the addition of “turns, ” the so-called spike-adding mechanism Channell, Cymbalyuk, and Shilnikov (2007); Channell et al. (2009). Such a periodic orbit is associated with bursting activity, with turns corresponding to spikes within a burst. Bursting that includes two time scales can be recognized in Fig. 2 through two characteristic branches: the bottom branch corresponds to small ISI values due to fast spiking, while the top branch is due to long interburst intervals. More details on geometry of bursting can be found in Izhikevich (2007); Shilnikov (2012). Decreasing the external current makes the bursting neuron more depolarized and increases the number of spikes per burst. Having reached some maximal value of spikes per burst at , decreasing gives rise to bursts with fewer spikes. The value corresponds to the occurrence of another saddle-node bifurcation of equilibria since the time interval between two consecutive bursts becomes arbitrarily large. For the neuron remains quiescent and excitable.
The examination of bifurcations have been repeated for several values of the maximal conductance, , regulating the low-threshold current responsible for PIR in the neuron. We have found that this current bears an insignificant affect on the intrinsic dynamics of the individual neurons, mainly because the membrane potential does not decrease below the threshold value to activate the current. As we will see below, this is not the case for coupled neurons, where the parameter has a pronounced effect on the collective dynamics.
IV Synchronization of two bursting neurons
In this section and sections V-VII below, we explore a repertoire of rhythmic bursting outcomes generated by a HCO of two neurons, coupled reciprocally by fast, non-delayed inhibitory synapses. It is known that such coupled, endogenous bursters can produce a range of synchronous rhythmic outcomes with various fixed phase-lags due to overlapping spike interactions, see Jalil, Belykh, and Shilnikov (2012); Jalil et al. (2013) and references therein.
We will first examine the cooperative dynamics in the network of two coupled neurons ( in Eqs. (1)) with different within the interval . This range of corresponds to endogenous bursting in both neurons. Due to the difference, , the temporal and quantitative characteristics of endogenous bursters such as their period, duty cycles, the spike numbers per burst, are different. The strength of coupling is quantified by the maximal conductance, , of the inhibitory synaptic current . In what follows, we show that while remains relatively small, increasing the coupling strength shall give rise to an onset of synchrony between the neurons with the same bursting period. However, this will no longer be true for larger values.
IV.1 Nearly identical bursters
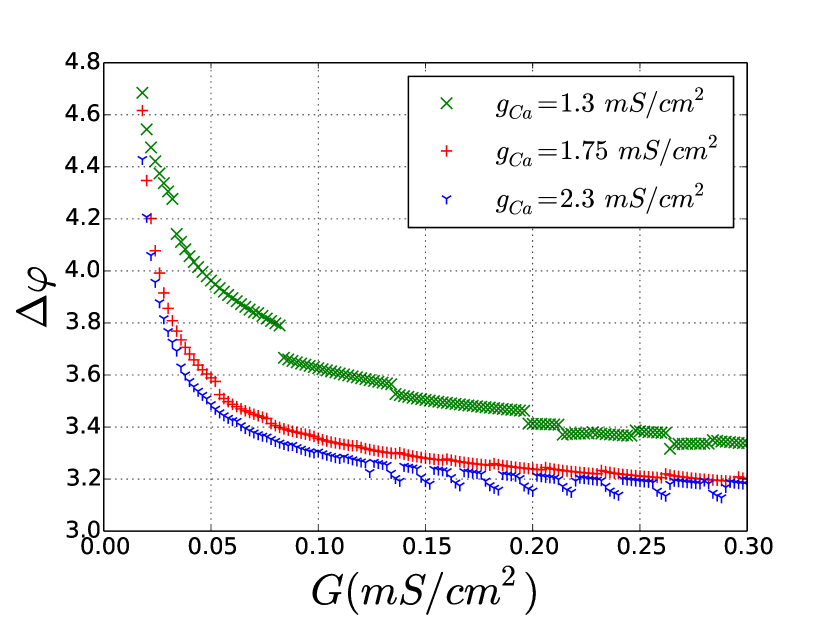
While , synchronous bursting can already occur at a relatively weak coupling. Here, the burst periods of both neurons become equal, however the spike number per burst in the neurons may not be the same. This is shown in Fig. 3, which depicts the dependence of the mean phase-lag between oscillations of the low-threshold -currents in the neurons, on the coupling strength for several values of the conductance . Note that the post-inhibitory rebounds in the neurons under consideration are due to the slowest, low-threshold -current , whose magnitude is controlled by the maximal conductance . It is worth noticing that PIRs occur more reliably with increasing .
Nevertheless, for a broad range of initial condition, the neurons will predominantly burst in anti- phase rather than in-phase. This implies that the HCO can be bi-stable. This observation may shed light on properties of multifunctional CPGs composed of coupled neurons including coupled HCOs, which can switch between multiple functional states associated with different locomotion types. While in-phase bursting appears to be atypical for neurons with fast inhibitory coupling like in our case, the coexistence of anti-phase and in-phase regimes have been reported elsewhere Jalil, Belykh, and Shilnikov (2010, 2012). However, in-phase synchrony can prevail whenever both HCO neurons are driven externally by another inhibiting burster or HCO Belykh and Shilnikov (2008); Shilnikov, Gordon, and Belykh (2008).
Next, we discuss the effects that the PIR activity of the neurons may have on antiphase bursting. Figure 3 discloses how the coupling threshold for the onset of synchronous bursting depends on mismatches between the neurons of the HCO, as well as on the phase-locked frequency of slow -oscillations. The increasing phases, defined on modulo , of the neurons are reset at the very beginning of each burst. Figure 3 shows the evolution of the phase lag, , between the oscillations by the slow gating variables, , for inactivation of the low-threshold -current, which is is plotted against the coupling constant for various -values. We found in most cases that the phase lag tends eventually to , i.e. the anti-phase bursting occurs in the HCO, with the coupling strength above a critical value. Depending on , the actual -value may deviate from . One can see from Fig. 3 that increasing (promoting stronger post-inhibitory rebound activity) leads to quite symmetric antiphase bursting even at small values of the coupling strength. This is an explicit manifestation of the contribution of the slow low-threshold -current in fostering the antiphase synchronization between the bursting neurons in the HCO.
IV.2 Bursters far from identical
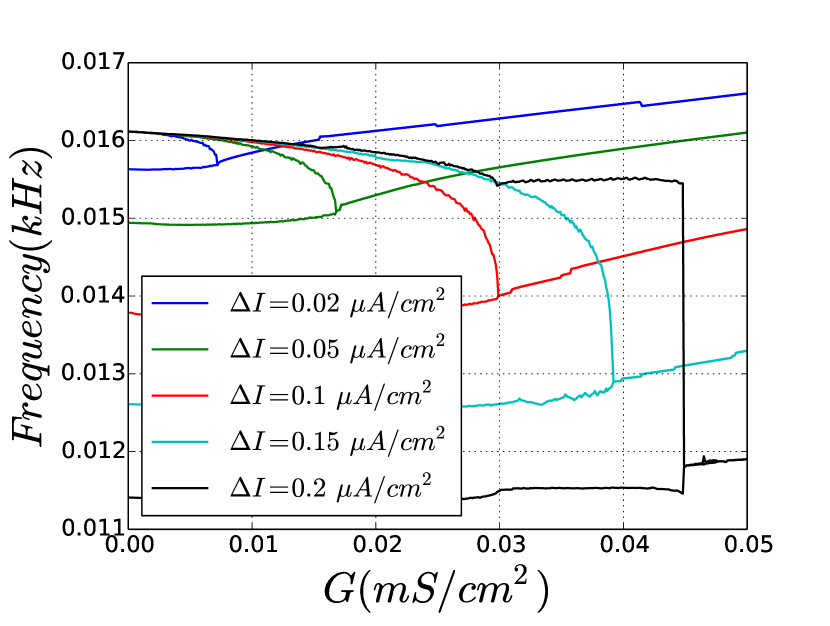
Increasing between coupled oscillators leads to an array of pronounced synchronization effects. Figure 4 represents the slow (bursting) frequencies plotted against coupling strength, , at several values. One observes the presence of overlapping branches at low -values. This indicates that the coupled neurons generate bursting activities at different frequencies, until the coupling is increased over a threshold value at which both branches merge. This threshold value becomes higher with increases of , as the individual neurons become more and more different. We note from this figure that for the largest case , the HCO neurons become locked at the 4:3 frequency ratio, prior to the occurrence of the ultimate 1:1 frequency locking at higher coupling values.
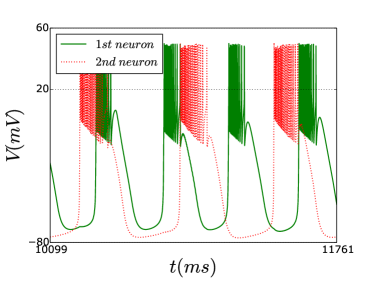
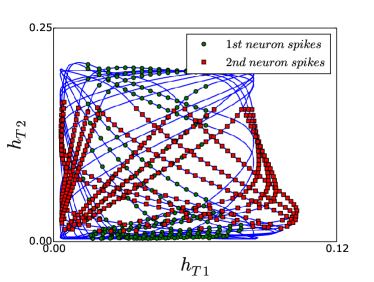
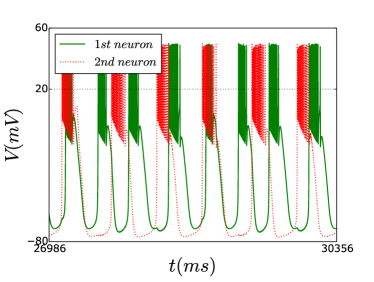
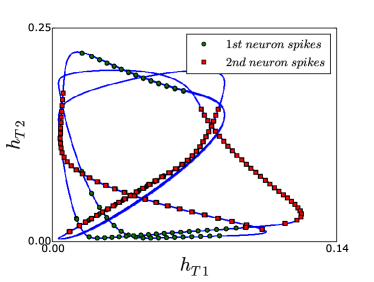
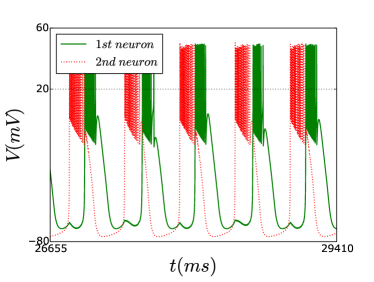
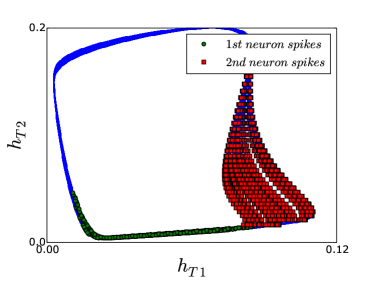
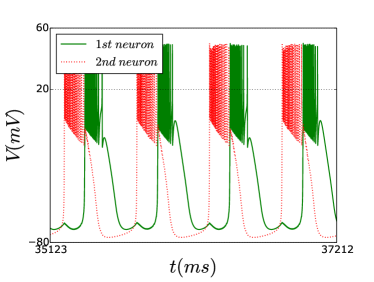
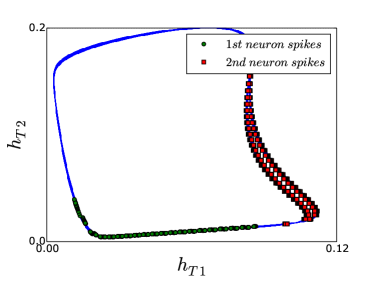
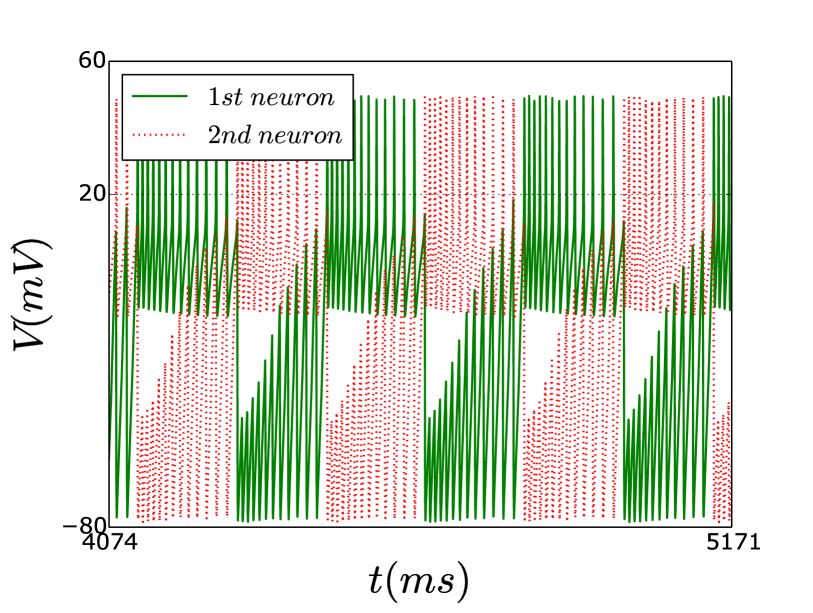
Figure 5 illustrates transitions to synchrony for the largest case . The left panels demonstrate the established antiphase bursting in voltage traces produced by the HCO at various values of the coupling strength, , below and above the threshold. The right panels represent the so-called Lissajous curves, which are parametrically traced down by the slow variables and of both neurons. These curves help to interpret the corresponding types of frequency locking including quasi-periodic dynamics. On these curves we mark timing of individual spikes.
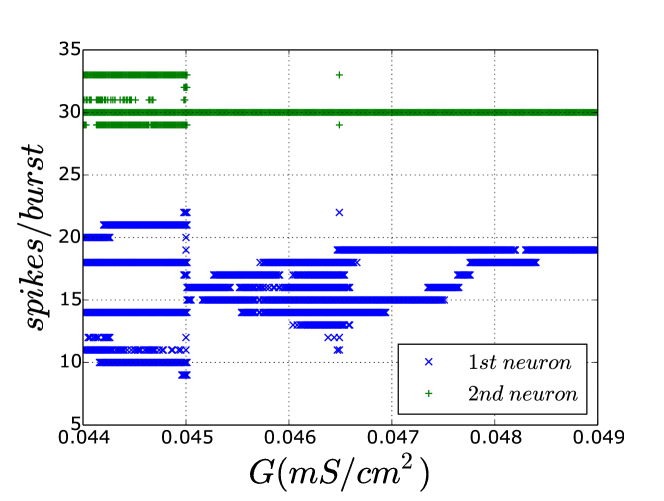
It is worth noticing that such a large makes the phases of slow oscillations shift closer to , rather than to . With a phase shift, active phases of bursting in the neurons partially overlap, showing the emergence of complex dynamics caused by spike interactions. To understand these dynamics, we evaluated the distribution of numbers pf spikes per burst for several coupling strengths. Our findings are presented in Fig. 6. It is clear from this figure that the transition to the 1:1 locking occurs at . Moreover, our simulation indicated that there is a small window, , of hysteresis occurring at the transition. Figure 6 reveals a pecular feature of the synchronous state, existing at strong coupling : while the spike number in bursts generated by neuron 2 remains nearly constant, the number of spikes in bursts by neuron 2 deviates quite strongly before it becomes fixed with stronger coupling.
From the two bottom insets in Fig. 5 one can observe that depending on coupling strengths the 1:1 locking features chaotic and periodic modulations via the slow gating variables of the neurons. In the chaotic case, the number of spikes per burst in either neuron or both neurons will vary while the alternating bursting in the HCO persist locked at an 1:1-ratio within a windows . This is an explicit manifestation of the phenomena of chaotic phase synchronization Omelchenko, Rosenblum, and Pikovsky (2010).
V Antiphase bursting out of spiking neurons
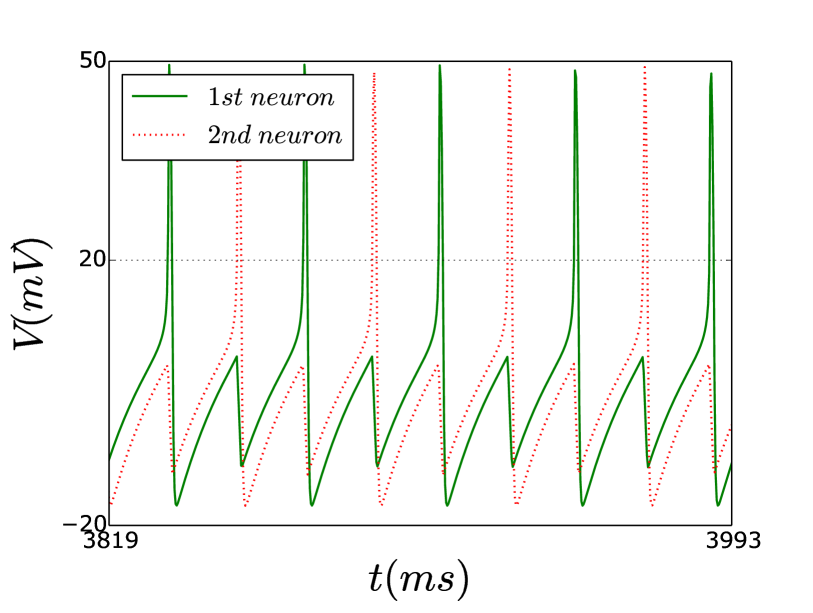
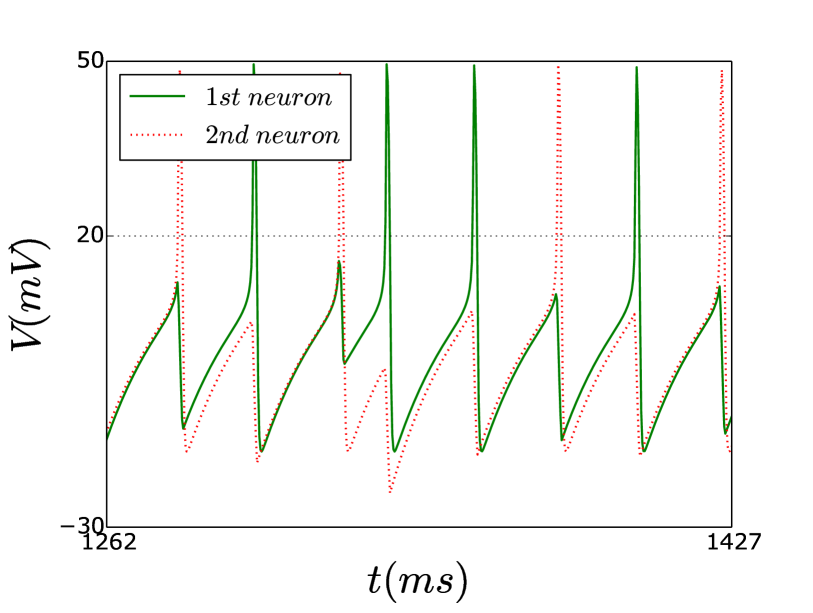
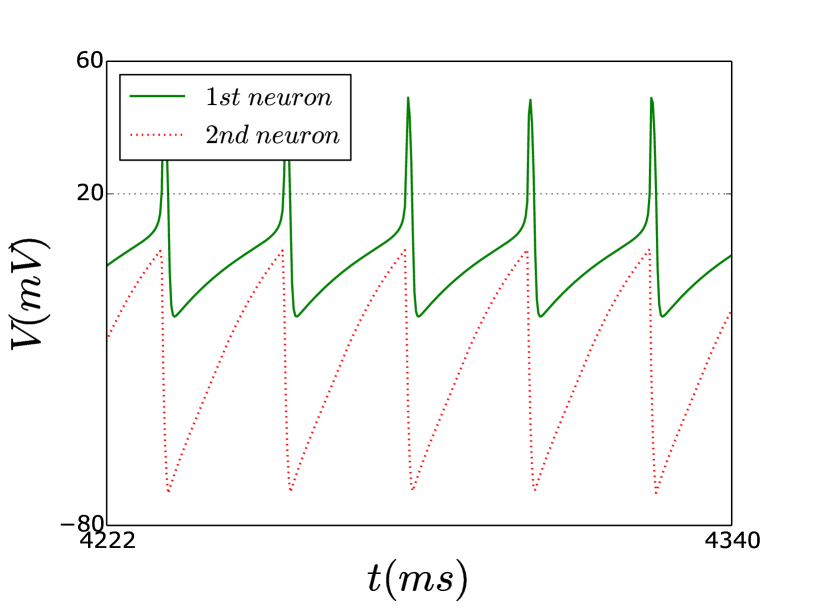
In this section we study emergence of alternating bursting in a HCO made of two coupled neurons that are tonically spiking in isolation at with relatively small . Our goal is to reveal how increasing the inhibitory coupling strength transforms such tonic spikers into network bursters, as illustrated in Fig. 7.
Weak coupling gives rise to periodic antiphase tonic spiking in the network at (Fig. 7(a)). With further increases of the coupling strength, the HCO neurons evolve through a window of irregular, unreliable spiking at , towards an asymmetric network dynamics. In this robust regime, either neuron generates tonic spiking activity, while the other one is forced to produce sub-threshold oscillations of quite a large amplitude, such as ones shown in Figs. 7(b,c) at at . A dramatic increase in the inhibitory coupling strength beyond finally forces the neurons to begin bursting in alternation.
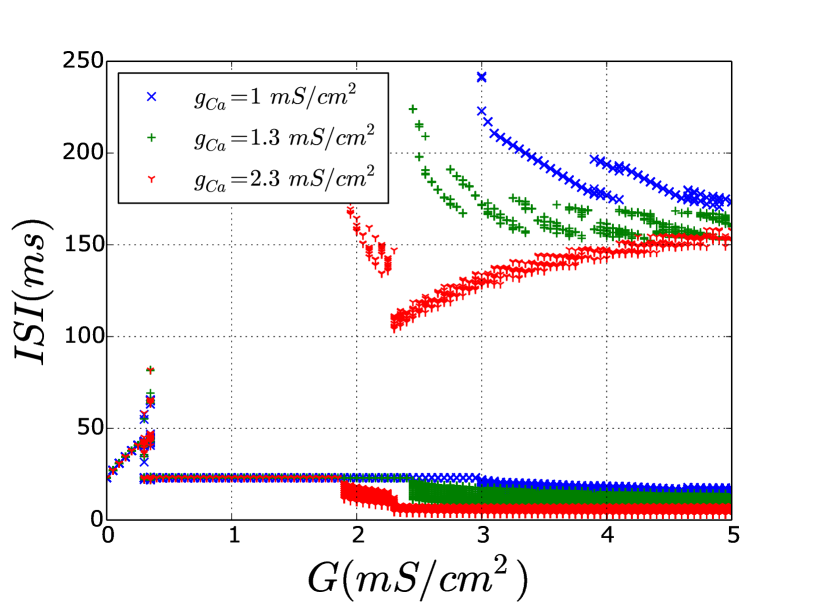
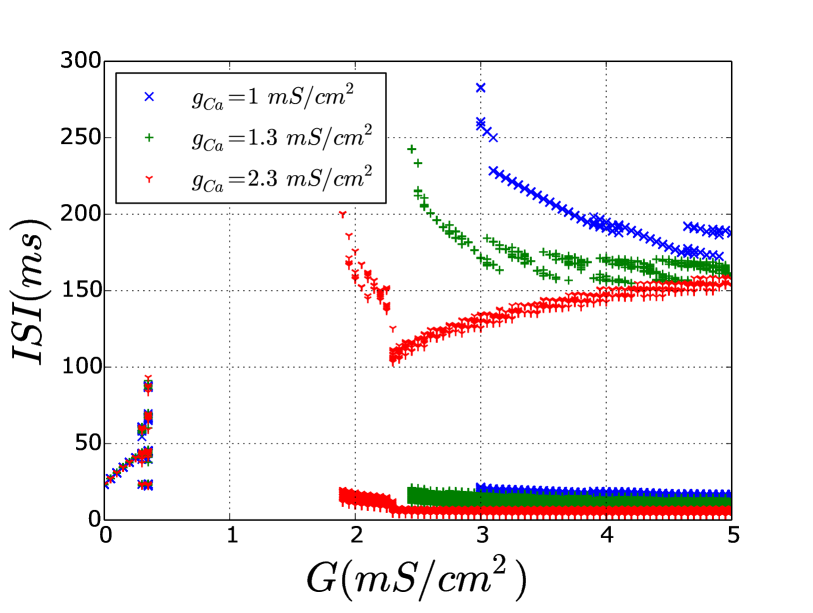
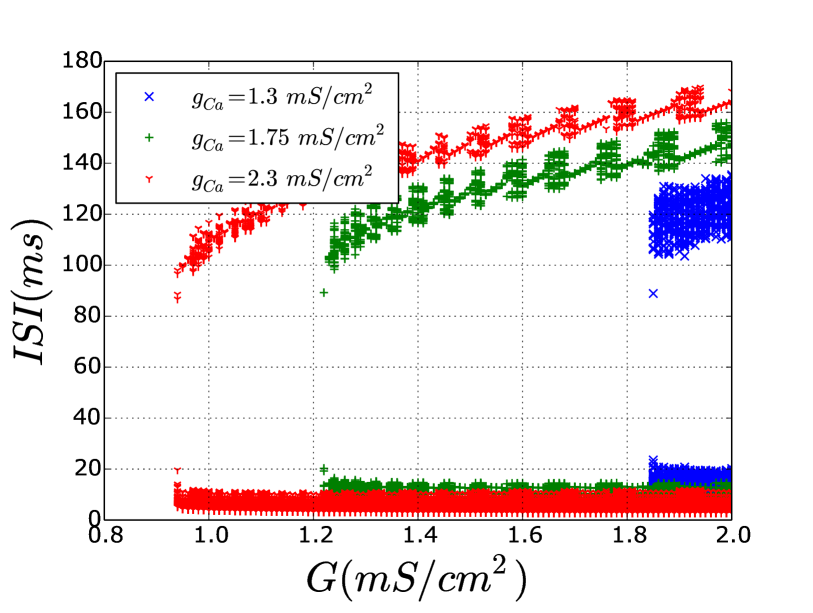
Such bursting activity is often referred to as a network bursting, which is the result of strongly reciprocal interactions of two individually tonic spiking neurons. Figure 2 provides an explanation why inhibitory coupling must be so strong to induce network bursting in the given model. There is a wide gap between the parameter values corresponding to bursting (at the low end) and to tonic spiking (on the high end). Within this gap, the neurons remain hyperpolarized quiescent, and hence the network bursting can only occur through PIR mechanisms. A strong flux of inhibitory current is required to originate from the presynaptic, tonic spiking neuron in order to make the postsynaptic neuron drive over the gap to become a network burster. Then, the neurons swap the roles of the driving and driven neurons and so forth. This assertion is further supported by Fig. 8 plotting inter-spike intervals (ISIs) in the driven postsynaptic neurons (neurons 1 and 2 in Insets (a) and (b), resp.) against the coupling strength for three values of . We can see the corresponding gap in the right panel, within which neuron 2, through strongly inhibitory force, generates large sub-threshold oscillations, partially because of the network asymmetry due to .
Figure 8 also discloses the qualitative role of the slow low-threshold -current ; namely, increasing the corresponding rebound parameter lowers the threshold of coupling-induced bursts, and shrinks the parameter interval of hyperpolarized quiescence in the neurons.
VI PIR mechanism for antiphase bursting
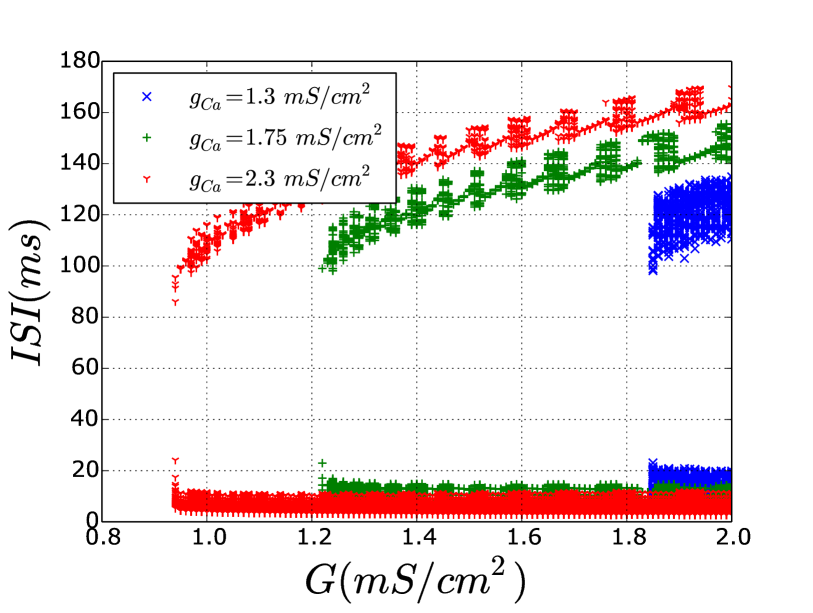
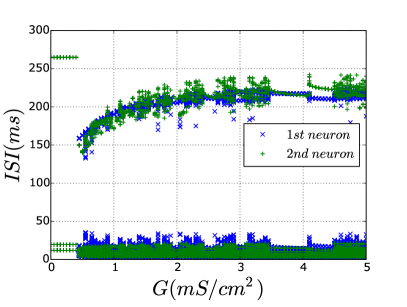
In this section we examine the emergence of network antiphase bursting through the PIR mechanism. Here, it is imperative that both neurons remain hyperpolarized within a parameter window quiescence , as seen from Fig. 2. It is also necessary for PIR network bursting that the initial states of the neurons must be different: one tonic spiking and one hyperpolarized quiescent. An alternative is an application of negative pulse of current to trigger a PIR in a targeted neuron. In addition to the above constrains, the coupling strength must exceed a certain threshold, see Fig. 9.
It is seen from this plot that relatively weak coupling cannot initiate PIR network bursting. Rather some sub-threshold oscillations are generated in the post-synaptic neuron, which cease as soon as the pre-synaptic neuron ends its active spiking phase and becomes hyper-polarized quiescent as well. For each set of the parameters there is a threshold for the coupling strength beyond which the HCO robustly produces anti-phase bursting. Figure 9 also demonstrates that the PIR mechanism of network bursting becomes more reliable with increasing , which lowers the threshold value of inhibitory coupling.
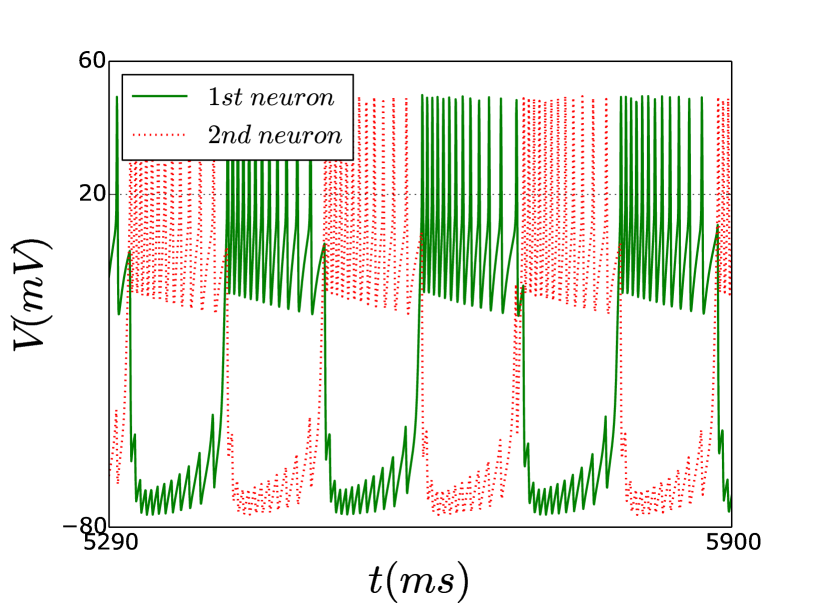
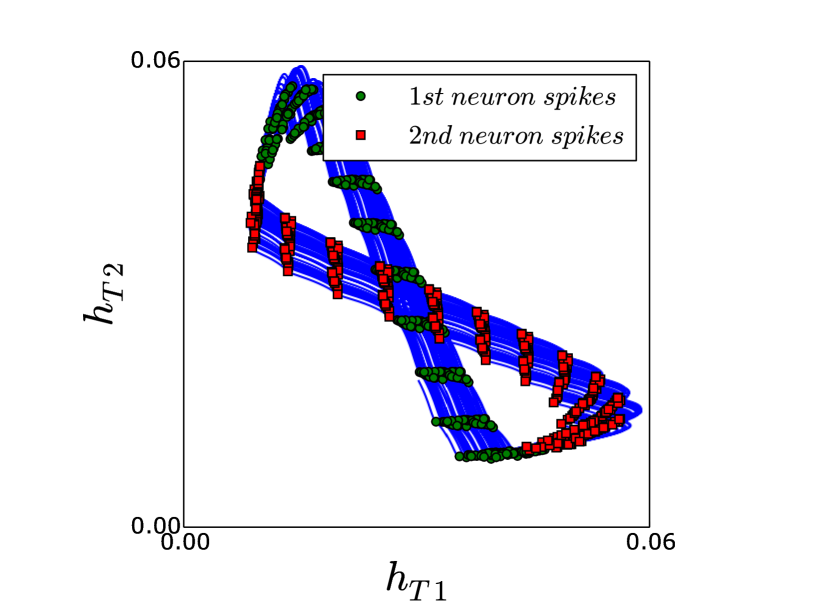
Regularization of PIR network bursting is quite sensitive to variations of the coupling strength. By inspecting the top ISI-branch in Fig. 9 one can identify the stability windows of -values corresponding to plateau-like ISI intervals alternating with the windows of fluctuations of ISI values. Fluctuations are not marginal – about 10% off the mean value. The PIR network bursting is illustrated in Fig. 10(a). Fig. 10(b) reveals a quasi-periodic modulation of the slow gating variables; here the periodic Lissajous curve has a shape of figure-eight.
VII Coupling of neurons in different modes
In this section we consider the network dynamics of coupled neurons operating in different modes. Specifically, the neurons are set close to “quiescence-spiking” and “quiescence-bursting” transitions, respectively. As Fig. 2 suggests, we choose the following values of the external drive: and . This means that in isolation neuron 1 produces tonic spiking activity, while neuron 2 is hyperpolarized and ready for the PIR mechanism. Our network simulations of two such neurons are summarized in Figs. 11 and 12. We can conclude that while coupling remains weak, neuron 1 tonically spikes (Fig. 12(a)). Above a threshold, , neuron 2 begins spiking as well. Fig. 12(b)) depicts alternating spiking at with the locking ratio 2:1, which means two spikes in neuron 1 are followed by a single spike in neuron 2. The network begins to burst in antiphase, first with irregularly varying spike numbers, as exceeds , as illustrated in Fig. 12(c). Further increase in the coupling strength above , regularizes network bursting that becomes stable and similar to the pattern shown in Fig. 10.
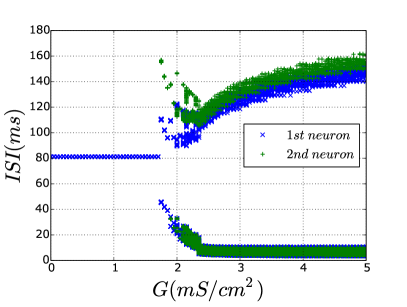
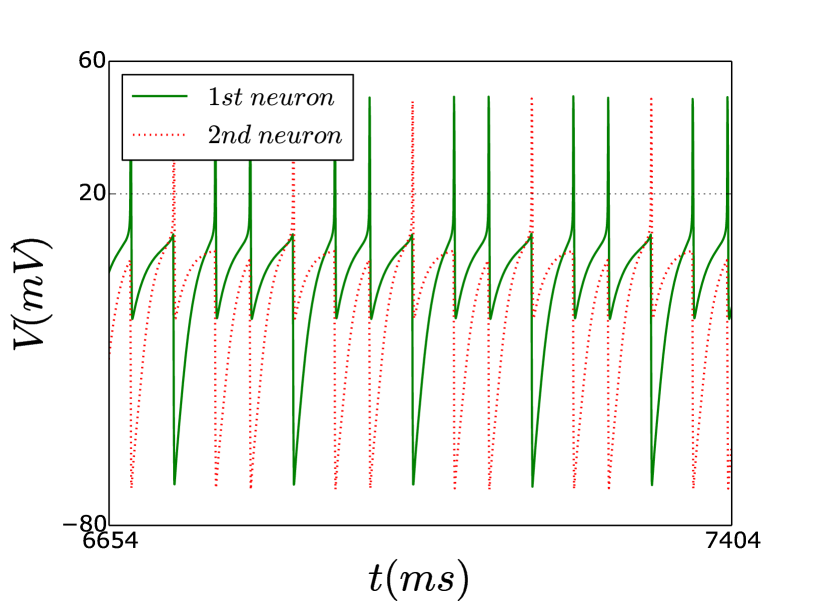
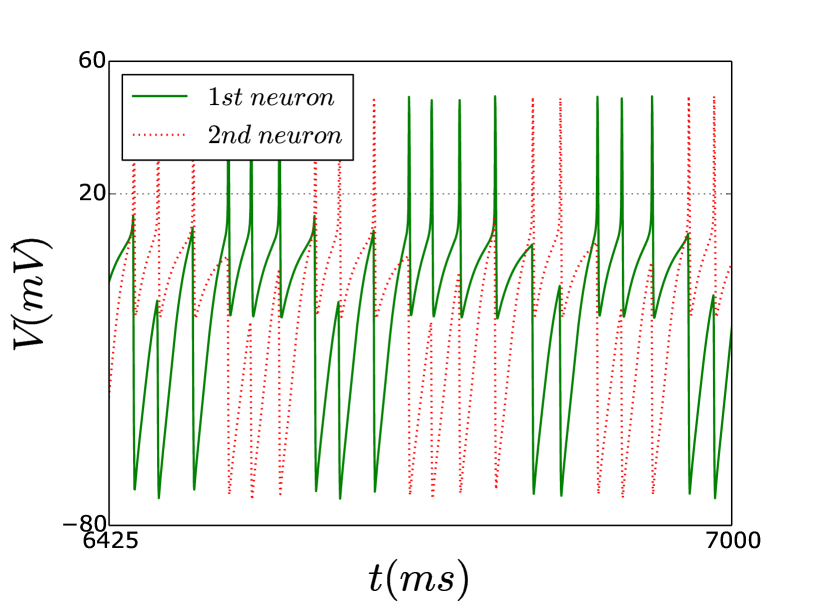
Figure 13 represents the bifurcation diagram for the network of an endogenous burster – neuron 2 at , coupled with neuron 1 – hyperpolarized at . Because the quiescent neuron 1 initially remains below the synaptic threshold, anti-phase bursting in the network may only start when the PIR mechanism is induced by the endogenous burster. This explains a qualitative resemblance of the diagram in Fig. 13 with that in Fig. 11 for the HCOP made of tonic-spiking and quiescent neurons.
VIII Conclusions
This study focused on the mechanisms of rhythmogenesis of anti-phase bursting in HCO networks consisting of two reciprocally inhibitory coupled neurons. Such HCOs are primary building blocks for larger neural networks, including CPGs controlling a plethora of locomotion behaviors in spineless animals and mammals. There is a growing consensus in the neuroscience community that CPGs share some universal principles of their functioning.
In this study, for CPG neurons we used the biophysically plausible Hodgkin-Huxley-type model. Its main feature is post-inhibitory rebound dynamics: a quiescent neuron is able to produce a single or a series of spikes after it has been quickly released from inhibition by another pre-synaptic neuron, or by a hyperpolarized pulse of external current. The PIR mechanism allows a pair of such neurons to stably generate anti-phase bursting in a network initiated externally by inhibitory perturbation(s).
We considered several configurations of HCOs including coupled endogenous bursters. We also discussed HCOs involving tonic spiking and quiescent neurons that become network bursters only when coupled by fast inhibitory synapses. In our examination of synchronization properties of bursting we found that, in all considered cases, the network can reliable achieve synchrony in anti-phase bursting. We also described some partial configurations leading to incomplete synchronization where the neurons become partially synchronized, through slow-varying currents. Meanwhile, cross-correlations in their fast voltage dynamics are not always obvious. These fast voltage dynamics may give rise to the emergence of synergistically complex states, including chaos in the neural network.
We found that while enhancing the PIR mechanism does not lead to drastic changes in the dynamics of the individual neurons, it causes significant modulation of network dynamics. Specifically, we found that the windows of anti-phase bursting rhythms can be extended in the parameter space of the network, when increasing the PIR mechanisms in individual neurons become more prominent. This suggests that the PIR is a key component for robust and stable anti-phase bursting in HCOs. In the future, we plan to examine specific networks consisting of several HCOs, which have been identified in swim CPGs of several sea mollusks.
Acknowledgements.
The research is supported by the grant (the agreement of August 27, 2013 N 02.B.49.21.0003 between The Ministry of education and science of the Russian Federation and Lobachevsky State University of Nizhni Novgorod, Sections 2-4) and by the Russian Science Foundation (Project No. 14-12-00811, Sections 5-7). A.P. thanks A. Politi for interesting discussions and acknowledges the G.Galilei Institute for Theoretical Physics (Italy) for the hospitality and the INFN for partial support during the completion of this work. M.K. thanks Alexander von Humboldt foundation for support. A.S. also acknowledges the support from NSF grants DMS-1009591, RFFI 11-01-00001, and RSF grant 14-41-00044. We thank A. Kelley for helpful suggestions.IX Appendix: Conductance based model
The model in this study is adopted from Ref. Destexhe et al. (1994). The dynamics of the membrane potential, is governed by the following equation:
| (2) |
here, is the specific membrane capacity, is the external current in , is the slow low-threshold -current, is the leakage current, is the -current, is the -current, is the slow -activated -current which moderates bursting activity in the model, and is the synaptic current from other neurons. Leak current is given by
| (3) |
with being reversal potential for leak current, and maximal conductance . Dynamics of fast -current is described by the following equations:
| (4) | ||||
where is the maximal conductance of -current, is the Nernst equation potential for -current, and are the gating variables describing activation and inactivation of the current. Dynamics of fast -current is described by
| (5) | ||||
with being the gating activation variable; here and . Dynamics of intraneuronular concentration of calcium ions is described
| (6) |
where the first term is a inflow through thin membrane due low-threshold -current, and the second is a contribution of ion-pump,
is the Faraday constant,
is the membrane thickness,
is the dimension constant for and , that has dimension of millimole ,
and are the speed constants from the Michaelis–Menten approximation of ion-pump kinetics, they are taken the way that one can observe fast output of calcium from a neuron in millisecond time scale.
Dynamics of slow low-threshold -current is modeled as follows:
| (7) |
with , and the gating activation and inactivation are given by
| (8) |
with
| (9) | ||||
These constants were taken at temperature and extraneuronular concentration calcium concentration . Equilibrium potential depending on intraneuronular concentration of are found from the Nernst equation:
| (10) |
here , , dimensionless constant for is measured in millivolts, extraneuronular concentration of calcium ions is .
Dynamics of -activated -current is determined through the following equations:
| (11) |
and
| (12) | ||||
with , being the gating activation variable.
Synaptic currents are models using the fast-threshold modulation paradigm Kopell and Somers (1993):
| (13) |
where is the maximal conductance of synaptic current flowing from pre-synaptic j-th neuron into the post-synaptic i-th neuron. For inhibitory coupling we set ; the synaptic activity function is given by
| (14) |
with the synaptic threshold set in a middle of fast spikes.
References
- Pikovsky, Rosenblum, and Kurths (2003) A. Pikovsky, M. Rosenblum, and J. Kurths, Synchronization: A Universal Concept in Nonlinear Sciences, Cambridge Nonlinear Science Series (Cambridge University Press, 2003).
- Shilnikov, Shilnikov, and Turaev (2004) A. Shilnikov, L. Shilnikov, and D. Turaev, “On some mathematical topics in classical synchronization: a tutorial,” J Bifurcations and Chaos 14, 2143–2160 (2004).
- Desroches et al. (2012) M. Desroches, J. Guckenheimer, B. Krauskopf, C. Kuehn, H. M. Osinga, and M. Wechselberger, “Mixed-mode oscillations with multiple time scales,” SIAM Rev. 54, 211–288 (2012).
- Jalil, Belykh, and Shilnikov (2010) S. Jalil, I. Belykh, and A. Shilnikov, “Fast reciprocal inhibition can synchronize bursting neurons,” Physical Review E 81 (2010), 10.1103/PhysRevE.81.045201.
- Omelchenko, Rosenblum, and Pikovsky (2010) I. Omelchenko, M. Rosenblum, and A. Pikovsky, “Synchronization of slow-fast systems,” European Physical Journal-Special Topics 191, 3–14 (2010).
- Jalil, Belykh, and Shilnikov (2012) S. Jalil, I. Belykh, and A. Shilnikov, “Spikes matter for phase-locked bursting in inhibitory neurons,” Physical Review E 85 (2012), 10.1103/PhysRevE.85.036214.
- Wojcik et al. (2014) J. Wojcik, J. Schwabedal, R. Clewley, and A. Shilnikov, “Key bifurcation of bursting polyrhythms in 3-cell central pattern generators,” PLoS ONE 9, e92918 (2014).
- Selverston (1985) A. Selverston, ed., Model Neural Networks and Behavior (Springer, Berlin, 1985).
- Marder and Calabrese (1996) E. Marder and R. Calabrese, “Principles of rhythmic motor pattern generation,” Physiological Reviews 76, 687–717 (1996).
- Gillner and Wallen (1985) S. Gillner and P. Wallen, “Central pattern generators for locomotion, with special references to vertebrates,” Ann. Rev. Neurosci. 8, 233–261 (1985).
- Rabinovich et al. (2006) M. I. Rabinovich, P. Varona, A. I. Selverston, and H. D. I. Abarbanel, “Dynamical principles in neuroscience,” Rev. Mod. Phys. 78, 1213–1265 (2006).
- Shaw et al. (2014) K. M. Shaw, D. N. Lyttle, J. P. Gill, M. J. Cullins, J. M. McManus, H. Lu, P. J. Thomas, and H. J. Chiel, “The significance of dynamical architecture for adaptive responses to mechanical loads during rhythmic behavior,” Journal of Computational Neuroscience , 1–27 (2014).
- Schwabedal, Neiman, and Shilnikov (2014) J. T. C. Schwabedal, A. B. Neiman, and A. L. Shilnikov, “Robust design of polyrhythmic neural circuits,” Phys. Rev. E 90, 022715 (2014).
- Izhikevich (2007) E. M. Izhikevich, Dynamical Systems in Neuroscience (MIT Press, Cambridge, mass., 2007).
- Hill, Van Hooser, and Calabrese (2003) A. A. V. Hill, S. Van Hooser, and R. L. Calabrese, “Half-center oscillators underlying rhythmic movements,” in The Handbook of Brain Theory and Neural Networks, edited by M. A. Arbib (The MIT Press, 2003).
- Wang and Rinzel (1985) X.-J. Wang and J. Rinzel, “Alternating and synchronous rhythms in reciprocally inhibitory model neurons,” Ann. Rev. Neurosci. 8, 233–261 (1985).
- Daun, Rubin, and Rybak (2009) S. Daun, J. E. Rubin, and I. A. Rybak, “Control of oscillation periods and phase durations in half-center central pattern generators: a comparative mechanistic analysis,” Journal of Computational Neuroscience 27, 3–36 (2009).
- Destexhe et al. (1994) A. Destexhe, D. Contreras, T. Sejnowski, and M. Steriade, “A Model of Spindle Rhythmicity in the Isolated Thalamic Reticular Nucleus,” Journal of Neurophysiology 72, 803–818 (1994).
- Perkel and Mulloney (1974) D. Perkel and B. Mulloney, “Motor Pattern Production in Reciprocally Inhibitory Neurons Exhibiting Postinhibitory Rebound,” Science 185, 181–183 (1974).
- Skinner, Kopell, and Marder (1994) F. Skinner, N. Kopell, and E. Marder, “Mechanisms for oscillation and frequency control in reciprocally inhibitory model neural networks,” Journal of Computational Neuroscience 1, 69–87 (1994).
- Angstadt et al. (2005) J. Angstadt, J. Grassmann, K. Theriault, and S. Levasseur, “Mechanisms of postinhibitory rebound and its modulation by serotonin in excitatory swim motor neurons of the medicinal leech,” Journal of Comparative Physiology A-Neuroethology, Sensory, Neural and Behavioral Physiology 191, 715–732 (2005).
- Kopell and Ermentrout (2002) N. Kopell and G. Ermentrout, “Mechanisms of phase-locking and frequency control in pairs of coupled neural oscillators,” Handbook on Dynamical Systems 2, 3–54 (2002).
- Shilnikov et al. (2001) L. Shilnikov, A. Shilnikov, D. Turaev, and L. Chua, Methods of Qualitative Theory in Nonlinear Dynamics, Parts I and II (World Scientific Publ., 1998,2001).
- Channell, Cymbalyuk, and Shilnikov (2007) P. Channell, G. Cymbalyuk, and A. Shilnikov, “Origin of bursting through homoclinic spike adding in a neuron model,” Phys.Rev.Lett. 98, 134101 (2007).
- Channell et al. (2009) P. Channell, I. Fuwape, A. Neiman, and A. Shilnikov, “Variability of bursting patterns in a neuron model in the presence of noise.” Journal Computational Neuroscience 27, 527–542 (2009).
- Shilnikov (2012) A. Shilnikov, “Complete dynamical analysis of a neuron model,” Nonlinear Dynamics 68, 305–328 (2012).
- Jalil et al. (2013) S. Jalil, D. Allen, J. Youker, and A. Shilnikov, “Toward robust phase-locking in melibe swim central pattern generator models,” Chaos 23, 046105 (2013).
- Belykh and Shilnikov (2008) I. Belykh and A. Shilnikov, “When weak inhibition synchronizes strongly desynchronizing networks of bursting neurons.” Phys Rev Lett 101, 078102 (2008).
- Shilnikov, Gordon, and Belykh (2008) A. Shilnikov, R. Gordon, and I. Belykh, “Polyrhythmic synchronization in bursting networking motifs,” Chaos 18 (2008), 10.1063/1.2959850.
- Kopell and Somers (1993) N. Kopell and D. Somers, “Rapid synchronization through fast threshold modulation,” Biol. Cybern. 68, 5 (1993).