Konus-Wind and Helicon-Coronas-F Observations of Solar Flares
Abstract
Results of solar flare observations obtained in the Konus-Wind experiment from November, 1994 to December, 2013 and in the Helicon-Coronas-F experiment during its operation from 2001 to 2005, are presented. For the periods indicated Konus-Wind detected in the trigger mode 834 solar flares, and Helicon-Coronas-F detected more than 300 solar flares.
A description of the instruments and data processing techniques are given. As an example, the analysis of the spectral evolution of the flares SOL2012-11-08T02:19 (M1.7) and SOL2002-03-10T01:34 (C5.1) is made with the Konus-Wind data and the flare SOL2003-10-26T06:11 (X1.2) is analyzed in the 2.223 MeV deuterium line with the Helicon-Coronas-F data.
1 INTRODUCTION
Studying the dynamics of the energy spectra of X-ray and gamma-ray emission of solar flares is a powerful tool for the investigation of charged particle acceleration and the diagnostics of flare magnetic loop plasma (see review of Fletcher et al. (2011) and references therein). Since 2002, the main results from observations of solar flares in the hard X-ray and gamma-ray ranges have been obtained with the RHESSI spectrometer (Lin et al., 2002), which has excellent energy and angular resolution. Operating since 2008 onboard the Fermi observatory the Gamma-Ray Burst Monitor (GBM) (Meegan et al., 2009) is also carrying out observations of solar flares in a range from 8 keV to 40 MeV. The Russian gamma-ray spectrometer Konus, which successfully operates onboard the U.S. Wind spacecraft, has a number of advantages when compared with RHESSI and GBM, operating on near-Earth spacecraft. The Konus-Wind experiment has been continuously carried out since November 1994 in the favorable conditions of interplanetary space far from the Earth’s magnetosphere, which ensures no interference from Earth’s radiation belts nor occulting by the Earth. Owing to such an orbit a useful observation time is 95%, while the configuration of detectors provides continuous monitoring of the entire celestial sphere in a wide energy range from 18 keV to 15 MeV under extremely stable background (in the absence of powerful streams of charged particles from the Sun). In addition, the effective area of the spectrometer in the range 100 keV may be more than the effective area of the RHESSI detector (for certain configurations) and resolution in the MeV range is better than that of the GBM detectors. During the operation of Konus-Wind and other series of the Konus experiments a unique database on solar flares has been accumulated. The aim of this paper is to describe the obtained data, the methods of their processing, as well as to present the results of data analysis through examples on specific flares.
2 INSTRUMENTS
2.1 Konus-Wind
The Russian-American experiment Konus-Wind is designed to study the temporal and spectral characteristics of gamma-ray bursts, soft gamma repeaters and other transient phenomena in a wide energy range from 18 keV to 15 MeV. The instrument consists of two spectrometric gamma-ray detectors NaI(Tl) (13 cm in diameter, 7.5 cm in height). Their axes are directed to the south and the north ecliptic pole, respectively, that provides a continuous monitoring of the entire celestial sphere. Each detector has an effective area of cm2, depending on the energy and incident angle of a gamma quantum. Resolution of the spectrometer is about 8% (FWHM) at the 662 keV line, the sensitivity of erg cm-2. Detectors operate in two modes: “Background” and “Burst” (trigger mode). In the “Background” mode a counting rate is measured in three energy channels G1, G2, G3 with the nominal ranges 10–50, 50–200, and 200–750 keV (18–70, 70–300, 300–1160 keV in 2013 year), with a temporal resolution of 2.944 s. In the “Burst” mode time history is measured in the same three channels with a resolution varying from 2 to 256 ms and a total record duration of 230 s, and also 64 spectra are measured in two partially overlapping bands with nominal boundaries 10–750 keV (PHA1) and 0.2–10 MeV (PHA2) (18–1160 keV and 0.3–15 MeV in 2013). Each band has 63 channels. The first four spectra are measured with a fixed accumulation time of 64 ms. For the next 52 spectra a system, adapting spectrum measurement duration to the current emission intensity, determines accumulation times, which may vary from 0.256 to 8.192 s. The last 8 spectra are measured with an accumulation time of 8.192 s. As a result, the total duration of spectral measurements can vary from 79.104 s for the most intense events up to 491.776 s for typical bursts. Transition into the trigger mode occurs at a statistically significant excess above a background count rate within an interval of 1 s or 140 ms in the G2 energy channel. Thus, a background count rate is determined at the preceding interval of 30 s length. At the end of a trigger record information is slowly rewritten from the instrument’s memory to the on-board memory, which takes 1–1.5 hours. While rewriting the operation of the instrument in the “Background” mode stops, no new trigger can be generated at this time either, however one of the backup systems continues to transmit G2 intensity measurements through a “housekeeping” telemetry channel with a resolution of 3.680 s. A detailed description of the experiment is given in Aptekar et al. (1995), and the main results of gamma-ray burst and soft gamma-ray repeater studies are described in a review by Mazets et al. (2012).
2.2 Helicon-Coronas-F
The Helicon gamma-ray spectrometer was one of the instruments onboard the Coronas-F solar space observatory (Oraevskii et al., 2002), which had been in operation from August 2001 to December 2005 in a near-Earth low-eccentricity polar orbit (inclination , distance from the Earth 500–550 km). The spacecraft was stabilized by rotation with respect to the axis directed toward the Sun within 10′. The spectrometer consisted of two detectors, similar to those of Konus-Wind, one of which was oriented toward the Sun and the other viewed the antisolar hemisphere. The “Burst” mode was similar to the Konus-Wind trigger mode; in the “Background” mode a time history was measured in 8 energy channels covering the 10–200 keV range with a time resolution of 1 s and 256-channel spectra were measured in the 0.2–10 MeV range with accumulation time of 33.6 s. Data output to the onboard memory was made without interruption in measurements.
3 OBSERVATIONS OF SOLAR FLARES IN KONUS-WIND EXPERIMENT
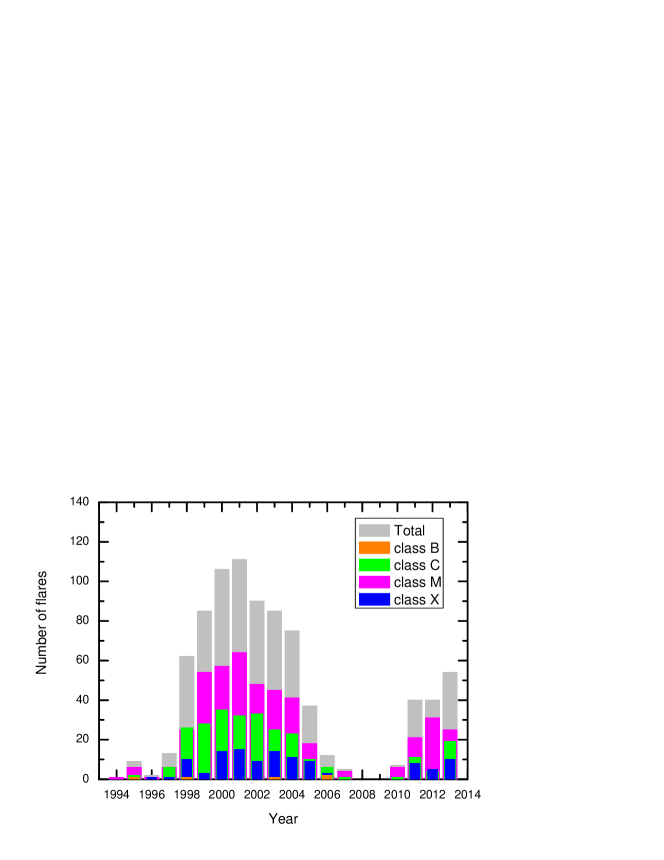
During the period from its launch in November 1994 until the end of 2013 Konus-Wind had registered in the “Burst” mode 834 solar flares with the GOES classification: 113 X-class, 454 M-class, 262 C-class and 5 B-class. Figure 1 shows the distribution of the number of flares over the years. It is seen that the largest number of flares occurred in years of maximum solar activity 2000–2002, while in 2008 and 2009 corresponding to the minimum of solar activity, there were no sufficiently intense flares to cause a trigger.
Due to the nature of the trigger algorithm (see Section 2.1), the transition to the “Burst” mode takes place at appearing in a flare of high-energy radiation with quite a rapid increase in intensity, wherein a smoother and softer initial rise phase is skipped (and registered only in the background record). Besides, the duration of many intense flares exceeds the duration of measurements in the trigger mode. As a result, for a significant proportion of long and intense flares, spectral data and time profiles of high resolution are available only for part of a flare.
3.1 Analysis of Konus-Wind solar flares
Spectral analysis of the Konus-Wind data is performed using the software package XSPEC (Arnaud, 1996), for this purpose spectra and a detector response matrix are converted into fits-format. The incident angle on the detector is 90∘ for solar flares, this entails the strong absorption of soft radiation when passing through the aluminum container 2 mm thick housing the scintillator. Despite this, the intensity of radiation from powerful flares in the soft range may cause the overflow of the G1 channel counter and significant distortion of spectra.
In the standard analysis of Konus-Wind data a spectrum, averaged over an interval of 100–300 s after the event, is selected as the background spectrum, but the radiation from solar flares often lasts longer than the measurement time of spectra in the “Burst” mode (maximum 472 s), i.e. even last spectra of a trigger record in such cases cannot be taken for background. Then, it is often possible to use some spectra of neighboring trigger events as the background if the background has not changed significantly over the time interval between the analyzed flare and neighboring trigger (it can be controlled by the level of background in three channels: G1, G2, G3).
The XSPEC package contains a variety of standard spectral models, but there are no standard models of thin and thick target, often used for the analysis of spectra of solar flares. These models have been added by us to XSPEC based on analogous models from the OSPEX package, designed for the analysis of solar data.
In the 40 keV range, where the contribution of the thermal component of radiation is usually small, flare spectra are often well described by a simple power-law model: . An example of such a spectrum measured by Konus-Wind is shown in Fig. 2.
3.2 Flare SOL2012-11-08T02:19
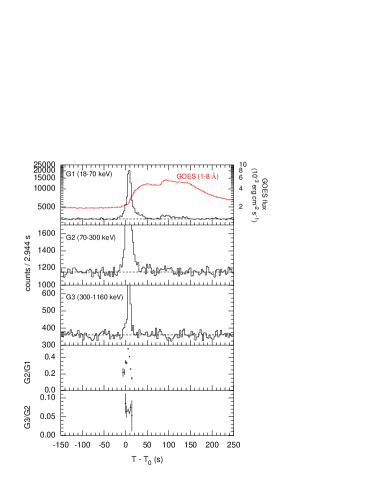
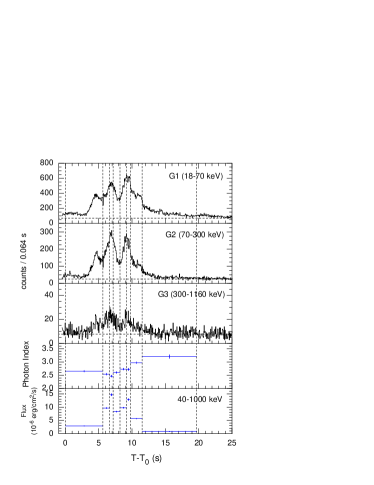
Figure 3 shows a solar flare recorded by Konus-Wind on November 8, 2012 (class M1.7). The left panel shows the time profile of the flare in three energy channels and two hardness ratios: G2/G1 and G3/G2, produced from background data; on the right – time profile with a resolution of 1.024 s, the evolution of the power-law spectral index and the energy flux in the 40–1000 keV range obtained from “Burst” mode data. It can be seen that the flare starts with a fairly soft emission, followed by a powerful hard pulse (which caused the trigger event) during which a correlation between intensity and hardness is clearly seen, then the intensity of the radiation gradually decreases, but its hardness remains almost constant with the spectral index of 3.5.
3.3 Flare SOL2002-03-10T01:34
Figure 4 (similar to Figure 3) shows a solar flare detected by Konus-Wind on March 10, 2002 (class C5.1). The flare is quite unusual – the duration of the main pulse is only about 15 s, without any significant emission before the pulse even in the soft channel, and the spectrum of the emission is extremely hard with an index of 2.4 at the maximum intensity. In 70 s after the main pulse a much weaker pulse follows that is only visible in the channel G1 (in this case the pulse has greater intensity in the GOES channels, as shown in the left panel of Fig. 4). This flare belongs to a class of so-called “early impulsive flares” (Sui et al., 2006). For such flares a hard radiation peak precedes a soft radiation peak, indicating weak plasma preheating, while the images obtained by RHESSI, typically exhibit two-footpoint morphology of the source for the hard peak and looptop source for the delayed soft radiation peak; the spectrum of the early impulsive peak is nonthermal and very hard and the spectrum is thermal in the delayed soft radiation pulse (see, for example, Su et al. (2008)). In this flare the delay between the soft and hard peaks is 20 s.
4 OBSERVATIONS OF SOLAR FLARES IN HELICON-CORONAS-F EXPERIMENT
Useful exposure for the Coronas-F observations was severely limited by passing through the radiation belts at high latitudes and through the South Atlantic Anomaly (SAA). In total, for 4 years of the experiment 300 flares had been registered in the trigger mode: 4 X-class, 54 M-class, 163 C-class and 69 B-class (flares were counted providing their trigger fired on the portions of orbit with a modest background level, i.e. at low and moderate latitudes away from the SAA). The flares were registered by the detector whose axis was oriented to the Sun, herewith, the radiation passed through an entrance beryllium window that provided low absorption in the soft part of the spectrum. Measurements of 256-channel spectra in the “Background” mode (see section 2.2) allowed registering the deuterium line 2.223 MeV and studying its evolution on the timescale of 33.6 s in strong long flares.
4.1 Flare SOL2003-10-26T06:11
Figure 5 shows a solar flare detected on October 26, 2003 (class X1.2). The flare is interesting because after 40 min after its start a powerful pulse of hard emission was detected, which was not accompanied by any increase in the intensity of soft X-rays (Zimovets & Struminsky, 2012). The top panels of Fig. 5 show the time profile derived from the data of the Konus-Wind standby system (see section 2.1) and from the anti-coincidence shield (ACS) of the SPI telescope onboard the INTEGRAL observatory. The bottom panel shows the emission intensity evolution in the deuterium line, derived from the Helicon data. It can be seen that the line intensity is following the intensity of the powerful hard X-rays pulse (with a peak at 07:30 UT) with a delay of about 100 s needed to thermalize neutrons.
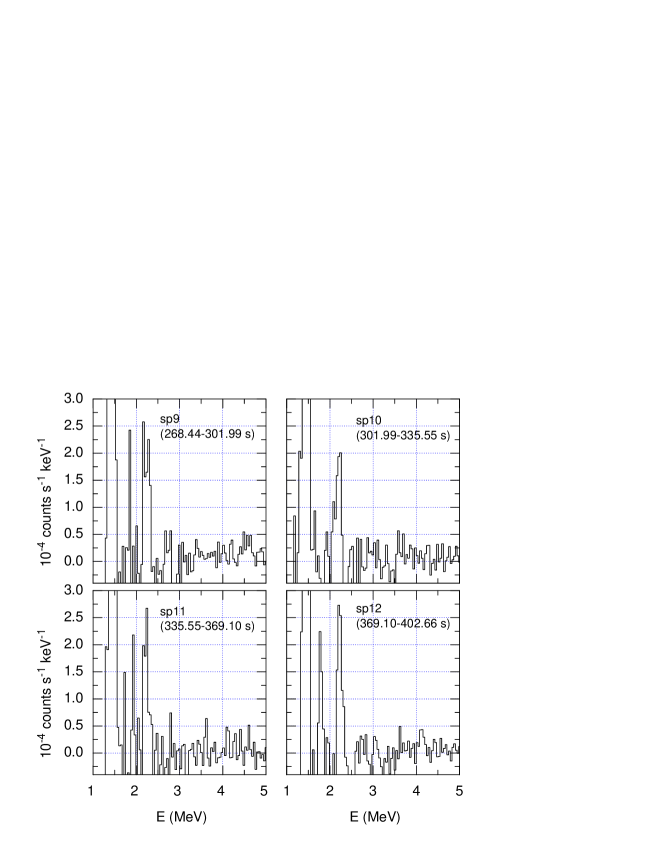
To calculate the intensity in the line, it is not necessary to know a background spectrum, it is enough to subtract the continuum defined by the nearby regions of the spectrum that do not contain lines. Figure 6 shows the individual spectra (with the continuum subtracted) measured by Helicon in the 1–5 MeV range. The spectra demonstrate the 2.223 MeV line, an escape peak corresponding to the energy 1.712 MeV (=2.223-0.511), and the strong 1.460 MeV line caused by the decay of 40K present in the detector materials. The deuterium line width is determined by the resolution of the instrument that amounts to 130 keV at 2.223 MeV (; FWHM) (wherein the width of the spectral channels in this range is 40 keV). To convert the line intensity measured in counts s-1 to the photon flux (photons cm-2 s-1), the measured intensity was divided by the detector effective area in the full absorption peak, which is equal to 32 cm2 at 2.223 MeV. The line fluence measured during the hard pulse (906 s since 07:27:16 UT), was 22.10.8 photons cm-2, which is comparable with the fluences measured with the GRS gamma-ray spectrometer onboard the Solar Maximum Mission in the 2.223 MeV line for the most intense solar flares (Vestrand et al., 1999).
5 CONCLUSIONS
In the Konus-Wind experiment, a large database of solar flares has been accumulated since 1994 upto the present (834 flares in the “Burst” mode). These data allow us to investigate the dynamics of hard X-ray and gamma-ray emission spectra in different phases of flares on timescales varying from 0.256 to 8.2 s (but the initial rise phase is often skipped), as well as the temporal evolution and the evolution of the hardness ratio on the timescales from 2 to 256 ms in the “Burst” mode and on the timescale of 2.994 s in the “Background” mode.
The Helicon Coronas-F data allow studying the dynamics of the intensity of the 2.223 MeV deuterium line and its relationship to the intensity of hard X-ray and gamma radiation.
A list of the Konus-Wind solar flare triggers and figures of their time profiles are available at http://www.ioffe.ru/LEA/Solar/.
References
- Aptekar et al. (1995) Aptekar, R., Frederiks, D., Golenetskii, S., et al. 1995, Space Sci. Rev. 71, 265
- Arnaud (1996) Arnaud, K. A. 1996, in ASP Conf. Ser. 101, Astronomical Data Analysis Software and Systems V, ed. G. Jacoby & J. Barnes (San Francisco, CA: ASP), 17
- Fletcher et al. (2011) Fletcher, L., Dennis, B.R., Hudson, H.S., et al. 2011, Space Sci. Rev., 159, 19
- Lin et al. (2002) Lin, R.P., Dennis, B.R., Hurford, G.J., et al. 2002, Sol. Phys., 210, 3
- Mazets et al. (2012) Mazets, E.P., Aptekar, R.L., Golenetskii, S.V., et al. 2012, JETP Letters, 96, 544
- Meegan et al. (2009) Meegan, C., Lichti, G., Bhat, P., et al. 2009, ApJ, 702, 791
- Oraevskii et al. (2002) Oraevskii, V.N., Sobel man, I.I., Zhitnik, I.A., Kuznetsov, V.D. 2002, Phys. Usp., 45, 886
- Su et al. (2008) Su, Y., Gan, W.Q., & Li, Y. P. 2008, AdSpR, 41, 988
- Sui et al. (2006) Sui, L., Holman, G.D., & Dennis, B.R. 2006, ApJ, 645, L157
- Vestrand et al. (1999) Vestrand, W.T., Share, G.H., Murphy, R.J., et al. 1999, ApJS, 180, 409
- Zimovets & Struminsky (2012) Zimovets, I., & Struminsky, A. 2012, Sol. Phys., 281, 749