Ongoing growth of the brightest cluster galaxies via major dry mergers in the last Gyr
Abstract
Brightest Cluster Galaxies (BCGs) might have been assembled relatively late () via mergers. By exploiting the high-resolution HST/ACS imaging, we find four BCGs (COSMOS-P 125516, 102810, 036694 and 089357) in major dry merging in 29 X-ray clusters at in the Cosmological Evolutionary Survey (COSMOS). These BCGs show prominent but quiescent double nuclei with a magnitude difference of and a projected separation of 10 kpc. Clear signatures of interaction such as extended plumes and/or significant asymmetries are also observed in their residual images. We infer a major merger rate of merger per Gyr at assuming the merger time-scale estimate of Kitzbichler & White (2008). This inferred rate is significantly higher than the rate in the local Universe ( at ) presented in Liu et al. (2009). We estimate that present-day BCGs increase their luminosity (mass) by per cent via major dry mergers since , where is the mean mass fraction of companion galaxies accreted onto the central ones. Although the statistical uncertainty due to our small sample size is relatively large, our finding is consistent with both recent observational and theoretical results. Furthermore, in conjunction with our previous findings in Liu et al. (2009), the discovery of these intermediate-redshift merging BCGs is clear evidence of ongoing assembly of BCGs via major dry mergers over the last 6 Gyr.
keywords:
galaxies: elliptical and lenticular, cD - galaxies: clusters: general - galaxies: photometry1 Introduction
Brightest Cluster Galaxies (BCGs) are among the most luminous and most massive galaxies in the Universe. They are usually located close to the centres of dense clusters of galaxies as witnessed in the X-ray or gravitational lensing observations (e.g., Jones & Forman, 1984; Smith et al., 2005). Except in strong cooling flows, they are dominated by old stars and they lack prominent ongoing star formation (von der Linden et al. 2007; Liu et al. 2012a,b). It was noted very early on that some BCGs show excess of light (‘envelopes’) relative to the de Vaucouleurs () profile at large radii (Matthews et al., 1964; Schombert, 1988; Graham et al., 1996) and were thus termed as cD galaxies. Recent studies have identified cD galaxies using improved Petrosian (Petrosian, 1976) parameter profiles (Brough et al., 2005; Patel et al., 2006; Liu et al., 2008). A large fraction of massive nearby BCGs can be classified as cD galaxies (Liu et al., 2008).
In order to understand the formation and evolution of BCGs/cDs, several formation mechanisms including galactic cannibalism (White, 1976; Ostriker & Hausman, 1977), tidal stripping of stars from interacting galaxies in clusters (Gallagher & Ostriker, 1972; Richstone, 1976; Merritt, 1985) and star formation by cooling flows onto BCGs (Fabian, 1994) have been proposed in early studies. Recent numerical simulations and semi-analytic models of galaxy formation suggested that BCGs form in a two-phase process: an initial collapse with rapid cooling and star formation at high redshift is followed by later () growth through multiple dissipationless (dry) mergers of pre-existing progenitors (e.g., De Lucia & Blaizot, 2007; Ruszkowski & Springel, 2009; Naab et al., 2009; Laporte et al., 2012; Laporte et al., 2013). These studies, however, differ in their predictions of stellar mass growth rates and/or the role of mergers. For instance, De Lucia & Blaizot (2007) predict that the stellar mass of BCGs increase by a factor of between redshift and via accretion of smaller galaxies (minor mergers). More recent simulations in a universe in Laporte et al. (2013) show that BCGs can form through dissipationless mergers of quiescent massive galaxies and predict a lower stellar mass growth for BCGs by both major and minor mergers, with mass growth of a factor of 2.1 over the redshift interval and a further factor of 1.4 between and the present day.
Observationally, a vast number of studies over the last few years provide evidence that BCGs have experienced dry mergers (e.g, Bernardi et al., 2007; Lauer et al., 2007; von der Linden et al., 2007; Liu et al., 2008) and have built up a large part of their stellar mass via mergers at (e.g, Liu et al., 2009, 2013; Tovmassian & Andernach, 2012; Edwards & Patton, 2012; Lidman et al., 2012). The estimated mass growth factors in these studies (Lidman et al., 2013; Burke & Collins, 2013; Ascaso et al., 2014) range from to , suggesting major mergers as the primary formation mechanism.
However, contrary to the above observations and the most recent simulations (e.g, Laporte et al., 2013), there are other studies that advocate for little change in stellar masses and sizes of BCGs since (e.g, Collins et al., 2009; Stott et al., 2010; Stott et al., 2011). These studies compared high-redshift BCGs in X-ray clusters to their counterparts in present-day clusters of the same X-ray luminosity. They claimed that the X-ray selected systems at already have more than of their final stellar mass and of their final sizes. A possible interpretation of this discrepancy could be a selection bias (Lidman et al., 2013), or an early relaxation of high-redshift BCGs in X-ray clusters, which would therefore imply that they change little in their subsequent evolution.
Direct observational evidence for dry merging has indeed been found in low-redshift () central galaxies in groups and clusters by a number of researchers (e.g, McIntosh et al., 2008; Liu et al., 2009; Rasmussen et al., 2010; Brough et al., 2011; Edwards & Patton, 2012). Some evidence has also been presented at higher redshift (). For example, Mulchaey et al. (2006) and Jeltema et al. (2007) reported some examples of dry mergers involving central galaxies in intermediate-redshift groups. Tran et al. (2008) reported a observational analysis of supergroup SG 1120-1202 at , which is expected to merge and form a cluster as massive as to Coma cluster. They argued that group environment is critical for the process of major dry merging. Rines et al. (2007) reported a very massive cluster (CL0958+4702) at , in which a major dry merger is ongoing to build up the more massive BCG. They argued that major mergers might be fairly common in deep images of galaxy clusters at intermediate redshifts, and BCGs may be assembled through late major mergers. Lidman et al. (2013) identified three merging pairs in their high-redshift cluster sample, only the pair in RDCX 1252 () shows evidence for a merger.
In the local Universe, it is known that the incidence rate of major mergers involving central galaxies in clusters (Liu et al., 2009) is higher than that in groups (McIntosh et al., 2008). In this work, we perform a search for ongoing major mergers in a homogeneous sample of intermediate-redshift clusters. We find four BCGs (COSMOS-P 125516, 102810, 036694 and 089357) in major dry merging in 29 X-ray-selected clusters at in the Cosmological Evolutionary Survey (COSMOS) by Finoguenov et al. (2007). The high-resolution HST/ACS F814W band imaging data reveals the prominent morphological signatures of dry mergers (close and comparable multiple nuclei, broad surrounding plumes and/or significant asymmetries in the isophotes) in these systems. We studied their stellar population, investigated possible connection of mergers with the formation of BCG envelopes, and discussed the stellar assembly of BCGs in the last Gyr. Throughout the paper we adopt a cosmology with a matter density parameter , a cosmological constant and a Hubble constant of
2 Identifications of BCGs and Major mergers
We searched for BCGs involved in major mergers in a catalog of X-ray clusters published by Finoguenov et al. (2007, hereafter F07), which includes 72 X-ray clusters at identified from the first 36 XMM-Newton pointings on the COSMOS field. We restricted our search in 29 X-ray clusters in the redshift interval of . It is difficult to identify dry merger features, such as broad stellar ‘fans’ and diffuse tails (Rix & White, 1989; Combes et al., 1995), at higher redshift with HST/ACS F814w band images in COSMOS because of the significant effects of cosmic surface brightness dimming and bandpass shifting. Despite the small size of this sample, it is a more statistically homogeneous sample compared to other samples collected from many small HST snapshot programs, since COSMOS is the largest contiguous field ever imaged with HST.
| Cluster ID | BCG ID | R.A.(J2000) | Dec.(J2000) | |||||||||||||
| (1) | (2) | (3) | (4) | (5) | (6) | (7) | (8) | (9) | (10) | (11) | (12) | (13) | (14) | (15) | (16) | (17) |
| ( erg ) | (mag) | (kpc) | () | (kpc) | (Gyr) | (mag) | (mag) | |||||||||
| 52 | COSMOS-P 125516 | 150.37774 | 2.41224 | 0.3489 | 0.3488 | -23.86 | 6.55 | 0.32 | 18.24 | 19.49 | 16.1 | 2.71 | 1.35 | |||
| 150.37727 | 2.41210 | 8.75 | 18.61 | |||||||||||||
| 64 | COSMOS-P 102810 | 150.23333 | 2.47626 | 0.3816 | -24.05 | 7.04 | 0.23 | 18.55 | 19.34 | 18.6 | 2.97 | 1.56 | ||||
| 150.23336 | 2.47623 | 0.63 | 20.38 | |||||||||||||
| 150.23368 | 2.47608 | 7.15 | 18.51 | |||||||||||||
| 120 | COSMOS-P 036694 | 149.75633 | 2.79472 | 0.4917 | 0.4936 | -24.24 | 7.21 | 0.23 | 17.87 | 19.99 | 16.4 | 2.87 | 1.42 | |||
| 149.75621 | 2.79469 | 2.74 | 19.01 | |||||||||||||
| 149.75656 | 2.79446 | 7.55 | 20.34 | |||||||||||||
| 80 | COSMOS-P 089357 | 150.11266 | 2.55611 | 0.5022 | -24.09 | 12.91 | 0.22 | 18.30 | 19.94 | 19.9 | 1.56 | 0.25 | ||||
| 150.11237 | 2.55605 | 6.51 | 19.66 |
Note: Col:(1) Cluster ID in the F07 cluster catalog. Col:(2) Rest-frame luminosity in the 0.1-2.4 keV band of the cluster in the F07 cluster catalog. Col:(3) BCG ID from the NASA/IPAC Extragalactic Database (NED). Col:(4) R.A.(J2000.0) of member (nucles) in merging. Col:(5) Dec.(J2000.0) member (nucleus) in merging. Col:(6) Photometric redshift of the BCG. Col:(7) Spectroscopic redshift of the BCG. Col:(8) Absolute magnitude in HST/ACS F814W Iband. No k-correction and extinction correction are applied. Col:(9) Effective radius of the whole merging system. Col:(10) Stellar mass estimated by the SED fitting. Col:(11) The projected separation of members (nuclei) in merging. Col:(12) The merger time-scale estimated by the formula of Kitzbichler & White (2008) Col:(13) The best fitted magnitude for each member (or nucleus) by GALFIT. Col:(14) The magnitude of residual images after subtracting the best models. The masked region is not included in the calculaton. Col:(15) The flux ration of redidual and initial image within . The masked region is not included in the calculaton. Col:(16) The asymmetric factor () within aperture ( radius). Col:(17) The asymmetric factor () within . The parameters in Col.(8)-(10) are from the measurements on the regions brighter than 26 .
The F07 X-ray cluster catalog provides the center and the photometric redshift of each cluster candidate, but it does not provide the BCG candidate in each cluster. The cluster center is defined by the peak of X-ray emission. The majority of photometric redshifts are estimated using the early photo- catalog of galaxies in COSMOS (Mobasher et al., 2007) and the rest of the photometric redshifts are from other sources (see F07 for details). The accuracy of photo- in the catalog of Mobasher et al. (2007) is . Subsequently, Ilbert et al. (2009) improved the photo- accuracy by using 30-bands photometric data and provided absolute magnitudes in the Subaru -band for galaxies in the 2 COSMOS field. The accuracy of photo- is improved to . Since the used photometric redshifts in F07 have larger uncertainties, in order to select reliable BCG candidates, we firstly selected galaxies within the radius of 1 Mpc from the cluster center and a photo- gap of as temporary member candidates in a cluster. We re-calculated the cluster redshift to be the median value of photometric redshifts of the recognized ‘members’ using the more accurate photo- values in Ilbert et al. (2009). We then applied this newly-derived cluster redshift to re-select member candidates within the radius of 1 Mpc from a given cluster center and a photo- gap of , and re-calculated the absolute magnitudes of these member galaxies. In this step, we used the spectroscopic redshifts instead of photo- if they were available from the zCOSMOS redshift survey (Lilly et al., 2009). We also supplemented the photometric redshifts for X-ray sources from Salvato et al. (2009). The brightest one in the member galaxies in a cluster is finally selected as our BCG candidate.
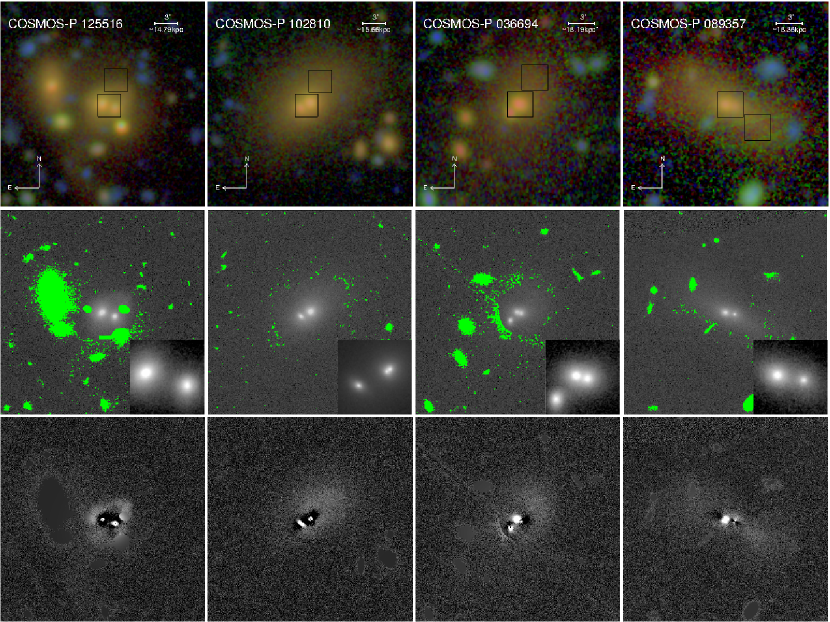
We then extracted the imaging data of 29 sample BCGs from COSMOS Archive website111http://irsa.ipac.caltech.edu/data/COSMOS/ and performed visual inspection. Four BCGs (COSMOS-P 125516, 102810, 036694 and 089357) in the corresponding clusters with ID of 52, 64, 120, 80 in the F07 catalog caught our high attention due to significant merging features, such as close multiple nuclei and extended surrounding plumes, shown in the high-resolution HST/ACS F814W band images. Their composite pseudo-color images made with the Subaru ,,-band images (top panels) and HST/ACS F814W band images (middle panels) are shown in the Figure 1, respectively. Some characteristics of these candidates are listed as follows, ordered in increasing redshift (hereafter the same ordering will be adopted). Note that there are the spectroscopic redshifts available for COSMOS-P 125516 and 036694 only. We used the photometric redshifts available in Ilbert et al. (2009) for the other two candidates.
COSMOS-P 125516 is a typical pair of early-type galaxies with a projected separation of 1.77 (). The merging features (e.g., bridges and plumes) are obvious.
COSMOS-P 102810 looks like a merging ‘pair’ of early-type galaxies, but the high-resolution HST/ACS imaging reveals spectacular double nuclei in one of members, which have a projected separation of only 0.12 (). Broad surrounding plumes to the northwest of its image can be seen clearly, extending to (, also see §4).
COSMOS-P 036694 is a triple system. The two closest nuclei have a projected separation of only 0.45 (). Broad surrounding plumes, extending to (), is also obvious on the northwest of the BCG.
COSMOS-P 089357 has close double nuclei with a projected separation of 1.06 (). It has very broad and symmetric stellar plumes extending to () along the semi-major axis.
We further quantified our visual inspection with a method used in previous studies (Wen et al., 2009; Liu et al., 2009) to efficiently identify merging signatures in the absence of spectroscopic information for merging members. We applied the GALFIT package (Peng et al., 2002) to construct a smooth symmetric Sérsic (Sérsic 1968) model for every target member in the projected merging list. The modeling procedure gives a fitted magnitude for each target member and a residual image for each candidate.
All these candidates have at least a pair of members (nuclei) with the magnitude difference , which can be classified as major mergers (Bell et al., 2006). All of them have significant residuals and merging signatures, which are seen more clearly in their residual images (see bottom panels of Figure 1). The magnitudes of the four residual images are 19.49, 19.34, 19.99 and 19.94, which correspond to 16.1%, 18.6%, 16.4% and 19.9% of their initial images, respectively. The asymmetric factor () for each residual can be calculated following the method of Wen et al. (2009). This factor measures the brightness difference between pixels and those of symmetric pixels with respect to centers of target members. The derived values for COSMOS-P 125516, 102810, 036694, and 089357 are 2.71, 2.97, 2.87 and 1.56 for their inner regions within 3 aperture (1.5 radius), respectively. The values become 1.35, 1.56, 1.42 and 0.25 for the regions within twice measured effective radius (). It shows that these candidates have significant asymmetry in their inner and/or outer isophotes (e.g.,, Wen et al., 2009). Note that the outer isophotes of COSMOS-P 089357 are relatively symmetric, indicating this merging system has been well-relaxed in its outskirts and a perfect structure resembling cD galaxy has formed (see §4). Some derived parameters for four candidates are listed in Table 1.
3 Stellar population analysis
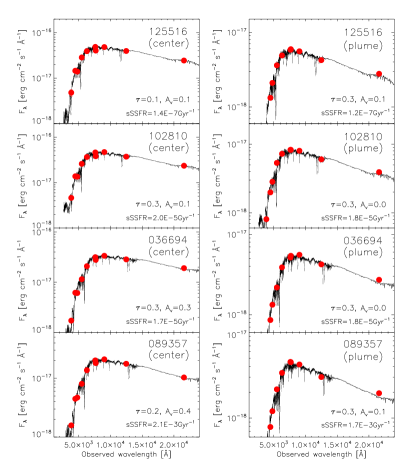
We investigated stellar population of four major mergers by fitting their spectral energy distributions (SEDs) in optical and near-infrared broad bands measured from multi-wavelength imaging data available in COSMOS survey. We used the CFHT(, and -band), Subaru (, , , , and -band) and UKIRT (-band) observations because they are also deep and with high spatial resolution (0.15′′/pixel). Since it has been shown that the evolutionary composite stellar populations (CSPs) can more exactly describe the evolutionary history of COSMOS galaxies (Bolzonella et al., 2010), we followed Bolzonella et al. (2010) to construct a series of evolutionary CSP templates from the libraries of simple stellar populations (SSPs) of Bruzual & Charlot (2003, hereafter BC03) with exponentially declining star formation histories (SFHs), with -folding times =0.1, 0.2, 0.3, 0.5, 1 and 2 Gyr. We used an updated version of the code (Bolzonella et al., 2000), kindly made available to us by M. Bolzonella, which performs SED fitting at a fixed redshift. We performed the best fittings on the observed SEDs in the regions of centers and outer plumes within 3 boxes (marked on the top panels of Figure 1) with the fixed solar metallicity and Chabrier initial mass function (Bolzonella et al., 2010). The dust extinction was modeled using the Calzetti extinction law (Calzetti et al., 2000). The results (see Figure 2) show the SEDs of both centers and outer plumes of four systems can be well described by an exponentially declining SFH with a very short -folding time (0.1 - 0.3 Gyr) and with extremely low specific star formation rates (sSFRs ). The results from the SED fitting indicate that the star formation history of these four BCGS is consistent with that of typical quiescent elliptical galaxies.
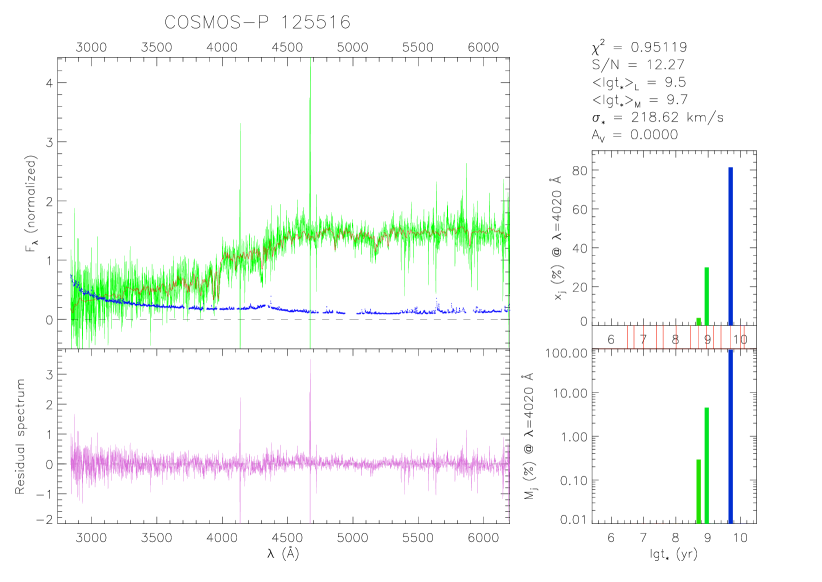
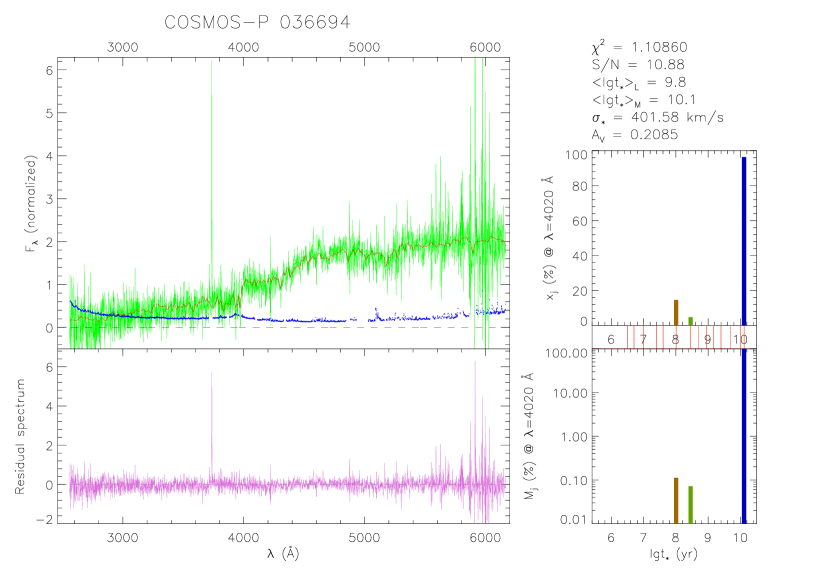
The Sloan Digital Sky Survey (SDSS) has spectroscopic data available for COSMOS-P 125516 and 036694, which have the signal-to-noise ratio (S/N) of 12.27 and 10.88, respectively. Since their SFHs can be well modeled by an exponentially declining SFR with very short e-folding timescale () that is close to an instantaneous burst (). We follow Liu et al. (2012) to adopt a serial of spectral templates of SSP with the fixed solar metallicity but different ages to estimate the light and mass percentage ratios of their stellar populations at different ages. We show that the light and mass ratio among young ( Gyr), intermediate age ( Gyr) and old ( Gyr) stellar population is 3.37 : 25.95 : 70.68 and 0.29 : 4.51 : 95.20 for COSMOS-P 125516, and 16.73 : 0 : 83.27 and 0.18 : 0 : 99.82 for COSMOS-P 036694, respectively. It shows recent star formation only contributes a very small (even negligible) percentage to their stellar mass. This result is roughly consistent with the finding in our early study of low-redshift BCGs (Liu et al., 2012).
4 Envelopes & merging process
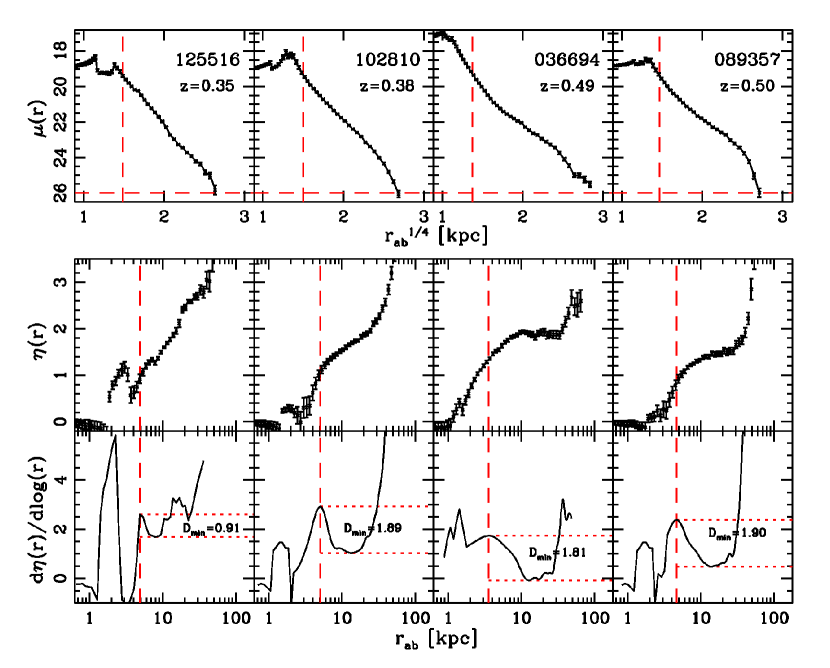
The surface brightness profiles of a large fraction of local BCGs show strong deviation from a perfect de Vaucouleurs (de Vaucouleurs 1948) or Srsic (Srsic 1968) profile since these BCGs are embedded in extensive luminous stellar halos. The envelopes (halos) in BCGs can be recognized more clearly by identifying the signatures of plateau in the Petrosian profiles and valley in the profiles (Liu et al., 2008). We have presented evidence that the formation of extended stellar envelopes in local BCGs are closely connected with dry merger process by analyzing the gradient of their Petrosian profiles (see Liu et al., 2008, for details). Here we investigate if such envelopes are observed in these merging systems at intermediate redshift. We performed the surface photometry on these four systems following the method used in Liu et al. (2008). Figure 4 shows their surface brightness profiles to in HST/ACS F814W band, corresponding Petrosian profiles and profiles from top to bottom, respectively. It can be seen that these parameter profiles fluctuate significantly in inner regions (within the radius marked with red vertical dashed lines in Figure 4) due to the existence of multiple nuclei. However, their light profiles at large radii are relatively smooth. There are obvious plateaus in the profiles and valleys in the profiles of all four mergers. The values derived in the profiles of four systems (COSMOS-P 125516, 102810, 036694, and 089357) are 0.91, 1.89, 1.81, and 1.90 (see bottom panels in Figure 4), respectively. These values are larger than the median value () for local BCG sample in Liu et al. (2008). It shows that they have extended envelopes in their outskirts and are likely forming cD galaxies, moreover, the broad stellar fans can also be seen clearly on their images (see bottom panels of Figure 1). The signatures of cD galaxies in both intermediate-redshift and local merging BCGs (Liu et al., 2009) and the fans corresponding to cD galaxy envelopes suggest that the extended stellar halos of BCGs are likely due to major mergers and they appear shortly after merger takes place.
5 Major merger rate and Stellar assembly of BCGs
We have identified 4 BCGs in major dry merging in 29 X-ray clusters at (with a median value of ). We estimate the merger time-scale for each merger by the equation (1) in Liu et al. (2009), which is derived from the Millennium Simulation by Kitzbichler & White (2008). We find that the merger time-scale of our mergers ranges from 0.22 to 0.32 Gyr with a mean value of 0.25 Gyr. (see Column 11 in Table 1). Thus, we obtain a major dry merger rate of merger per Gyr at , where the error is assumed to be a Poisson error. In our previous work (Liu et al., 2009), we used a broader criterion to select 18 ( percent of the total) major dry merging pairs (or triples) involving the BCG in 515 C4 clusters at (with a median value of ). The time-scale of those local mergers ranges from 0.04 to 0.55 Gyr with a mean value of 0.3 Gyr (see Liu et al., 2009, for details). A major merger rate of at can thus be determined as well. Parameterizing the evolution of major merger rate in the form of , we find that at . Here, we stress that the number of BCGs in our intermediate-redshift sample is small and the resulting statistical uncertainty is relatively large. The two predominant members (nuclei) in our intermediate-redshift mergers have an average magnitude difference of , which is comparable to that () of local merger pairs/triples in Liu et al. (2009) and corresponds to a luminosity ratio. We assume a fraction of of the companion galaxy is accreted to the primary galaxy. Therefore, in each merger the central galaxy increases its luminosity (mass) by 25 percent () on average. If the major merger rate evolves in our estimated form above since and the merger time-scale follows the formula of Kitzbichler & White (2008), it follows that a present-day BCG has on average increased its mass (luminosity) by per cent () from at a mean rate of per cent () per Gyr. Thus, a large fraction of the stellar mass of a present-day BCG is assembled via major dry mergers in the last Gyr.
6 Summary & Discussion
In this work, we have identified four BCGs in major dry merging in 29 X-ray clusters at , which are selected in a homogeneous cluster sample in COSMOS published by Finoguenov et al. (2007). These major mergers have two predominant members (nuclei) with the magnitude difference of and projected separation of 10 kpc, and showing signatures of interaction in the form of broad stellar plumes and/or significant asymmetries in residual images. They are composed of an old, passively evolving stellar population, and with negligible amount of young stars. Photometric analysis show that broad stellar plumes in their outskirts have roughly formed extended stellar envelopes (cD halos), which provides evidence for the connection of mergers with the formation of stellar halos.
We have obtained a major dry merger rate of merger per Gyr at if the time-scale of our mergers follows the calibration of Kitzbichler & White (2008). This major merger rate at moderate redshift is higher than that rate of at presented in Liu et al. (2009). We estimate that the major merger rate may increase in the form of to . We conclude that a present-day BCG has on average increased its luminosity (mass) by per cent (by a factor of ) via major dry mergers from at a mean merger rate of per cent per Gyr, under the assumption that half of the mass of the companion is accreted to the primary galaxy (). While the statistical uncertainty, which stems from the small size of our intermediate-redshift sample, is relatively large, the estimated amount of mass growth is roughly consistent with the most recent predictions of Laporte et al. (2013) from numerical simulations. Lidman et al. (2013) found that 3 of the 14 BCGs at are likely to experience a major merger within 600 Myr and derived a mass growth rate of 7 per cent under the same assumption. Our rate is comparable to their mass growth rate at high redshift. Edwards & Patton (2012) showed that BCGs at are adding as much as 10 per cent of their stellar mass via both major and minor mergers over 0.5 Gyr. It is not unreasonable that our rate is considerably lower than theirs since we include only major mergers in our analysis. Our study supports the notion that major dry mergers play the dominant role in the late mass assembly of BCGs. In conjunction with our previous findings in Liu et al. (2009), the discovery of these intermediate-redshift merging BCGs is clear evidence of ongoing assembly of BCGs via major dry mergers over the last 6 Gyr.
Acknowledgments
We thank Shude Mao, David C. Koo, Hassen M. Yesuf for useful comments, and especially thank M. Bolzonella for his code and helpful suggestions. We also acknowledge the anonymous referee for a constructive report that improved the paper. This project was supported by the NSF grants of China (11103013, 11203033) and the Program for Liaoning Excellent Talents in University (LNET).
References
- Ascaso et al. (2014) Ascaso B., Lemaux B. C., Lubin L. M., Gal R. R., Kocevski D. D., Rumbaugh N., Squires G., 2014, MNRAS, 442, 589
- Bell et al. (2006) Bell E. F., Naab T., McIntosh D. H., Somerville R. S., Caldwell J. A. R., Barden M., Wolf C., Rix H.-W., et al. 2006, ApJ, 640, 241
- Bernardi et al. (2007) Bernardi M., Hyde J. B., Sheth R. K., Miller C. J., Nichol R. C., 2007, AJ, 133, 1741
- Bolzonella et al. (2010) Bolzonella M., Kovač K., Pozzetti L., Zucca E., Cucciati O., Lilly S. J., Peng Y., Iovino A., Zamorani G., et al. 2010, A&A, 524, A76+
- Bolzonella et al. (2000) Bolzonella M., Miralles J.-M., Pelló R., 2000, A&A, 363, 476
- Brough et al. (2005) Brough S., Collins C. A., Burke D. J., Lynam P. D., Mann R. G., 2005, MNRAS, 364, 1354
- Brough et al. (2011) Brough S., Tran K.-V., Sharp R. G., von der Linden A., Couch W. J., 2011, MNRAS, 414, L80
- Bruzual & Charlot (2003) Bruzual G., Charlot S., 2003, MNRAS, 344, 1000
- Burke & Collins (2013) Burke C., Collins C. A., 2013, MNRAS, 434, 2856
- Calzetti et al. (2000) Calzetti D., Armus L., Bohlin R. C., Kinney A. L., Koornneef J., Storchi-Bergmann T., 2000, ApJ, 533, 682
- Collins et al. (2009) Collins C. A., Stott J. P., Hilton M., Kay S. T., Stanford S. A., Davidson M., Hosmer M., Hoyle B. et al., 2009, Nature, 458, 603
- Combes et al. (1995) Combes F., Rampazzo R., Bonfanti P. P., Prugniel P., Sulentic J. W., 1995, A&A, 297, 37
- De Lucia & Blaizot (2007) De Lucia G., Blaizot J., 2007, MNRAS, 375, 2
- de Vaucouleurs (1948) de Vaucouleurs G., 1948, Ann. Astrophys., 11, 247
- Edwards & Patton (2012) Edwards L. O. V., Patton D. R., 2012, MNRAS, 425, 287
- Fabian (1994) Fabian A. C., 1994, ARA&A, 32, 277
- Finoguenov et al. (2007) Finoguenov A., Guzzo L., Hasinger G., Scoville N. Z., Aussel H., Böhringer H., Brusa M., Capak P., et al. 2007, ApJS, 172, 182
- Gallagher & Ostriker (1972) Gallagher III J. S., Ostriker J. P., 1972, AJ, 77, 288
- Graham et al. (1996) Graham A., Lauer T. R., Colless M., Postman M., 1996, ApJ, 465, 534
- Ilbert et al. (2009) Ilbert O., Capak P., Salvato M., Aussel H., McCracken H. J., Sanders D. B., Scoville N., Kartaltepe J. et al., 2009, ApJ, 690, 1236
- Jeltema et al. (2007) Jeltema T. E., Mulchaey J. S., Lubin L. M., Fassnacht C. D., 2007, ApJ, 658, 865
- Jones & Forman (1984) Jones C., Forman W., 1984, ApJ, 276, 38
- Kitzbichler & White (2008) Kitzbichler M. G., White S. D. M., 2008, MNRAS, 391, 1489
- Laporte et al. (2013) Laporte C. F. P., White S. D. M., Naab T., Gao L., 2013, MNRAS, 435, 901
- Laporte et al. (2012) Laporte C. F. P., White S. D. M., Naab T., Ruszkowski M., Springel V., 2012, MNRAS, 424, 747
- Lauer et al. (2007) Lauer T. R., Faber S. M., Richstone D., Gebhardt K., Tremaine S., Postman M., Dressler A., Aller M. C. et al., 2007, ApJ, 662, 808
- Lidman et al. (2013) Lidman C., Iacobuta G., Bauer A. E., Barrientos L. F., Cerulo P., Couch W. J., Delaye L., Demarco R. et al., 2013, MNRAS, 433, 825
- Lidman et al. (2012) Lidman C., Suherli J., Muzzin A., Wilson G., Demarco R., Brough S., Rettura A., Cox J. et al., 2012, MNRAS, 427, 550
- Lilly et al. (2009) Lilly S. J., Le Brun V., Maier C., Mainieri V., Mignoli M., Scodeggio M., Zamorani G., Carollo M. et al., 2009, ApJS, 184, 218
- Liu et al. (2013) Liu F. S., Guo Y., Koo D. C., Trump J. R., Barro G., Yesuf H., Faber S. M., Giavalisco M. et al., 2013, ApJ, 769, 147
- Liu et al. (2009) Liu F. S., Mao S., Deng Z. G., Xia X. Y., Wen Z. L., 2009, MNRAS, 396, 2003
- Liu et al. (2012) Liu F. S., Mao S., Meng X. M., 2012a, MNRAS, 423, 422
- Liu et al. (2012) Liu F. S., Wen Z. L., Han J. L., Meng X. M., 2012b, Science China Physics, Mechanics, and Astronomy, 55, 354
- Liu et al. (2008) Liu F. S., Xia X. Y., Mao S., Wu H., Deng Z. G., 2008, MNRAS, 385, 23
- Matthews et al. (1964) Matthews T. A., Morgan W. W., Schmidt M., 1964, ApJ, 140, 35
- McIntosh et al. (2008) McIntosh D. H., Guo Y., Hertzberg J., Katz N., Mo H. J., van den Bosch F. C., Yang X., 2008, MNRAS, 388, 1537
- Merritt (1985) Merritt D., 1985, ApJ, 289, 18
- Mobasher et al. (2007) Mobasher B., Capak P., Scoville N. Z., Dahlen T., Salvato M., Aussel H., Thompson D. J., Feldmann R. et al., 2007, ApJS, 172, 117
- Mulchaey et al. (2006) Mulchaey J. S., Lubin L. M., Fassnacht C., Rosati P., Jeltema T. E., 2006, ApJ, 646, 133
- Naab et al. (2009) Naab T., Johansson P. H., Ostriker J. P., 2009, ApJ, 699, L178
- Ostriker & Hausman (1977) Ostriker J. P., Hausman M. A., 1977, ApJ, 217, L125
- Patel et al. (2006) Patel P., Maddox S., Pearce F. R., Aragón-Salamanca A., Conway E., 2006, MNRAS, 370, 851
- Peng et al. (2002) Peng C. Y., Ho L. C., Impey C. D., Rix H.-W., 2002, AJ, 124, 266
- Petrosian (1976) Petrosian V., 1976, ApJ, 209, L1
- Rasmussen et al. (2010) Rasmussen J., Mulchaey J. S., Bai L., Ponman T. J., Raychaudhury S., Dariush A., 2010, ApJ, 717, 958
- Richstone (1976) Richstone D. O., 1976, ApJ, 204, 642
- Rines et al. (2007) Rines K., Finn R., Vikhlinin A., 2007, ApJ, 665, L9
- Rix & White (1989) Rix H.-W. R., White S. D. M., 1989, MNRAS, 240, 941
- Ruszkowski & Springel (2009) Ruszkowski M., Springel V., 2009, ApJ, 696, 1094
- Salvato et al. (2009) Salvato M., Hasinger G., Ilbert O., Zamorani G., Brusa M., Scoville N. Z., Rau A., Capak P. et al., 2009, ApJ, 690, 1250
- Schombert (1988) Schombert J. M., 1988, ApJ, 328, 475
- Sérsic (1968) Sérsic J. L., 1968, Atlas de Galaxias Australes (Cordoba, Argentina: Observatorio Astronomico)
- Smith et al. (2005) Smith G. P., Kneib J.-P., Smail I., Mazzotta P., Ebeling H., Czoske O., 2005, MNRAS, 359, 417
- Stott et al. (2011) Stott J. P., Collins C. A., Burke C., Hamilton-Morris V., Smith G. P., 2011, MNRAS, 414, 445
- Stott et al. (2010) Stott J. P., Collins C. A., Sahlén M., Hilton M., Lloyd-Davies E., Capozzi D., Hosmer M., Liddle A. R. et al., 2010, ApJ, 718, 23
- Tovmassian & Andernach (2012) Tovmassian H. M., Andernach H., 2012, MNRAS, 427, 2047
- Tran et al. (2008) Tran K.-V. H., Moustakas J., Gonzalez A. H., Bai L., Zaritsky D., Kautsch S. J., 2008, ApJ, 683, L17
- von der Linden et al. (2007) von der Linden A., Best P. N., Kauffmann G., White S. D. M., 2007, MNRAS, 379, 867
- Wen et al. (2009) Wen Z. L., Liu F. S., Han J. L., 2009, ApJ, 692, 511
- White (1976) White S. D. M., 1976, MNRAS, 174, 19