119–126
Rotation Measures in AGN jets
seen by VLA at 21 cm to 6 mm
Abstract
We present Faraday Rotation Measure (RM) properties of seven active galactic nuclei (AGN),
observed with the NRAO VLA at three epochs in 2012-2014. Data was taken at 1.4, 2.2, 5.0, 8.2,
15.4, 22.4, 33.5 and 43.1 GHz quasi simultaneously in full polarization mode.
For the first time RMs were calculated in a range of wavelengths covering more than one order
of magnitude: from 21 cm up to 6 mm.
We measured RM for each source and showed a tendency to increase its value toward high
frequencies according to the law with
1.60.1. For 0710+439, we observed an increase over the frequency range
of 4 orders of magnitude and measured one of the highest RM ever,
rad/m2.
Analysis of different epochs shows variations of the value and the sign of RM
on short and long time-scales. This may be caused by changing physical conditions in the
compact regions of the AGN jets, e.g. strength of magnetic field, particle density and so on.
keywords:
galaxies: active, nuclei, jets, magnetic fields.1 Introduction
Due to presence of highly magnetized media in the close vicinity of, and in AGN jets themselves, polarized emission is the subject of Faraday effects ([Faraday (1933), Faraday 1993]). One of them is Faraday rotation, which causes rotation of the plane of polarization of an electromagnetic wave. As a result, the intrinsic position angle (EVPA), , of the jet electric vector will be rotated on a factor, depending on the plasma properties and observed wavelength. In the simplest case, when magnetized plasma isn’t intermixed with the emission region and depolarization effects are small, the EVPA depends linearly on : , where the constant is the Rotation Measure:
Thus, RM is proportional to the magnetic field component, parallel to the line of sight, and particle volume density along the path . The study of Faraday Rotation can be done only in multi-frequency observations.
Study of the polarized emission variations in AGN jets on short time scales is of particularly interest because it provides information about the jet structure and points to the locations of the regions where the emission originates and how it propagates to an observer.
Variability of the electric vector position angle in blazars on weekly, monthly and year-time intervals was shown more than once (e.g. [D’Arcangelo et al. (2007), D’Arcangelo et al. 2007], [Jorstad S. et al. (2007), Jorstad et al. 2007], [Agudo2014, Agudo et al. 2014]). So far, only few a works have been done (e.g. [Gómez et al. (2011), Gómez et al. 2011]) analyzing the region of the jet where this variability goes from and it remains to be the subject of future studies.
The goal of this work is tp probe the physical conditions in AGN jets and their structure by studying the Rotation Measures in different sources, through frequency and time.
2 Observations
We use data from the EVLA polarization calibration program ([Taylor & Myers (2010), Taylor & Myers 2010]), available from NRAO Archive111https://archive.nrao.edu/archive/advquery.jsp under project TPOL0003. Data consists of observations made at eight frequencies quasi simultaneously, with switching between frequencies made within 30 minutes sequentially. The bandwidth in each frequency band is 256 MHz. To avoid bandwidth smearing ([Gardner & Whiteoak (1966), Gardner & Whiteoak 1966]) we split bands onto 2 to 4 frequency channels, depending on the wavelength. The resulting frequency setup is given in Table 1.
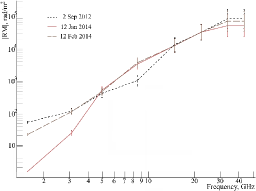
Target sources are presented in Table 2. There are 13 epochs of observations available with the frequency setup given above, starting in 2011. The configuration of the VLA during these observations goes through all possible setups. Here we present results from last 3 epochs only: 2 September 2012, 12 January 2014 and 12 February 2014.
| Band | Central frequency | Channel |
| of channels, GHz | bandwidth, MHz | |
| L | 1.423, 1.485, 1.801, 1.863 | 64 |
| S | 3.055, 3.124, 3.197, 3.253 | 64 |
| C | 4.863, 4.925, 4.991, 5.053 | 64 |
| X | 8.365, 8.431, 8.497, 8.559 | 64 |
| Ku | 14.863, 14.927, 14.991, 15.055 | 64 |
| K | 22.373, 22.457, 22.543 | 85 |
| Ka | 33.473, 33.559, 33.645 | 85 |
| Q | 43.215, 43.343 | 128 |
| B1950 source name | Alias | Optical class | Spectral type |
|---|---|---|---|
| 0552398 | DA 193 | Quasar | peaked |
| 0710439 | B3 0710+438 | Radio galaxy | steep |
| 0736017 | OI 061 | Quasar | double-peaked |
| 0851202 | OJ 287 | BL Lac | flat |
| 0923392 | 4C +39.25 | Quasar | flat one-peaked |
| 1253055 | 3C 279 | Quasar | double-peaked |
| 1308326 | OP 313 | Quasar | flat |
3 Data reduction
Data calibration and imaging is done using Obit package222http://www.cv.nrao.edu/ bcotton/Obit.html ([Cotton (2008), Cotton 2008]).
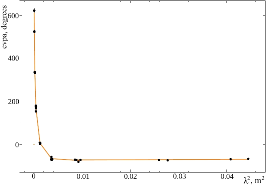
Since our observations cover wide frequency range, we probe regions in AGN jets with different Faraday depths and different physical properties. Supposing the external to the jet nature of Faraday media, EVPA should depend from wavelength-squared linearly. To sum up these two assumptions, EVPA is linear with within different intervals, but may arbitrarily change through the whole range of . Thus we identify the Rotation Measure as a linear slope in the dependence EVPA- at individual intervals. We let EVPA wrap on 180∘ between different channels and pick the solutions with the minimal and minimal number of wraps. Example of the reconstructed curve is shown on Figure 1.
Length and number of the individual intervals, where RM were obtained, varies from source to source. For instance for 0710439, given on Figure 1, RM were identified at seven intervals, solutions for which with frequency are shown on Figure 1 with solid curve.
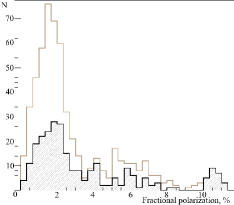
Target sources are roughly point-like even for the most extended VLA configuration. Thus, we carry out the analysis only on the central region of the map, which is composed of the optically thin and thick components of the parsec-scale jet. To conclude what component dominates in the map we analysed fractional polarization and spectral index of the sources.
Spectra have different types: flat or steep behavior, one or double peaked and are given in Table 2. The distribution of the fractional polariation, given on Figure 2, also indicates that we observed a mix of regions with different optical depths.
During the analysis, each epoch were considered independently. The typical value of rotation from Galactic media ([Taylor et al. (2009), Taylor et al. 2009]) is a few radians per meters squared which is significant only at low frequencies. We didn’t correct our measurements for it.
4 Results
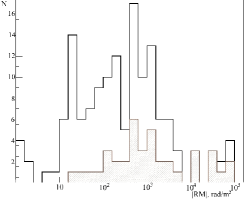
We have estimated RMs for all target sources through the whole -interval at three epochs, the distribution of which is represented on Figure 2. Variations of a few orders of magnitude in the value of RM can be seen there, meaning strong variations of physical conditions in AGN jets among sources.
For the majority of the cases, wraps of 180∘ in EVPA at some frequency bands relative to the other bands reduces considerably. Moreover, an analysis of different epochs shows good agreement between estimated values of RM and it’s trend with frequency. It is important to note that sometimes we see non-trivial EVPA- behavior which can not be fit by a linear slope. This means that other Faraday effects take place there, such as mixing of the rotating media with the emission region, multi component Faraday media with different optical depths and others.
A tendency of RM to increase in value with frequency , example of which is given on Figure 1, is found for all sources. We have used RM values for all available intervals to determine power for every target performing a linear regression of lg-lg curves. An average over all targets and three epochs is found to be 1.60.1.
Because of synchrotron self absorption increasing towards the jet base, we see regions being located closer to the central engine at higher frequencies. A possible explanation of the trend of higher RM at higher frequency is that higher frequencies probe regions closer to central engine with a denser media and stronger magnetic fields. This trend indicates variations of by up to five orders of magnitude with distance from the central black hole. Theoretical estimations give a value of ([Jorstad S. et al. (2007), Jorstad et al. 2007]), asuming an outflowing sheath around a conically or spherically expanding jet with a helically-shaped magnetic field. Our low value of may result from underestimated contribution of the emission from optically thin regions. We plan to conduct a detailed study of this effect in the future.
Case of 0710439. For this source we obtained the following values of RM (in rad/m2) in the 33 - 43 GHz range: , and at three consecutive epochs given above. These values were measured independently and are in good agreement. The behavior of RM over the full frequency range for 0710439 is shown on Figure 1.
So far, high values of Rotation Measure in AGNs were observed in only a few sources (e.g. [Trippe et al. (2012), Trippe et al. 2012], [Jorstad S. et al. (2007), Jorstad et al. 2007], [Attridge et al. (2005), Attridge et al. 2005]) with the highest value of rad/m2 for Sagittarius ([Marrone et al. (2006), Marrone et al. 2006]).
Observations of all these sources, except at the center of our Galaxy, are non-simultaneous
with the differences between the observational epochs at different
frequencies of up to a few months and even years.
Our observations have an advantage over these measures, and thereby don’t include time variability
of the sources which may result in dramatically different interpreted and real
polarization pictures. Thus, 0710439 has one of the highest recorded values of RMs so far
made under assumption that Faraday screen doesn’t mix with the jet emission region.
It may mean that 0710439 holds dense media with strong magnetic
fields in the innermost jet regions.
To continue this study we plan to analyze the other 10 epochs of observations for a more detailed picture of Rotation Measure behavior in time.
This research was supported by Russian Foundation for Basic Research, research project No. 14-02-31789 mol_a. The VLA is an instrument of the National Radio Astronomy Observatory, a facility of the National Science Foundation operated under cooperative agreement by Associated Universities, Inc.
References
- [Agudo et al. (2014)] Agudo, I., Thum, C., Gómez, J.L., & Wiesemeyer, H. 2014, A&A, 566, 59
- [Attridge et al. (2005)] Attridge, J.M., Wardle, J.F.C., & Homan, D.C. 2005, ApJ,633, 85
- [Cotton (2008)] Cotton, W.D. 2008, PASP, 120, 439
- [D’Arcangelo et al. (2007)] D’Arcangelo, F.D., Marscher, A.P., Jorstad, S.G., Smith, P.S., Larionov, V.M., Hagen-Thorn, V.A., Kopatskaya, E.N., Williams, G.G., & Gear, W.K. 2007, ApJ, 659, 107
- [Faraday (1933)] Faraday, M. 1933, in Faradayś Dairy, ed. T. Martin, London: Bell, 264
- [Gardner & Whiteoak (1966)] Gardner, F.F., & Whiteoak, J.B. 1966, ARA&A, 4, 245
- [Gómez et al. (2011)] Gómez, J.L., Roca-Sogorb, M., Agudo, I., Marscher, A.P., & Jorstad, S.G. 2011, ApJ, 733, 11
- [Jorstad S. et al. (2007)] Jorstad, S.G., Marscher, A.P., Stevens, J,A., Smith, P.S., Forster, J.R., Gear, W.K., Cawthorne, T.V., Lister, M.L., Stirling, A.M., Gómez, J.L., Greaves, J.S., & Robson, E.I. 2007, AJ, 134, 799
- [Marrone et al. (2006)] Marrone, D.P., Moran, J.M., Zhao, J.-H., & Rao, R. 2006, JPhCS, 54, 354
- [Taylor et al. (2009)] Taylor, A.R., Stil, J.M., & Sunstrum, C. 2009, ApJ, 702, 1230
- [Taylor & Myers (2010)] Taylor, G.B., & Myers, S.T. 2010, VLBA Scientific Memo 26 (NRAO)
- [Trippe et al. (2012)] Trippe, S., Neri, R., Krips, M., Castro-Carrizo, A., Bremer, M., Piétu, V., & Winters, J.M. 2012, A&A, 540, 74