New multiwavelength observations of the Of?p star CPD 28∘ 2561
Abstract
A rather strong mean longitudinal magnetic field of the order of a few hundred Gauss was detected a few years ago in the Of?p star CPD 2561 using FORS2 low-resolution spectropolarimetric observations. In this work we present additional low-resolution spectropolarimetric observations obtained during several weeks in 2013 December using FORS 2 (FOcal Reducer low dispersion Spectrograph) mounted at the 8-m Antu telescope of the VLT. These observations cover a little less than half of the stellar rotation period of 73.41 d mentioned in the literature. The behaviour of the mean longitudinal magnetic field is consistent with the assumption of a single-wave variation during the stellar rotation cycle, indicating a dominant dipolar contribution to the magnetic field topology. The estimated polar strength of the surface dipole is larger than 1.15 kG. Further, we compared the behaviour of the line profiles of various elements at different rotation phases associated with different magnetic field strengths. The strongest contribution of the emission component is observed at the phases when the magnetic field shows a negative or positive extremum. The comparison of the spectral behaviour of CPD 2561 with that of another Of?p star, HD 148937 of similar spectral type, reveals remarkable differences in the degree of variability between both stars. Finally, we present new X-ray observations obtained with the Suzaku X-ray Observatory. We report that the star is X-ray bright with . The low resolution X-ray spectra reveal the presence of a plasma heated up to 24 MK. We associate the 24 MK plasma in CPD 2561 with the presence of a kG strong magnetic field capable to confine stellar wind.
keywords:
stars: atmospheres — stars: individual (CPD 2561) — stars: magnetic field — stars: variables: general – X-rays: stars – stars: mass-loss1 Introduction
Walborn (1973) introduced the Of?p category for massive O stars displaying recurrent spectral variations in certain spectral lines, sharp emission or P Cygni profiles in \textHe i and the Balmer lines, and strong \textC iii emission lines around 4650 Å. After the first discovery of a longitudinal magnetic field of the order of 200 G in the Of?p star HD 191612 (Donati et al., 2006), the search for a presence of a magnetic field in remaining other Of?p stars has been undertaken using FORS 2 spectropolarimetric observations by the MAGORI collaboration and using ESPaDOnS and Narval observations by the MiMeS collaboration. Only five Galactic Of?p stars are presently known: HD 108, NGC 1624-2, CPD 2561, HD 148937, and HD 191612 (Walborn et al., 2010), and all of them show evidence for the presence of magnetic fields (Martins et al., 2010; Wade et al., 2012a; Hubrig et al., 2008, 2011a, 2013; Donati et al., 2006).
Among the five known Of?p stars only the star CPD 2561 has not been studied in detail yet, neither with spectroscopy/spectropolarimetry nor in X-rays. Previous observations of the Of?p star CPD 2561 by Hubrig et al. (2011a) revealed a longitudinal magnetic field of the order of a few hundred Gauss at a significance level of more that 3.
Due to the relative faintness of CPD 2561 with =10.1, it was only scarcely studied in the past. Levato et al. (1988) acquired radial velocities of 35 OB stars with carbon, nitrogen, and oxygen anomalies and found variability of a few emission lines with a probable period of 17 days. Walborn et al. (2010) mentioned that CPD 2561 undergoes extreme spectral transformations very similar to those of HD 191612, on a timescale of weeks, inferred from the variable emission intensity of the \textC iii 4647–4650–4652 triplet. Also the spectropolarimetric observations of Hubrig et al. (2013) on three consecutive nights in 2011 revealed strong variations in several hydrogen and helium line profiles.
According to Wade et al. (2012b), CPD 2561 is currently monitored by Barbá et al. (in preparation). Petit et al. (2013) list in their Table 1 fundamental parameters and a rotation period of 70 d for this star. The most recent published result on CPD 2561 reports on a 73.41-day rotation period, probably deduced from spectroscopic monitoring (Nazé, 2014).
The presented study is the continuation of the monitoring of the magnetic field of CPD 2561 over its rotation period with FORS 1/2 at the VLT. Using service mode observations, we succeeded in covering a significant part of the rotation cycle. In Sect. 2, we give an overview of our spectropolarimetric observations and magnetic field measurements with VLT/FORS 2, followed by the discussion of the distinct spectral variability revealed in the FORS 2 spectra. Section 4 is devoted to X-ray observations obtained with the Suzaku X-ray Observatory. Finally, we summarize the results of our observations in Sect. 5.
2 Observations and magnetic field measurements
Sixteen new spectropolarimetric observations of the Of?p star CPD 2561 were carried out from 2013 December 5 to 30 in service mode at the European Southern Observatory with FORS 2 mounted on the 8-m Antu telescope of the VLT. This multi-mode instrument is equipped with polarization analyzing optics, comprising super-achromatic half-wave and quarter-wave phase retarder plates, and a Wollaston prism with a beam divergence of 22 in standard resolution mode. Polarimetric spectra were obtained with the GRISM 600B and the narrowest slit width of 04 to achieve a spectral resolving power of . The use of the mosaic detector with a pixel size of 15 m allowed us to cover a spectral range, from 3250 to 6215 Å, which includes all hydrogen Balmer lines from H to the Balmer jump.
From the raw FORS 2 data, the parallel and perpendicular beams are extracted using a pipeline written in the MIDAS environment by T. Szeifert, the very first FORS instrument scientist. This pipeline reduction by default includes background subtraction. A unique wavelength calibration frame is used for each night.
A first description of the assessment of the longitudinal magnetic field measurements using FORS 1/2 spectropolarimetric observations was presented in our previous work (e.g. Hubrig et al. 2004a, b, and references therein).
To minimize the cross-talk effect, and to cancel errors from different transmission properties of the two polarised beams, a sequence of subexposures at the retarder position angles , , , etc. is usually executed during observations. Moreover, the reversal of the quarter wave plate compensates for fixed errors in the relative wavelength calibrations of the two polarised spectra. The spectrum is calculated using:
| (1) |
where and indicate the position angle of the retarder waveplate and and are the ordinary and extraordinary beams, respectively. Rectification of the spectra was performed in the way described by Hubrig et al. (2014). Null profiles, , are calculated as pairwise differences from all available profiles. From these, 3-outliers are identified and used to clip the profiles. This removes spurious signals, which mostly come from cosmic rays, and also reduces the noise. A full description of the updated data reduction and analysis will be presented in a separate paper (Schöller et al., in preparation).
The mean longitudinal magnetic field, , is measured on the rectified and clipped spectra based on the relation
| (2) |
where is the Stokes parameter that measures the circular polarization, is the intensity in the unpolarized spectrum, is the effective Landé factor, is the electron charge, is the wavelength, is the electron mass, is the speed of light, is the wavelength derivative of Stokes , and is the mean longitudinal (line-of-sight) magnetic field.
The longitudinal magnetic field was measured using the entire spectrum including all available absorption and emission lines. The feasibility of longitudinal magnetic field measurements in massive stars using low-resolution spectropolarimetric observations was demonstrated by previous studies of O and B-type stars (e.g., Hubrig et al. 2006, 2008, 2009, 2011a, 2011b, 2013).
Note that we do not differentiate between absorption and emission lines, since the relation between the Stokes signal and the slope of the spectral line wing, as given by Eq. (2), holds for both type of lines, so that the signals of emission and absorption lines add up rather than cancel. For simplification, we assume a typical Landé factor of for all lines.
The mean longitudinal magnetic field is defined by the slope of the weighted linear regression line through the measured data points, where the weight of each data point is given by the squared signal-to-noise ratio of the Stokes spectrum. The formal error of is obtained from the standard relations for weighted linear regression. This error is inversely proportional to the rms signal-to-noise ratio of Stokes . Finally, the factor is applied to the error determined from the linear regression, if larger than 1. Furthermore, we have carried out Monte Carlo bootstrapping tests. These are most often applied with the purpose of deriving robust estimates of standard errors. In these tests, we generate 250 000 samples that have the same size as the original data set and analyse the distribution of the determined from all these newly generated data sets. The measurement uncertainties obtained before and after Monte Carlo bootstrapping tests were found to be in close agreement indicating the absence of reduction flaws.
Additionally, to check the stability of the spectral lines along the full sequence of sub-exposures, we have compared the profiles of several spectral lines recorded in the parallel beam with the retarder waveplate at . The same was done for spectral lines recorded in the perpendicular beam. The line profiles looked pretty much identical within the noise.
| MJD | Phase | Shutter time | S/N5300 | ||||
|---|---|---|---|---|---|---|---|
| [s] | [G] | [G] | |||||
| ∗55338.969 | 0.453 | 3120 | 2262 | 388 | 102 | 340 | 122 |
| ∗55685.982 | 0.181 | 5000 | 2481 | 47 | 82 | 3 | 105 |
| ∗55686.984 | 0.194 | 4800 | 2516 | 47 | 78 | -34 | 98 |
| ∗55687.980 | 0.208 | 3800 | 2490 | 203 | 69 | 211 | 60 |
| 56631.229 | 0.057 | 460 | 214 | 525 | 564 | 520 | 566 |
| 56632.228 | 0.070 | 1840 | 1051 | 405 | 162 | 436 | 190 |
| 56640.258 | 0.180 | 2300 | 1136 | 0 | 145 | 1 | 142 |
| 56641.292 | 0.194 | 2760 | 2087 | 37 | 69 | 53 | 70 |
| 56642.317 | 0.208 | 920 | 393 | 15 | 188 | 157 | 211 |
| 56643.181 | 0.220 | 2300 | 1418 | 6 | 111 | 152 | 94 |
| 56643.313 | 0.221 | 1800 | 1537 | 39 | 97 | 135 | 81 |
| 56644.192 | 0.231 | 2300 | 1201 | 16 | 113 | 1 | 114 |
| 56646.114 | 0.260 | 2300 | 1272 | 55 | 103 | 35 | 106 |
| 56647.128 | 0.273 | 2300 | 1322 | 134 | 78 | 0 | 104 |
| 56648.153 | 0.287 | 2300 | 1523 | 33 | 62 | 35 | 61 |
| 56648.319 | 0.290 | 2300 | 1975 | 32 | 71 | 17 | 65 |
| 56649.141 | 0.301 | 2300 | 1370 | 322 | 118 | 330 | 106 |
| 56649.316 | 0.303 | 2300 | 1810 | 247 | 87 | 205 | 73 |
| 56650.225 | 0.316 | 2720 | 1602 | 84 | 94 | 71 | 62 |
| 56656.272 | 0.398 | 2300 | 1777 | 345 | 90 | 348 | 96 |


The results of our magnetic field measurements, both for absorption and emission lines combined and absorption lines alone, are presented in Table 1, where we also collect information about the modified Julian date, the rotation phase, the open shutter time, and the achieved signal-to-noise ratio. We note that the previous four measurements listed in Table 1 show now slightly different values compared with the published ones (Hubrig et al., 2011a, 2013) since they have been re-analysed using the improved FORS 2 data reduction described above. The longitudinal magnetic field variation of CPD 2561 over the rotation period of 73.41 d is presented in Fig. 1, both for absorption and emission lines combined and absorption lines alone.
In spite of the fact that only a few measurements show 3 detections, the magnetic field variability with the rotation period of 73.41 d is clearly detected in our data. The obtained results confirm the excellent potential of FORS 2 for measuring magnetic fields using low-resolution spectropolarimetry. This potential was already demonstrated in the studies of the other two magnetic massive stars, Ori C, which was the first O-type star with a detected weak magnetic field varying with a rotation period of 15.4 days, and the Of?p star HD 148937 with a rotation period of 7.03 d (Hubrig et al., 2008, 2013).
The smooth variation of with phase in the FORS 2 spectra of CPD 2561 indicates that the rotation period is indeed very long. A frequency analysis applied to our magnetic data (see e.g., Hubrig et al. 2011c) revealed a prominent frequency corresponding to a period of 85.6 d. A smaller peak at the frequency corresponding to a period of 73.41 d coincided with the window function and therefore is indistinguishable from an artifact.
The observed single-wave variation in the longitudinal magnetic field during the stellar rotation cycle indicates a dominant dipolar contribution to the magnetic field topology. Assuming that the star is an oblique dipole rotator, the magnetic dipole axis tilt is constrained by
| (3) |
where the inclination angle can be derived from considerations of the stellar fundamental parameters. Using for the stellar radius (Petit et al., 2013) combined with the period of 73.41 d we obtain km s-1. On the other hand, it is clear that it is not possible to use the low-resolution FORS 2 spectra to estimate the value so that the inclination angle is not known and only a low limit of dipole strength can be estimated. We note, however, that the spectral behaviour of CPD 2561 is highly variable over the rotation period (see Sect. 3), indicating that the angle cannot be close to zero. Taking into account the parameters of the sinusoids fitted to our measurements and assuming G and a limb-darkening coefficient , we conclude that the polar strength of the surface dipole is larger than 1.15 kG.
3 Spectral variability and wind parameters of CPD 2561
Among the massive star samples studied by Hubrig et al. (2011a, 2013), both Of?p stars CPD 2561 and HD 148937 exhibited a most conspicuous spectral variability detectable in low-resolution FORS 2 spectra. With a total of 20 spectropolarimetric observations of CPD 2561 on our disposal it became now possible to investigate the spectral variability of this star in more detail over approximately half of the rotation cycle.
In the following, we discuss the behaviour of several diagnostic lines in the spectra of this star in comparison with HD 148937 for which we carried out seven observations with FORS 2 during the last years. Both stars have approximately the same spectral type around O6, and exhibit a similar spectral appearance. The first detection of a mean longitudinal magnetic field in the Of?p star HD 148937, G, using FORS 1 at the VLT was reported by Hubrig et al. (2008).
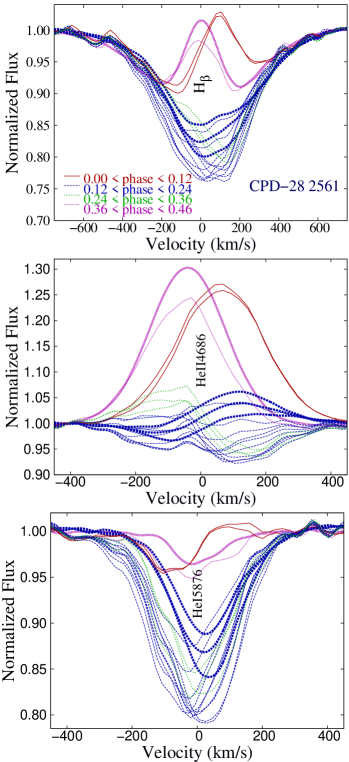
For a better presentation of the behaviour of different lines in the spectra of CPD 2561 at different rotation phases, we grouped the observations in four phase intervals, namely the observations obtained in the phase intervals from 0 to 0.12, from 0.12 to 0.24, from 0.24 to 0.36, and from 0.36 to 0.46. As in the work of Hubrig et al. (2013), to calculate the rotation phase of the observed spectra of HD 148937, we used the rotation period of 7.03 d determined by Nazé et al. (2008), who also mentioned a lower-amplitude variability of this star.
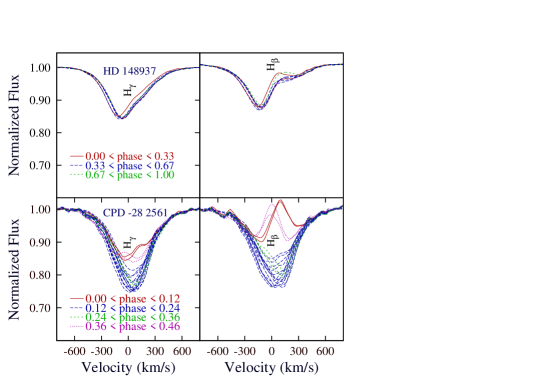
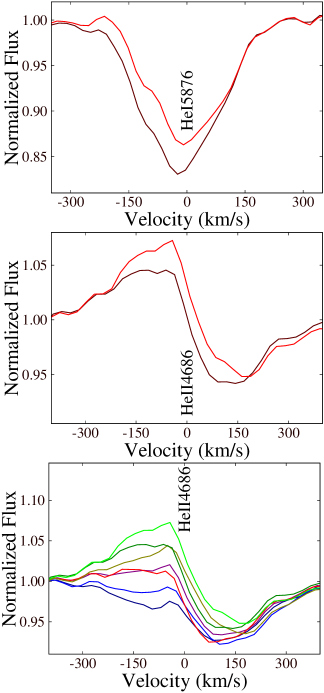
The comparison of the spectral behaviour of CPD 2561 with that of HD 148937 reveals a remarkable difference in the degree of variability between both stars. In Fig. 2, we compare the behaviour of the lower number hydrogen lines H and H phased with the rotation period of 73.41 d with that of the hydrogen lines in the spectra of HD 148937. Opposite to the behaviour of the hydrogen lines in HD 148937, the H and H lines in the spectrum of CPD 2561 undergo significant profile changes over half of the rotation cycle with the strongest contribution of the emission component at positive and negative extrema of the magnetic field.
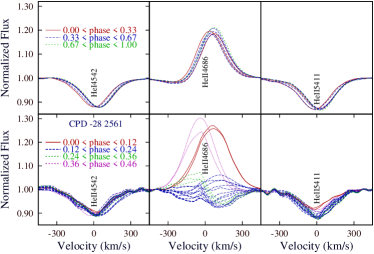
A very similar behaviour to that of hydrogen lines is observed for the \textHe ii 4686 line, which appears in full emission in the phases of the magnetic field extrema. Other \textHe ii lines show no distinct emission component, but it cannot be excluded that they are partly filled in by stellar-wind emission in the phases coinciding with the strongest magnetic field strength. The behaviour of \textHe ii 4542, \textHe ii 4686 and \textHe ii 5411 lines phased with the rotation period of 73.41 d, in comparison to that of the \textHe ii lines in in the spectra of HD 148937, is presented in Fig. 3.
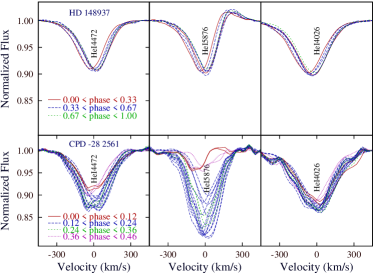
Among the \textHe i lines, the strongest variation with rotation phase is detected in \textHe i 5876, followed by the \textHe i 4472 line. Interestingly, as is shown in Fig. 4, the behaviour of the emission component in the core of the \textHe i line is reminiscent of that visible in the core of the H line presented in Fig. 2.
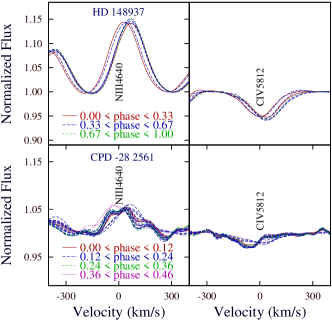
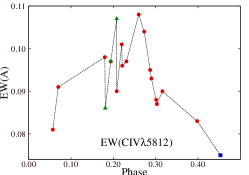
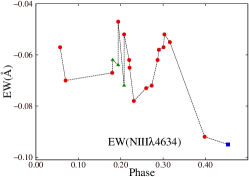
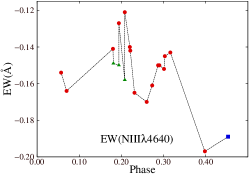
Also the metal lines exhibit distinct variability over the rotation period. The absorption component in the metal lines seems to decrease at the phases of the magnetic positive and negative extrema. The variability of the metal lines \textN iii 4640 and \textC iv 5812 phased with the rotation period of 73.41 d is presented in Fig. 5. This trend in the behaviour of metal lines is similar to the trend found for hydrogen and helium lines.
In summary, CPD 2561 shows a much stronger spectral variability compared to HD 148937. According to the Magnetic Wind Confinement (MWC) model by Babel & Montmerle (1997), dipolar magnetic fields in magnetic massive stars are able to guide stellar winds from the two opposite hemispheres towards the magnetic equator where the flows collide and the colliding flows shock to create a high-temperature, X-ray-emitting plasma. The plasma cools to form a dense disk that gives rise to optical emission. Since the reason for the variability in magnetic massive stars is usually referred to the varying projection angle of a plasma disk confined to the magnetic equatorial plane, it is possible that HD 148937 is viewed at relatively low inclination compared to the axial inclination of CPD 2561. Alternatively, the inclination angle could be large while the obliquity between the magnetic field axis and the rotation angle is small.
During the study of the behaviour of the line profile shapes belonging to different elements, we detected notable differences in the line profiles observed in identical rotation phases in the years 2010 and 2011 compared to those observed in 2013 December. As an example, we present in Fig. 6 the profiles of the lines H, \textHe ii 4686, and \textHe i 5876, observed from 2010 to 2013, with observations in the years 2010 and 2011 highlighted by thicker lines. These differences can probably be attributed either to the inaccuracy of the determination of the rotation period or to the intrinsic variability of this star, probably due to changes in the amount or distribution of emitting material with time in the magnetosphere of CPD 2561. Such a phenomenon has already been reported for other well-studied Of?p stars (Howarth et al. 2007).
To assess the short-term spectral variability of lines belonging to different elements, spectropolarimetric observations have been carried out at time intervals of just a few hours on several nights. The short-term spectral variability is easily detectable in several diagnostic lines presented in Fig. 7, indicating that these changes in the line profiles of CPD 2561 cannot be explained exclusively by rotational or magnetic modulation. This kind of variability is probably rather related to intrinsic variability of CPD 2561.
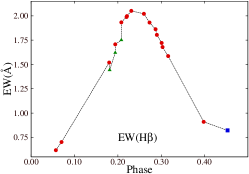
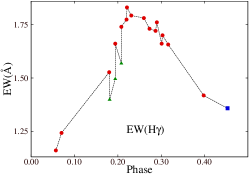
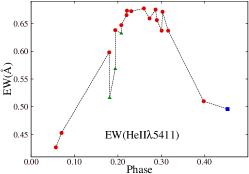
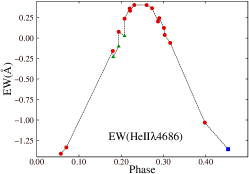
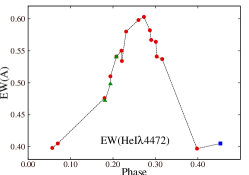
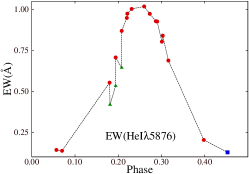
Finally, we present in Fig. 8 equivalent width variations of several spectral lines phased with the rotation period of 73.41 d. The variation of all studied lines is approximately in phase with the variations of the hydrogen lines. The equivalent widths were obtained by numerically integrating over the normalized line profiles. The uncertainties were estimated from the rms scatter in the continuum regions around the line profiles. The large scatter of the measurements around the rotation phase 0.2 is caused by differences in the behaviour of the line profiles recorded in 2010–2011 and those recorded in 2013. The behaviour of the equivalent width phased curve for \textN iii 4640 indicates the possible presence of a second minimum around the phase 0.25. More observations are needed to investigate the behaviour of nitrogen in more detail.
As no UV spectrum of CPD 2561 is currently available, to infer the mass-loss rate and the terminal velocity of the wind of CPD 2561, we tried to estimate these parameters from a high-resolution optical spectrum only. We downloaded from the ESO archive the publically available high-resolution spectropolarimetric observation of CPD 2561 obtained with the HARPS polarimeter (HARPSpol; Snik et al. 2008) attached to ESO’s 3.6 m telescope (La Silla, Chile) on 2011 December 10, which corresponds to the rotation phase 0.17. The obtained spectropolarimetric observation has a very low signal-to-noise ratio around 100 in the Stokes spectrum and a resolving power of about , covering the spectral range 3780–9107Å, with a small gap between 5259 and 5337Å. We note that such a low signal-to-noise ratio of this HARPS spectrum does not allow us to use the spectrum for the measurement of the magnetic field. The reduction and calibration of the archive spectrum were performed using the HARPS data reduction software available at the ESO headquarter in Germany.
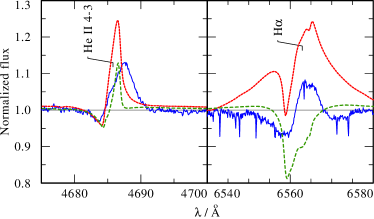
However, we already noted from Figs. 2–7 the high spectral variability of the hydrogen and helium lines. As an example, the \textHe ii 4686 line (Fig. 6) changes from emission to absorption and the center of the line profiles changes from blueshifted to redshifted. It is therefore unlikely that the observed emission line profiles originate from a stationary symmetric wind. A stationary asymmetric, e.g. polar, outflow is also not very likely, as the observed time scales of the line profile variability is much shorter than the rotation period assumed. Moreover, we found that the stellar parameters of CPD 2561, given in Petit et al. (2013), are inconsistent. For the given luminosity, , and , the stellar mass should be 86 M⊙. However, Petit et al. (2013) give 43 M⊙. Since we do not know which distance was used in Petit et al. (2013), we adopt in our analysis the spectroscopic distance of 6.1 kpc as determined by Patriarchi et al. (2003).
Therefore, instead of an accurate reproduction of the optical spectrum, to get an impression of the impact of a spherical symmetric wind with typical O star wind parameters on the emission lines, such as \textHe ii 4686 and H, we calculated a set of PoWR model atmospheres (Gräfener et al., 2002; Hamann & Gräfener, 2004). PoWR solves the radiative transfer equation in a co-moving frame and performs full non-LTE calculations of population numbers. Accordingly, it is appropriate for expanding atmospheres. We adopted solar abundances and , , and from Petit et al. (2013) and tried different combinations of and . Our tentative analysis indicates that for the given stellar parameters a symmetric wind with a typical of about /yr (cf. Vink et al. 2001) would lead to emission lines (see for example Fig. 9 presenting \textHe ii 4686), which are not seen for all phases of the rotation. Further tests indicated that some of the emission features can be reproduced by a slow outflow with velocities of km s-1, which is much below the terminal velocities of other O stars (cf. Puls et al. 1996). Thus, it seems to be likely that the O star wind is strongly affected by the magnetic field and the observed variable emission features originate neither from a stationary symmetric O star wind, nor from a polar outflow modulated with the rotational period. It can only be speculated if these emission features may stem from a highly variable magnetosphere as described by ud-Doula et al. (2013).
The magnetic field dominates the stellar wind below the radial height , where the condition is met, while above this height the solar wind is capable to stretch and open the magnetic field lines (Weber & Davis, 1967; Altschuler & Newkirk, 1969). According to our spectropolarimetric measurements, the magnetic field in CPD 2561 is strong enough to affect the stellar wind up to when we use the stellar wind parameters estimated from our modeling and . Since the hydrogen Balmer lines are formed in the lower parts of the wind, the observed spectral variability in those lines may be understood as being due to the wind material affected by the magnetic field. Recently, a first attempt to explain the spectral variability in Of?p stars was made by Sundqvist et al. (2012). These simulations rely on the assumption of a local thermodynamic equilibrium (LTE) in the Of?p-star wind that is not realistic, as O-star winds are dominated by non-LTE processes. Nevertheless, their effort highlights the potential importance of non-spherical geometries in strongly magnetic O-stars for the detailed analysis of line-profile variability.
4 X-ray observations with the Suzaku X-ray Observatory
CPD 2561 is an X-ray source detected by the Rosat X-ray observatory in 1990. From the ROSAT All-Sky Survey Faint Source Catalogue (RASS-FSC) its count rate is s-1. A radio source is also located at the same position as the X-ray source (Flesch & Hardcastle, 2004). Already Rosat observations indicated that the ratio of X-ray to bolometric luminosity () makes CPD 2561 X-ray brighter compared to an average O-type star (Chlebowski, 1989; Berghoefer et al., 1997; Oskinova, 2005). The Rosat PSPC hardness ratio () provided some evidence that X-ray emission from CPD 2561 can be harder than is typical for an O-type star.
To study its X-ray properties in more detail, we observed CPD 2561 with the Suzaku X-ray Observatory (Mitsuda et al., 2007) on 2014 April 28 for 27 ksec. Data were obtained with the XIS0, XIS1, and XIS3 detectors on board Suzaku. The star is confidently detected in all detectors. Standard data analysis using the most recent calibration was performed.
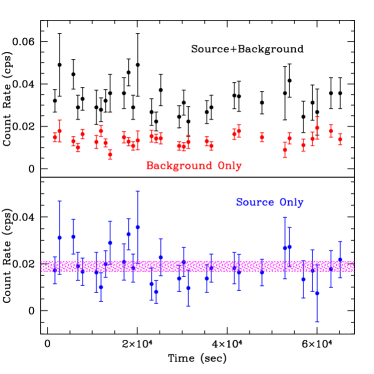
To investigate the X-ray variability, we produced the X-ray light-curves using different time binning. Data from all three detectors in the energy range of 0.7 to 2.0 keV have been combined and the counts within a circle of radius centered on the source position were collected. An annulus around the source position with an outer radius of was used as a background region. The X-ray background light-curve was extracted from this region. Figure 10 shows the resulting X-ray light curve using a binning of 1024 seconds.
The resulting light-curve was tested for variability. We tested the hypothesis of a constant source (see lower panel in Fig. 10) using fitting. A value of with 30 degrees of freedom (“dof”) indicates that the hypothesis of a constant source can not be rejected at better than 90% confidence. We conclude that there is no evidence for X-ray variability from this single observation with a total duration of about 7.5 hours. The rotation period for CPD 2561 is about 73.4 days. Thus our pointing covers less than half a percent of the star’s rotation (and its associated magnetosphere). We therefore cannot make any conclusion concerning cyclic X-ray variations over the star’s rotation period. High amplitude and rapid changes relative to the rotation period are not detected in our data.
The X-ray spectra were extracted for the source and the background regions and analyzed using the fitting software xspec (Arnaud, 1996). During the fitting process, the hydrogen column density was fixed according to the stellar reddening, E(B–V) = 0.46, and using the relation E(B–V) cm-2 (Gudennavar et al., 2012). The emission was modeled using the optically thin, thermal “mekal” emission model (Liedahl et al. 1995, and references therein) that assumes collisional ionization equilibrium (CIE). A single temperature fit to the spectrum did not give a satisfactory fit, and so we adopted a two-temperature (“2T”) model to characterize the star’s X-ray emission.
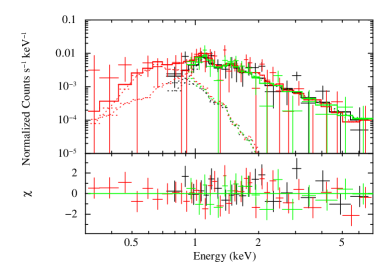
Table 2 summarizes this fit and associated quantities. The corresponding spectral fit is shown in Fig. 11. The observed X-ray flux is given in the band of 0.3–10 keV as well as the X-ray luminosity of the source, assuming a distance of 6.1 kpc. The X-ray luminosity was corrected for the adopted value of the interstellar reddening.
Two model components with different temperatures are required to achieve a satisfactory fit. A soft component with keV ( MK) is typical of OB-type stars (e.g. Waldron & Cassinelli 2007) including magnetic stars (Oskinova et al., 2011). Besides this soft emission, we detect a hard component with keV ( MK).
| Property | Value |
|---|---|
| [cm-2] | |
| [erg cm-2 s-1 ] | |
| [erg cm-2 s-1 ] | |
| [erg s-1] | |
| [keV] | |
| [cm-3] | |
| [keV] | |
| [cm-3] | |
| 66/70 | |
| 0.9 |
The presence of such a hot plasma component with an emission measure that is roughly half the emission measure of the cooler spectral component (or about a third of the total emission measure), is a special property that is observed only in a handful of stars. The average X-ray plasma temperature, , determined from spectral fits of CPD 2561 ( keV, see Table 2) is higher than found even in strongly magnetic B-type stars (Oskinova et al., 2011; Ignace et al., 2013). However, such high temperatures are deduced from the analysis of all previously studied X-ray spectra of Of?p-type stars as well as the O7fp-type star Ori C (Schulz et al., 2000; Nazé et al., 2014). The presence of the hard spectral component can be explained by wind streams from two opposite directions of the magnetosphere colliding at the terminal speed and thus producing strong shocks where the plasma is heated up to MK (Babel & Montmerle, 1997; ud-Doula & Owocki, 2002).
5 Conclusions
In this work, we used high quality FORS 2 polarimetric spectra of the Of?p star CPD 2561 to carry out magnetic field measurements and to study spectral variability. With 20 observations at our disposal, it became now possible to investigate the spectral variability of CPD 2561 over approximately half of the rotation cycle. The longitudinal magnetic field variation can be well represented by the recently reported rotational periodicity of 73.41 d.
Using the current mean longitudinal magnetic field measurements and assuming that the star is an oblique dipole rotator, we estimate that the polar strength of the surface dipole is larger than 1.15 kG. The comparison of the spectral behaviour of CPD 2561 with that of another Of?p star, HD 148937 of similar spectral type, reveals remarkable differences in the degree of variability between both stars. Since the reason for the variability in magnetic massive stars is usually referred to rotationally modulated emission from a magnetically constrained plasma, it is possible that the low-amplitude spectral variability of HD 148937 is caused by the viewing geometry, i.e. the rotation axis of HD 148937 must be viewed at relatively low inclination, whereas CPD 2561 is observed at higher inclination closer to the stellar equator where plasma emission is optically thick according to the MWC model by Babel & Montmerle (1997). Alternatively, the inclination angle of HD 148937 could be large while the obliquity between the magnetic field axis and the rotation angle is small. Furthermore, differences in the appearance of the line profiles are detected in the spectra recorded in different years, indicating that profiles are not strictly repeatable due to either uncertainties in the rotation period or due to intrinsic variability caused by changes in the amount or distribution of emitting material with time in the magnetosphere of CPD 2561. Additional spectra and spectropolarimetric observations over the whole rotation cycle are needed to better constrain the magnetic field model of this star.
Our X-ray observations obtained with the Suzaku X-ray Observatory agree well with the supposition of the presence of the magnetically confined stellar wind as we find evidence for a hard component with keV. This component is much harder than typical for a single non-magnetic OB stars. Unfortunately, as our observations had the total duration of about 7.5 h, no conclusion can be drawn from these data about the rotation modulation of the X-ray flux. One important task for future X-ray studies is to obtain detailed information on the variability of X-rays and to search for the periodicity usually expected in massive stars with the X-ray emitting confined winds.
Acknowledgments
We thank the referee John Landstreet for useful comments to the original manuscript. Based on observations collected with the Suzaku X-ray Observatory, data obtained with ESO telescopes at the La Silla Paranal Observatory under programme ID 092.D-0209(A), and data obtained from the ESO Science Archive Facility under request number MSCHOELLER51303. A.F.K thanks for support by the Saint-Petersburg University project 6.38.18.2014.
References
- Altschuler & Newkirk (1969) Altschuler M.D., Newkirk, G., 1969, Sol. Phys., 9, 131
- Arnaud (1996) Arnaud K.A., 1996, in Jacoby, G.H., Barnes, J., eds, ASP Conf. Ser. Vol. 101, Astronomical Data Analysis Software and Systems V. Astron. Soc. Pac., San Francisco, p. 17
- Babel & Montmerle (1997) Babel J., Montmerle Th., 1997, ApJ, 485, 29
- Berghoefer et al. (1997) Berghoefer T.W., Schmitt J.H.M.M., Danner R., Cassinelli J.P., 1997, A&A, 322, 167
- Chlebowski (1989) Chlebowski T., 1989, ApJ, 342, 1091
- Donati et al. (2006) Donati J.-F., Howarth I.D., Bouret J.-C., Petit P., Catala C., Landstreet J., 2006, MNRAS, 365, L6
- Flesch & Hardcastle (2004) Flesch E., Hardcastle M.J.,2004, A&A, 427, 387
- Gräfener et al. (2002) Gräfener G., Koesterke L., Hamann W.-R., 2002, A&A, 387, 244
- Gudennavar et al. (2012) Gudennavar S.B., Bubbly S.G., Preethi K., Murthy, J., 2012, ApJS, 199, 8
- Hamann & Gräfener (2004) Hamann W.-R., Gräfener G., 2004, A&A, 427, 697
- Howarth et al. (2007) Howarth I.D. et al., 2007, MNRAS, 381, 433
- Hubrig et al. (2004a) Hubrig S., Kurtz D.W., Bagnulo S., Szeifert T., Schöller M., Mathys G., Dziembowski W.A., 2004a, A&A, 415, 661
- Hubrig et al. (2004b) Hubrig S., Szeifert T., Schöller M., Mathys G., Kurtz D.W., 2004b, A&A, 415, 685
- Hubrig et al. (2006) Hubrig S., Briquet M., Schöller M., De Cat P., Mathys G., Aerts C., 2006, MNRAS, 369, L61
- Hubrig et al. (2008) Hubrig S., Schöller M., Schnerr R.S., González J.F., Ignace R., Henrichs H.F., 2008, A&A, 490, 793
- Hubrig et al. (2009) Hubrig S., Briquet M., De Cat P., Schöller M., Morel T., Ilyin I., 2009, AN, 330, 317
- Hubrig et al. (2011a) Hubrig S. et al., 2011a, A&A, 528, A151
- Hubrig et al. (2011b) Hubrig S., Oskinova L.M., Schöller M., 2011b, AN, 332, 147
- Hubrig et al. (2011c) Hubrig S. et al., 2011c, A&A, 525, L4
- Hubrig et al. (2013) Hubrig S. et al., 2013, A&A, 551, A33
- Hubrig et al. (2014) Hubrig S., Schöller M., Kholtygin A.F., 2014, MNRAS, 440, 1779
- Ignace et al. (2010) Ignace R., Oskinova L.M., Jardine M., Cassinelli J.P., Cohen D.H., Donati J.-F., Townsend R.H.D., ud-Doula A., 2010, ApJ, 721, 1412
- Ignace et al. (2013) Ignace, R., Oskinova, L.M., Massa, D., 2013, MNRAS, 429, 516
- Levato et al. (1988) Levato H., Morrell N., Garcia B., Malaroda S., 1988, ApJS, 68, 319
- Liedahl et al. (1995) Liedahl D.A., Osterheld A.L., Goldstein W.H. 1995, ApJL, 438, 115
- Martins et al. (2010) Martins F., Donati J.-F., Marcolino W.L.F., Bouret J.-C., Wade G.A., Escolano C., Howarth I.D., Mimes Collaboration, 2010, MNRAS, 407, 1423
- Mewe et al. (2003) Mewe R., Raassen A.J.J., Cassinelli J.P., van der Hucht K.A., Miller N.A., Güdel M., 2003, A&A, 398, 203
- Mitsuda et al. (2007) Mitsuda K. et al., 2007, PASJ, 59, 1
- Nazé et al. (2008) Nazé Y., Walborn N.R., Rauw G., Martins F., Pollock A.M.T., Bond H.E., 2008, AJ, 135, 1946
- Nazé et al. (2010) Nazé Y., Ud-Doula A., Spano M., Rauw G., De Becker M., Walborn N.R., 2010, A&A, 520, A59
- Nazé (2014) Nazé Y., 2014, HST Proposal, 13629 (see also http://www.stsci.edu/hst/phase2-public/13629.pro)
- Nazé et al. (2014) Nazé Y., Petit V., Rinbrand M., Cohen D., Owocki S., ud-Doula A., Wade G., 2014, arXiv:1409.1690
- Oskinova (2005) Oskinova L.M., 2005, MNRAS, 361, 679
- Oskinova et al. (2011) Oskinova L.M., Todt H., Ignace R., Brown J.C., Cassinelli J.P., Hamann W.-R., 2011, MNRAS, 416, 1456
- Oskinova et al. (2014) Oskinova L.M., Nazé Y., Todt H., Huenemoerder D.P., Ignace R., Hubrig S., Hamann W.-R., 2014, NatCo, 5, 4024
- Patriarchi et al. (2003) Patriarchi P., Morbidelli L., Perinotto M., 2003, A&A, 410, 905
- Petit et al. (2013) Petit V. et al., 2013, MNRAS, 429, 398
- Puls et al. (1996) Puls J. et al., 1996, A&A, 305, 171
- Schulz et al. (2000) Schulz N.S., Canizares C.R., Huenemoerder D., Lee J.C., 2000, ApJ, 545, 135
- Snik et al. (2008) Snik F., Jeffers S., Keller C., Piskunov N., Kochukhov O., Valenti J., Johns-Krull C., 2008, Proc. SPIE Conf. Ser. Vol. 7014, Ground-based and Airborne Instrumentation for Astronomy II. McLean I.S., Casali M.M., editors. Bellingham: SPIE; 2008. p. E22
- Sundqvist et al. (2012) Sundqvist J., ud-Doula A., Owocki S.P., Townsend R.H.D., Howarth I.D., Wade G.A., 2012, MNRAS, 423, 21
- ud-Doula & Owocki (2002) ud-Doula A., Owocki S.P., 2002, ApJ, 576, 413
- ud-Doula et al. (2013) ud-Doula A., Sundqvist J.O., Owocki S.P., Petit V., Townsend R.H.D., 2013, MNRAS, 428, 2723
- Vink et al. (2001) Vink J. S., de Koter A., Lamers H. J. G. L. M, 2001, A&A, 369, 574
- Wade et al. (2012a) Wade G.A. et al., 2012a, MNRAS, 425, 1278
- Wade et al. (2012b) Wade G.A., Grunhut J.H., MiMeS Collaboration, 2012b, in Carciofi, A.C., Rivinius, T., eds, ASP Conf. Ser. Vol. 464, Circumstellar Dynamics at High Resolution. Astron. Soc. Pac., San Francisco, p. 405
- Walborn (1973) Walborn N.R., 1973, AJ, 78, 1067
- Walborn et al. (2010) Walborn N.R., Sota A., Maíz Apellániz J., Alfaro E.J., Morrell N.I., Barbá R.H., Arias J.I., Gamen R.C., 2010, ApJ, 711, L143
- Waldron & Cassinelli (2007) Waldron W.L., Cassinelli J.P., 2007, ApJ, 668, 456
- Weber & Davis (1967) Weber E. J., Davis Jr., L., 1967, ApJ, 148, 217