Cosmic evolution of dust in galaxies: Methods and preliminary results
Abstract
We investigate the redshift () evolution of dust mass and abundance, their dependences on initial conditions of galaxy formation, and physical correlations between dust, gas, and stellar contents at different based on our original chemodynamical simulations of galaxy formation with dust growth and destruction. In this preliminary investigation, we first determine the reasonable ranges of the most important two parameters for dust evolution, i.e., the timescales of dust growth and destruction, by comparing the observed and simulated dust mass and abundances and molecular hydrogen () content of the Galaxy. We then investigate the -evolution of dust-to-gas-ratios () and, gas fraction (), and gas-phase chemical abundances (e.g., ) in the simulated disk and dwarf galaxies. The principal results are as follows. Both and can rapidly increase during the early dissipative formation of galactic disks () and the -evolution of these depends on initial mass densities, spin parameters, and masses of galaxies. The observed relation can be qualitatively reproduced, but the simulated dispersion of at a given is smaller. The simulated galaxies with larger total dust masses show larger and stellar masses and higher . Disk galaxies show negative radial gradients of and the gradients are steeper for more massive galaxies. The observed evolution of dust masses and dust-to-stellar-mass-ratios between and can not be reproduced so well by the simulated disks. Very extended dusty gaseous halos can be formed during hierarchical build-up of disk galaxies. Dust-to-metal ratios (i.e., dust-depletion levels) are different within a single galaxy and between different galaxies at different .
1 Introduction
Interstellar dust plays a number of key roles in galaxy formation and evolution. For example, molecular hydrogen () can form on the surface of dust grains (e.g., Gould & Salpeter 1963; Hollenbach & Salpeter 1971) so that the time evolution of content and the star formation processes in giant molecular clouds can be influenced by dust abundances in galaxies. Dust grains are fundamentally important for the fragmentation processes of metal-poor gas clouds and thus for the formation of low-mass stars in the early universe (e.g., Larson 2005; Schneider & Omukai 2010). Spectral energy distributions (SEDs) of galaxies are strongly influenced by dust abundances, compositions, and size-distributions within galaxies (e.g., Popescu et al. 2000; Takeuchi et al. 2005). Therefore, the time evolution of photometric and spectroscopic properties, star formation rates, and cold gas contents in galaxies can be strongly coupled with the cosmic evolution of interstellar dust. Theoretical studies have not yet investigated how interstellar dust can possibly influence galaxy formation and evolution processes in detail.
A growing number of observational studies by space infrared telescopes (e.g., Spitzer, Herschel, and AKARI) have revealed dust properties for a large number of galaxies with different masses and types in different environments and their correlations with galaxy properties such as total stellar masses (e.g. Draine et al. 2007; Dunne et al. 2011, D11; Kaneda et al. 2011; Cortese et al. 2012; Smith et al. 2012; Davies et al. 2014). Furthermore, these observations have also revealed the spatially resolved dust properties in nearby galaxies and accordingly provided new constraints on dust evolution models in galaxies (e.g., Meixner et al. 2010; Pappalardo et al. 2012; P12). In spite of these significant progresses in observational studies, theoretical studies have not yet explained many of these latest new observational results.
Physical properties of dust have been recently observed to be different between galaxies at different . For example, one of the most distant quasars, SDSS J1148+5251 at , has been observed to have a large amount of gas and dust (e.g., Bertoldi et al. 2003; Beelen et al. 2006). Recent ALMA observations of a very high redshift star-forming galaxy at (’Himiko’), on the other hand, revealed that this galaxy has a very low dust content consistent with primordial interstellar gas (Ouchi et al. 2013). Kashino et al. (2013) have investigated the level of dust extinction in distant galaxies at by using the results of a near-IR spectroscopic survey of the COSMOS field and found that the extinction level is elevated at high mass galaxies compared to low- counterparts. These observed differences of dust properties in galaxies at different and the -evolution of galactic dust properties are yet to be explained by theoretical models of galaxy formation.
The time evolution of dust and physical correlations between dust properties and other galaxy properties (e.g., gas-phase abundances) have long been investigated mainly by one-zone or multi-zone chemical evolution models (e.g., Dwek & Scalo 1979, 1980; Dwek 1998, D98; Lisenfeld & Ferrara 1998; Hirashita 1999; Edmunds 2001; Inoue 2003; Calura et al. 2008; Asano et al. 2013; Zhukovska & Henning 2013). Owing to the lack of spatial resolution in these models, 2D distributions of dust properties in galaxies were not investigated in the models, though they already discussed a few dust scaling relation (e.g., correlation). The -evolution of dust properties in galaxies was not investigated in these previous one-zone models that are not based on a cosmological model. Chemodynamical simulations with dust evolution could be ideal theoretical tools for discussing the spatially resolved dust properties of galaxies and redshift evolution of dust revealed in recent observations described above.
Bekki (2013a, B13a) first incorporated both dust growth and destruction and formation on dust grains in the chemodynamical simulations with star formation from gas and thereby investigated the time evolution of dust and properties of galaxies in a self-consistent manner. However, the initial conditions of galaxy formation in B13a are highly idealized for its preliminary investigation of dust evolution and are not those adopted in numerical simulations of galaxy formation based on a CDM cosmology. Therefore, neither the -evolution of dust properties nor the roles of hierarchical growth of galaxies in dust evolution were investigated in B13a. Given a growing number of observational studies on dust properties of galaxies at different , it is timely for theoretical studies of galaxy formation to investigate the evolution of dust in the context of hierarchical galaxy formation.
The purpose of this paper is to investigate the -evolution of dust and properties of galaxies and correlations between dust and galaxy properties (e.g., total stellar masses) at by using numerical simulations of galaxy formation based on CDM cosmology. We particularly investigate (i) whether the observed relation can be reproduced by the present simulations, (ii) how the -evolution of and (dust-to-metal-ratio) depends on initial masses and spin parameters of galaxies, and (iii) how and are spatially different within a galaxy, (iv) whether the observed dust scaling relation can be reproduced, and (v) how dust evolution is different between luminous disk galaxies and dwarfs. The present study also predicts physical correlations between dust, , and stellar properties of galaxies in order to compare the predictions with the corresponding observations (e.g., Norman & Spaans 1997; Leroy et al. 2011; Saintonge et al. 2011; Cortese et al. 2012; Bourne et al. 2013). In this investigation, we use a slightly revised version of our previous simulation code used in B13a.
The plan of the paper is as follows: In the next section, we describe initial conditions of galaxy formation and chemodynamical model with the formation and evolution of dust and . In §3, we present the numerical results on the -evolution of dust and properties in simulated galaxies. In this section, we also discuss correlations between dust properties (e.g., ) and global galaxy parameters (e.g., total stellar masses) and their -evolution. In §4, we discuss the latest observational results on dust and properties of galaxies derived mainly from the and telescopes and also point out necessary improvement in the predictive power of numerical simulations with dust growth and destruction. We summarize our conclusions in §5. Physical meanings for symbols (e.g., ) often used in the present study are given in Table 1 for convenience.
2 The model
We mainly investigate the evolution of total dust and masses ( and , respectively), , mass fraction of PAH dust () from to by using chemodynamical simulations of galaxy formation based on a CDM cosmology with the latest WMAP cosmological parameters. Since the details of the simulation code adopted in the present study and the results of various tests of the code have been already given in B13a, we here briefly describe the simulation code. This study presents the first application of the new simulation code to galaxy formation in a cosmological context. Accordingly it is still a preliminary one in which (i) a reasonable range of dust parameters needs to be determined in the context of CDM-based galaxy formation and (ii) a large-scale structure and formation processes of individual galaxies are not self-consistently included (i.e., not ’zoom-in’ simulations).
Although a growing number of observational papers on dust properties of local and distant galaxies have been published, many observational studies are currently underway. Therefore, only a brief comparison between observations and simulations can be done in the present study. Ongoing data analysis from Herschel and ALMA will produce a large amount of key observational data that can be compared with numerical simulations of galaxy formation with dust and models. It is thus our future work to compare extensively between more sophisticated simulations and these observations.
We use a slightly revised version of our previous simulation code (B13a) in which hydrodynamics of interstellar gas is modeled by the SPH method. The previous simulations in B13a include the formation of dust in the stellar winds of supernovae (SNe) and asymptotic giant branch (AGB) stars, the growth and destruction processes of dust in the interstellar medium (ISM), the formation of polycyclic aromatic hydrocarbon (PAH) dust in carbon-rich AGB stars, the formation on dust grains, and the photo-dissociation due to far ultra-violet (FUV) light in a self-consistent manner. The revised version newly includes (i) dust growth timescales dependent on dust properties (Yozin & Bekki 2014) and (ii) time-varying IMF models (Bekki & Meurer 2013; Bekki 2013b,c, B13b, B13c). These new elements of the code are described later. The code can be currently run on Graphics Processing Unit (GPU) clusters in which gravitational calculations are done on GPUs whereas other calculations such as star formation and chemical evolution are done on CPUs.
The present improved code, however, does not allow us to investigate the following physical properties of dust. First, the time evolution of dust size distribution and detailed dust compositions can not be investigated. This is because initial distributions of dust sizes and dust shattering and coagulation processes, which are key for the evolution of dust grain sizes, are not included. Second, the dynamical evolution of dust can not be separately investigated from that of gas-phase metals (i.e., metals that are not locked up onto dust grains), because dust-gas hydrodynamical interaction (e.g. Theis & Orlova 2004) and radiation pressure on dust grains (e.g., Ferrara et al. 1991) are not included. Third, the sub-pc scale physical processes of dust destruction by SNe and grain-grain collisions (e.g., Shull 1978; McKee et al. 1989; Jones et al. 1994; Silvia et al. 2010) can not be investigated by the present galaxy-scale simulations because of the expected spatial resolution (at most 10pc). These three will be included in our future more sophisticated simulations.
As shown later in this paper, the simulated disk galaxies can have extended dusty gaseous halos. Therefore, the total mass of dust in a simulated galaxy depends on the radius within which the masses of gas particles are summed up. A significant fraction of dust in a galaxy can be located in the outer halo. Therefore, we separately estimate the total dust dust mass for disk and halo components of a galaxy. In the present study, , , and are referred to as the total masses of a galaxy, that of the disk (, where is the half-mass radius of stars), and that of the halo, respectively.
2.1 Gravitational dynamics and hydrodynamics
One of key ingredients of the code is that the gravitational softening length () is chosen for each component in a galaxy (i.e., multiple gravitational softening lengths). Thus the gravitational softening length () is different between dark matter () and gas () and is determined by the initial mean separation of dark matter particles. Initial is set to be significantly smaller than owing to rather high-density (thus high-number-density) gaseous regions formed during dissipative collapse and merging of galaxy formation, as is described later. The softening length for new stars formed from gas is set to be the same as . Furthermore, when two different components interact gravitationally, the mean softening length for the two components is applied for the gravitational calculation. For example, is used for gravitational interaction between
We consider that the ISM in galaxies can be modeled as an ideal gas with the ratio of specific heats () being 5/3. The basic methods to implement SPH in the present study are essentially the same as those proposed by Hernquist & Katz (1989). We adopt the predictor-corrector algorithm (that is accurate to second order in time and space) in order to integrate the equations describing the time evolution of a system. Each particle is allocated an individual time step width () that is determined by physical properties of the particle. The maximum time step width () is in simulation units, which means that yr in the present study. Although a gas particle is allowed to have a minimum time step width of in the adopted individual time step scheme, no particle actually has such a short time step width owing to conversion from gas to star in high-density gas regions. The radiative cooling processes are properly included by using the cooling curve by Rosen & Bregman (1995) for K (where is gas temperature) and the MAPPING III code for K (Sutherland & Dopita 1993).
In the present study, thermal feedback effects of SN explosions can heat up ISM to form hot gas whereas radiative cooling described above can contribute to the formation of rather cold gas (K). Therefore, the influences of the multi-phase nature of ISM on dust evolution can be investigated, though the details of ISM evolution driven by gas cooling and heating, SNe, and formation on dust grains are not discussed in the present paper. Also, dust evolution can be influenced by stellar winds of massive stars and proto-stellar objects. These potentially important processes for dust evolution need to be investigated in our future papers, because the present simulations do not have enough resolution to investigate this subpc-scale dynamics. The cosmic microwave background (CMB) radiation field can also influence the evolution of cold gas and thus that of interstellar dust in galaxies at higher redshifts. This CMB effects on ISM with dust are not considered in the present study, and therefore it is also a key issue that should be investigated in our forthcoming papers.
2.2 Chemical enrichment
Since the present model for chemical enrichment processes of galaxies is exactly the same as that used in B13a, we briefly describe the model here. Chemical enrichment through star formation and metal ejection from SNIa, II, and AGB stars is self-consistently included in the chemodynamical simulations. We investigate the time evolution of the 11 chemical elements of H, He, C, N, O, Fe, Mg, Ca, Si, S, and Ba in order to predict both chemical abundances and dust properties in the present study. The mean metallicity for each th stellar particle is represented by . The total mass of each th () chemical component ejected from each th stellar particles at time is given as
| (1) |
where is the mass of the th stellar particle, is the mass of each th chemical component ejected from stars per unit mass at time , and represents the time when the th stellar particle is born from a gas particle. is given equally to neighbor SPH gas particles (with the total number of ) located around the th stellar particle. Therefore, the mass increase of each th chemical component for th gas particle at time () is given as
| (2) |
where is the total number of neighbor stellar particles whose metals can be incorporated into the th gas particle. We consider the time delay between the epoch of star formation and those of supernova explosions and commencement of AGB phases (i.e., non-instantaneous recycling of chemical elements).
We adopt the ‘prompt SN Ia’ model in which the delay time distribution (DTD) of SNe Ia is consistent with recent observational results by extensive SN Ia surveys (e.g., Mannucci et al. 2006). In this prompt SN Ia mode, there is a time delay () between the star formation and the metal ejection for SNe Ia. We here adopt the following DTD ()) for 0.1 Gyr 10 Gyr, which is consistent with recent observational studies on the SN Ia rate in extra-galaxies (e.g., Maoz et al., 2011):
| (3) |
where is a normalization constant that is determined by the number of SN Ia per unit mass (which is controlled by the IMF and the binary fraction for intermediate-mass stars for the adopted power-law slope of ). This adoption is pointed out to be necessary to explain the observed chemical properties of the LMC (Bekki & Tsujimoto 2012) The fraction of the stars that eventually produce SNe Ia for 3–8 has not been observationally determined. In the present study, is assumed. We adopt the nucleosynthesis yields of SNe II and Ia from Tsujimoto et al. (1995; T95) and AGB stars from van den Hoek & Groenewegen (1997; VG97) in order to estimate in the present study.
2.3 Dust model
The present models for dust yields, growth, and destruction are the same as those adopted in B13a, which reproduced reasonably well the observed dust properties of galaxies in a self-consistent manner. In B13a and the present work, the evolution of dust size distribution is not considered at all, though it can influence the thermal evolution of ISM and formation efficiency on dust grains. The total mass of th component (=C, O, Mg, Si, S, Ca, and Fe) of dust from th type of stars ( = I, II, and AGB for SNe Ia, SNe II, and AGB stars, respectively) is described as follows;
| (4) |
where is the condensation efficiency (i.e., the mass fraction of metals that are locked up in dust grains) for each th chemical component from th stellar type, is the function that determines the total mass of metals that can be used for dust formation, and is the mass of th component ejected from th stellar type. The total mass of stellar ejecta is estimated by using stellar yield tables by T95 and VG97. Dust yields are exactly the same as those in B13a. The details of and are given in B13a. The inclusion of SN dust in the present model is quite reasonable, firstly because recent observations of SN 1987a by Herschel have revealed a large amount of dust ([0.40.7]) in the SN (Matsuura et al. 2011), and secondly because the observed amount appears to be consistent with the theoretical prediction by Nozawa et al. (2003).
Dust grains can grow by accretion of metals of ISM onto preexisting cores and this accretion process is included in previous models (D98). Following D98, we consider that the key parameter in dust accretion is the dust accretion timescale (). In the present study, this parameter can vary between different gas particles and is thus represented by for th gas particle. The mass of th component (=C, O, Mg, Si, S, Ca, and Fe) of dust for th gas particle at time () can increase owing to dust accretion processes. The mass increase is described as
| (5) |
where is the individual time step width for the th gas particle and is the fraction of the th chemical element that is locked up in the dust. Owing to this dust growth, the mass of th chemical component that is not locked up in the dust () can decrease, which is simply given as
| (6) |
As is clear in these equations, the total mass of th component in th gas particle () is .
Dust grains can be destroyed though supernova blast waves in the ISM of galaxies (e.g., McKee 1989) and the destruction process is parameterized by the destruction time scale () in previous one-zone models (e.g., Lisenfeld & Ferrara 1998; Hirashita 1999). Following the previous models, the decrease of the mass of th component of dust for th gas particle at time due to dust destruction process is as follows
| (7) |
where is the dust destruction timescale for th particle. The dust destroyed by supernova explosions can be returned back to the ISM, and therefore the mass of th chemical component that is not locked up in the dust increases as follows:
| (8) |
Thus the equation for the time evolution of th component of metals for th gas particle are given as
| (9) |
Likewise, the equation for dust evolution is given as
| (10) |
Dust is locked up in stars as metals are done so, when gas particles are converted into new stars. This means that star formation process itself has an effect of destroying dust in the present study.
A growing number of observational studies on PAH properties have been accumulated for galaxies within and beyond the Local Group (e.g, Draine et al. 2007; Meixner et al. 2010). It is accordingly timely for the present study to discuss the origin of the observed PAH properties in galaxies by using the new chemodynamical model. The most promising formation site of interstellar PAH dust is C-rich AGB stars, though direct observation supporting PAH formation in stellar winds of AGB stars is very weak (e.g., Tielens 2008 for a recent review). We consider that some fraction of carbon dust produced by C-rich AGB stars () can finally become PAH dust and thereby investigate the PAH properties in the present study. The mass fraction of PAH dust to total carbon dust in the ejecta of C-rich AGB stars is a parameter denoted as . Using low-resolution simulations with different , we find that can better explain observations. We therefore show the results of the models with in the present study. As shown in B13a, the time evolution of PAH is not different between low- and high-resolution simulations for .
We adopt an assumption that the dust accretion and dust destruction timescales are the same between PAH and other dust. Therefore, the parameter values of and are exactly the same between PAH and other dust. We adopt this assumption, mainly because it is observationally and theoretically unclear how different the dust growth and destruction processes are between PAH and other dust. It is likely, however, that PAH can be destroyed (probably more efficiently) by gas shocks and SNe than other dust owing to their much lower masses. This difference in dust destruction processes between different dust gains should be included in our future more sophisticated models. We accordingly admit that the PAH model is over-simplified to some extent, but we consider that the PAH evolution does not influence the time evolution of and that are the main focus of this paper (because is much smaller than ). In the present paper, we do not want to introduce additional few parameters to model the PAH evolution and more sophisticated PAH models should be discussed in our future papers. The evolution of PAH dust with time and metallicity in galaxies was already investigated in detail by Galliano et al. (2008). Also, Micelotta et al. (2010a, b) investigated the effects of hot gas and gaseous shock waves on the evolution of PAH and estimated the lifetime and destruction process of PAH dust.
We investigate the time evolution of the mass-ratio of PAH dust to total dust for each -th gas particle at each time step, and the mass-ratio () is defined as follows:
| (11) |
where is the sum of all dust elements and is the total mass of PAH dust for the gas particle. The present dust model is not so realistic as the one proposed recently by Jones et al. (2013) which considered the evolution of hydrocarbon materials influenced by ultraviolet photon. We do not consider such a detailed dust model in the present study, because the simulation code does not allow us to investigate the evolution of dust compositions due to photon absorption-induced processing. We will consider the new model by Jones et al. (2013) in our future works.
2.4 Different dust depletion levels in different elements
Gas-phase chemical abundances relative to solar in the Galactic ISM are observed to be quite different between different elements (e.g., Savage et al. 1992). For example, Fe, Ca, and Ti are severely dust-depleted (i.e., almost all Fe, Ca, and Ti are locked up in dust) whereas N and S do not show such dust depletion. Therefore, chemical abundance ratios, such as [S/Fe] and [S/Ca], can be used to measure the dust depletion level of an individual gaseous region in a galaxy. Different dust depletion levels between different elements reflect the fact that the required physical conditions for metals to be locked up in dust are different between the different elements. Although the present study does not develop a detailed model for this different dust depletion level, it adopts a simple model in which only the element S is free from dust depletion. Accordingly, the radial gradient of [S/H] in a galaxy can be regarded as a metallicity gradient that is not influenced by dust depletion (thus it can correspond to the gradient of ionized gaseous regions). Furthermore, we can measure the dust depletion level of a galaxy by investigating the mean [S/Fe] in the present study, because the element Fe is dust-depleted.
We investigate the time evolution of the dust-to-metal-ratios () for each -th gas particle at each time step, and it is defined as follows:
| (12) |
where is the sum of all metal elements (i.e., metals in gas and those locked up in dust). The mean dust-to-metal-ratio of a galaxy is the mean of these for all gas particle of the galaxy. It is observationally difficult to estimate these . Therefore, we show both [S/Fe] and in the present study. The initial dust-to-metal ratio is fixed at 0.1 (at ) for all gaseous particles in all models and the present results do not depend strongly on this initial ratio. The initial dust and metal are assumed to originate from Pop III SNe (e.g., Nozawa et al. 2003).
2.5 Constant vs variable dust accretion models
Dust growth timescale in ISM of galaxies is a fundamentally important not only in investigating the time evolution of mean in galaxies (e.g., D98) but also in discussing the physical properties of gas (B13a). We investigate the following two models for estimating the dust growth timescale. One is the constant dust accretion model (‘CDA’) in which is constant for all particles at all time steps and the other is the variable dust accretion model (’VDA’) in which is different between different particles with different gaseous properties and changes with time according to the changes of gaseous properties. Previous one-zone models (e.g., D98) and our previous numerical simulations (B13a) adopted CDA and thereby discussed the observed key observational results of dust properties in galaxies. Clearly, VDA is more realist than CDA in investigating dust and properties of galaxies.
However, we need to introduce a few additional parameters in VDA in order to describe the possible dependences of of gas particles on the gas densities, temperature, and chemical abundances. Given that the additional parameters for are not well constrained, VDA could be practically less useful in pinpointing the key physics for the time evolution of dust properties. Furthermore, our previous simulations with CDA clearly show the importance of dust accretion and destruction in the evolution of and . We therefore consider that it is the best for the present study to investigate the -evolution of dust and properties of galaxies by using both CDA and VDA.
For CDA, of each gas particle is fixed at a certain value for all time steps and described as follows:
| (13) |
where ranges from 0.01 Gyr to 0.5 Gyr in the present study. For CDA, of each gas particle is also fixed at a certain value and assumed to be proportional to as follows:
| (14) |
where is a free parameter and for Gyr is the best value for reproducing dust and properties of galaxies in B13a. We can find a reasonable range of by comparing the observed dust and properties with the simulated ones for different .
We adopt the following dependence of on the mass density and temperature of a gas particle:
| (15) |
where and are the gas density and temperature of a -th gas particle, respectively, (typical ISM density at the solar neighborhood) and (temperature of cold gas) are set to be 1 atom cm-3 and 20K, respectively, and is a reference dust accretion timescale at and . The adopted yr for the dust timescale of typical ISM is consistent with those used for typical ISM in previous studies (e.g., yr in D98). The present simulations can not resolve the atomic-scale physics of dust growth (much smaller than the possible resolution of the present simulations), and the above for a gas particle should be regarded as the dust growth timescale averaged over the smoothing length of the particle ( pc). Furthermore, the functional form of in the above equation can be derived from the first principle (See equations 30, 31, and 34 in D98 and 19 and 20 in Hirashita 2012).
This can control the dust accretion timescale of the -th gas particle and is set to be yr in the present study. The adopted function form of is consistent with the analytical formula estimated by D98 (see equations 30, 31 and 34 in D98). Since the size and mass distributions of dust grains can determine , adopting a fixed value of would be less realistic. We cannot help but to adopt a fixed value, simply because the present simulations do not allow us to investigate the size and mass distributions of dust grains in galaxies. We have investigated how the present results depend on by running some models with longer . It is confirmed that if is as large as yr, then the observed dust properties can not be well reproduced by the present models. We therefore show the results of the models with yr.
Previous numerical simulations revealed physical conditions for dust destruction by SNF and the dust destruction efficiencies dependent on physical properties of ISM (e.g., Jones et al. 1994; Nozawa et al. 2003). Although could be described as a function of gas properties by using the results of these simulations, we adopt the same model in CDA for the dust destruction timescale in VDA. This is mainly because an analytical formula for the dust destruction efficiencies and timescales dependent on ISM properties has not been clearly described yet. The dust destruction timescale of a gas particle depends both on and , which means that the timescale can be determined locally for each gas particle. The value is fixed at 2 for most models with VDA (unless specified) in the present study. In our future work, we will try to develop a better and more sophisticated model for dust destruction by including the results of the above previous numerical simulations properly in our chemodynamical simulations.
The SPH smoothing length () of a particle, which can define the resolution of a local gaseous region, is changed according to the gas density of the particle (i.e., time-dependent, dynamic resolution). Therefore, the value can be rather small in some high-density region of a model (in particular, where star formation is suppressed). The density of a SPH gas particle can be therefore as high as cm-3, which is already discussed in B13a. Furthermore, the formation site is almost always in high-density (and dust-rich) regions, which means that dust growth is the most rapid in the forming regions according to the adopted density-(temperature-)dependent dust accretion timescale.
Also, it should be stressed that the destruction of gas by supernova (or high-intensity UV radiation field) is included already in this paper. For example, the abundance is lower in the model with strong SN feedback, because SN feedback effects can disperse ISM and lower the gas density so that formation can be suppressed. In such a low-density region, dust-growth is suppressed in the present simulation (owing to the adopted density-dependent dust accretion timescale).
2.6 formation and dissociation
The model for formation and dissociation in the present study is exactly the same as those used in B13a: formation on dust grains and dissociation by FUV radiation are both self-consistently included in chemodynamical simulations. The temperature (), hydrogen density (), dust-to-gas ratio () of a gas particle and the strength of the FUV radiation field () around the gas particle are calculated at each time step so that the fraction of molecular hydrogen () for the gas particle can be derived based on the formation/destruction equilibrium conditions. Thus the fraction for -th gas particle () is given as;
| (16) |
where means a function for determination.
Since the detail of the derivation methods of and (thus ) are given in B13a and B13b, we here briefly describe the methods. The SEDs of stellar particles around each -th gas particles (thus ISRF) are first estimated from ages and metallicities of the stars by using stellar population synthesis codes for a given IMF (e.g., Bruzual & Charlot 2003). Then the strength of the FUV-part of the ISRF is estimated from the SEDs so that can be derived for the -th gas particle. Based on , , and of the gas particle, we can derive (See Figure 1 in B13a). Thus each gas particle has , metallicity ([Fe/H]), and gas density, all of which are used for estimating the IMF slopes for the particle (when it is converted into a new star).
Since the formation and evolution processes of dust and are strongly coupled in the present study, the model parameters of dust need to be carefully chosen so that both the observed and dust properties can be well reproduced by the models. The present model can explain the observed positive correlation between hydrostatic gas pressure () and the ratio of to H i (), which can be denoted as (e.g., Blitz et al. 2007). Furthermore, the dust-regulated formation model can explain the observed correlations between local surface densities of dust and in galaxies. The origin of these properties will be discussed in detail by our forthcoming papers in which the same dust-regulated formation model is adopted (e.g., Bekki 2014).
2.7 Star formation and SN feedback effects
Since SF can proceed in molecular clouds, we adopt the following ‘-dependent’ SF recipe (B13a) using molecular gas fraction () defined for each gas particle in the present study. A gas particle can be converted into a new star if (i) the local dynamical time scale is shorter than the sound crossing time scale (mimicking the Jeans instability) , (ii) the local velocity field is identified as being consistent with gravitationally collapsing (i.e., div v), and (iii) the local density exceeds a threshold density for star formation (). We mainly investigate the models with cm-3 in the present study.
A gas particle can be regarded as a ‘SF candidate’ gas particle if the above three SF conditions (i)-(iii) are satisfied. It could be possible to convert some fraction () of a SF candidate gas particle into a new star at each time step until the mass of the gas particle becomes very small. However, this SF conversion method can increase dramatically the total number of stellar particles, which becomes numerically very costly. We therefore adopt the following SF conversion method. A SF candidate -th gas particle is regarded as having a SF probability ();
| (17) |
where corresponds to a star formation efficiency (SFE) in molecular cores and is set to be 1, is the time step width for the gas particle, is the gas density of the particle, and is the power-law slope of the Kennicutt-Schmidt law (SFR; Kennicutt 1998). A reasonable value of is adopted in the present study. This SF probability has been already introduced in our early chemodynamical simulations of galaxies (e.g., Bekki & Shioya 1998).
At each time step random numbers (; ) are generated and compared with . If , then the gas particle can be converted into a new stellar one. In this SF recipe, a gas particle with a higher gas density and thus a shorter SF timescale () can be more rapidly converted into a new star owing to the larger . Equally, a gas particle with a higher can be more rapidly converted into a new star. We thus consider that the present SF model is a good approximation for star formation in molecular gas of disk galaxies.
Each SN is assumed to eject the feedback energy () of erg and 90% and 10% of are used for the increase of thermal energy (‘thermal feedback’) and random motion (‘kinematic feedback’), respectively. The thermal energy is used for the ‘adiabatic expansion phase’, where each SN can remain adiabatic for a timescale of . Although yr is reasonable for a single SN explosion, previous galaxy-scale simulations adopted a much longer timescale of yr (e.g., Mori et al. 1999; Stinson et al. 2006), Multiple SN explosions can occur for a gas particle with a mass of in these galaxy-scale simulations, and can be different for multiple SN explosions in a small local region owing to complicated interaction between gaseous ejecta from different SNe. Such interaction of multiple SN explosions would make the adiabatic phase significantly longer in real ISM of galaxies.
Considering these, we adopt the following three different for modeling SN feedback(SNF): yr (referred to as ’weak SNF’), yr (’moderate SNF’), and yr (’strong SNF’). We compare the results of these three model with one another to demonstrate the importance of SNF in the -evolution of dust properties in galaxies. The energy-ratio of thermal to kinematic feedback is consistent with previous numerical simulations by Thornton et al. (1998) who investigated the energy conversion processes of SNe in detail. The way to distribute of SNe among neighbor gas particles is the same as described in B13a.
2.8 Fixed and time-varying IMFs
We investigate the dust evolution of galaxies with the fixed Kroupa IMF (e.g., Kroupa 2001) for most models in the present study. However, as shown in B13b, the time evolution of dust can be quite different between fixed and time-varying IMFs. Therefore, we adopt the time-varying IMF dependent on local gaseous properties (i.e., metallicities and densities) and thereby investigate the differences in dust and evolution between the fixed and time-varying IMFs. The three IMFs slopes (, , 2, and 3) in the Kroupa IMF for each gas particle in the adopted time-varying IMF depend on the physical properties of the gas particle as follows:
| (18) |
where [Fe/H] and are the metallicity and density of the gas particle, and the functional forms are different between different (i.e., different mass ranges of the IMF). The adopted IMF form means that the metallicity of a star-forming gas cloud plays a decisive role in controlling IMF. The details of the functional form () and the possible physical effects of the adopted varying IMF on galaxy evolution are given and discussed in B13b. Although we think that the time-varying IMF is a very important factor for the -evolution of dust properties in galaxies, we present the results for just one set of models with the two IMFs. This is simply because our main focus is not the roles of IMFs in galaxy formation and evolution in the present study.
2.9 Initial conditions
The present study is the very first step toward better understand the -evolution of dust properties in galaxies based on a CDM cosmology. Therefore, we adopt idealized initial conditions of galaxy formation based on a CDM model thereby determine the reasonable ranges of key parameters for dust growth and destruction and investigate dust properties of simulated galaxies. Recent cosmological hydrodynamical simulations of galaxy formation have adopted the ’zoom-in’ technique to achieve enough spatial resolution to investigate individual galaxies in a large-scale cosmological initial condition (e.g., the Eris simulation; Guedes et al. 2011). The present study does not perform such a zoom-in cosmological simulation, firstly because it is extremely time-consuming to determine the parameter ranges of dust growth and destruction by running a large number of zoom-in simulations, and secondly because the adopted GPU-based simulation code is yet to be well developed for massively parallel GPU clusters essential for such zoom-in high-resolution simulations. Cosmological zoom-in simulations of galaxy formation will be done in our future studies for a reasonable range of dust parameters derived in the present study.
The way to set up initial conditions for galaxy formation is essentially the same as that adopted by early numerical studies of galaxy formation based on a CDM model (Katz 1992; Steinmetz & Müller 1995; Bekki & Chiba 2000; Kawata & Gibson 2003). We consider an isolated homogeneous, rigidly rotating sphere on which small-scale initial fluctuations are superimposed according to a CDM power spectrum. We use the software GRAFIC (Gaussian Random Fields for Cosmological Simulations; Bertschinger 1995; 2001) in order to generate initial conditions of galaxy formation. We adopt a WMAP7 CDM cosmology with () =(0.272,0.728,0.046,0.704,0.967,0.810) (Komatsu et al. 2011) for all simulations. The starting redshift () for a simulation is determined by GRAFIC for the above cosmological parameters and the adopted initial mass, size, and particle number of a galaxy. Typically, is in the present study.
The three basic parameters in the present study are the initial total halo mass (), spin parameter (), and mass density (). The spin parameter is defined as:
| (19) |
where , , and are the total angular momentum of a galaxy, the total energy of the galaxy, and the gravitational constant. We mainly investigate the models with , 0.06, and 0.1. In order to discuss the origin of the observed metallicity-dust relation () of galaxies, we investigate the models with different ranging from to . Furthermore, we investigate the models with rather high so that we can discuss the origin of dust in high- QSOs.
2.10 Low- and high-resolution simulations
One of the main purpose of the present study is to determine the reasonable range of dust parameters for numerical simulations of galaxy formation. The determined dust parameters will be able to be adopted for future more sophisticated zoom-in simulations of galaxy formation. Owing to the limited amount of computing time allocated for the project for the present GPU-based simulations, we need to take the ‘two-fold’ strategy. First, we run a large number of low-resolution simulations () for different dust models (and SNF) so that we can determine the reasonable range of dust parameters. Then, we run high-resolution () simulations to investigate the dust properties of the simulated galaxies and present the preliminary results. In this second set of high-resolution simulations, we try to confirm that the derived dust parameters can explain observations reasonably well. The total numbers of dark matter and baryon particles, which are denoted as and , respectively, are the same for all simulations (i.e., ).
The low-resolution models with and are investigated for different dust parameters so that the final , , and can be compared with the corresponding observations for the MW. The initial radius in a comoving coordinate () and the total particle number () are set to be 1.57 Mpc and 282454, respectively (i.e., (cell size) of Mpc in the GRAFIC code), in the low-resolution models. The values of and are 1.62 kpc and 0.162 kpc, respectively, and the mass resolution is for the dark matter halo and for the baryonic component (gas). For the high-resolution models, we mainly investigate the ’fiducial’ model corresponding to the formation of the MW and the parameter values are given in Table 2. The fiducial model has , , Mpc (in a comoving coordinate), , kpc, kpc, , and .
The initial masses and sizes of galaxy formation for high-resolution models mainly investigated in the present study are summarized in Table 3. The mass- and size-resolutions are different between models with different and for the adopted constant . We investigate the high-resolution models with both CDA and VDA and different SNF (i.e., weak, moderate, and strong). We investigate the roles of time-varying IMFs in the -evolution of dust and properties only for the fiducial model in the present study. The parameter ranges investigated in the present study are summarized in Table 4.
2.11 Choice of and
As shown in previous one-zone chemical evolution models (e.g., D98) and numerical simulations (B13a), the most important parameters for the time evolution of dust are and . Furthermore, these two parameters can control the time evolution of mass fractions () in galaxies. Therefore, we need to choose carefully these two parameters in order to reproduce not only dust properties but also cold gas contents of galaxies in a self-consistent manner. We therefore first determine the reasonable ranges of these two parameters by running many low-resolution models with different and . Then we try to confirm the selected dust parameters can explain the observed and of the MW in the high-resolution models.
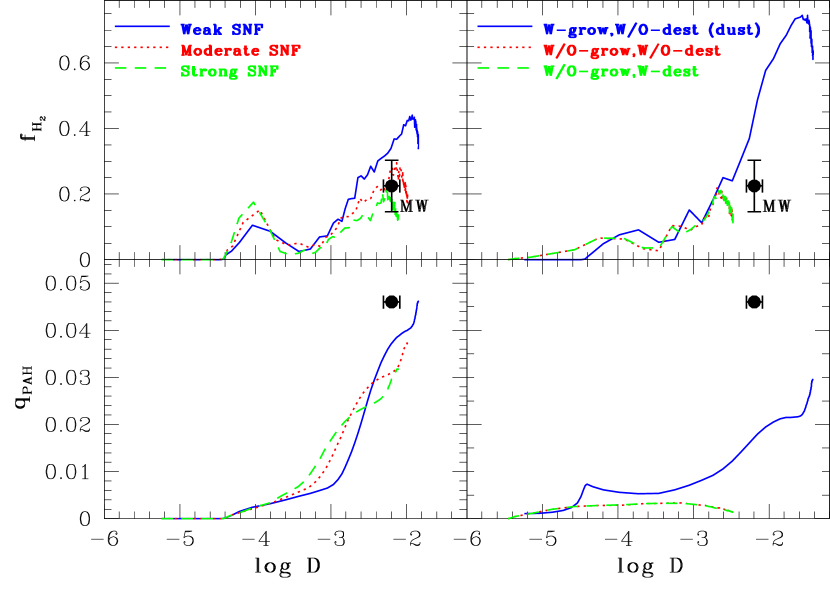
We compare the observed , , and with those of the Milky-Way (MW) models in which model parameters for initial conditions of galaxy formation are chosen for the MW formation. The time evolution of dust properties can be strongly influenced by the modeling of SNF, because dust destruction by SNe is included in the present simulations. We therefore investigate how the dust and properties of galaxies depend on modeling of SNF in the low-resolution MW models too. For comparison, we run models (i) with dust growth (‘W-grow’) yet without dust destruction (‘W/O-dest’), (ii) without dust growth (‘W/O-grow’) and without dust destruction, and without dust growth and with dust destruction (’W-dest’).
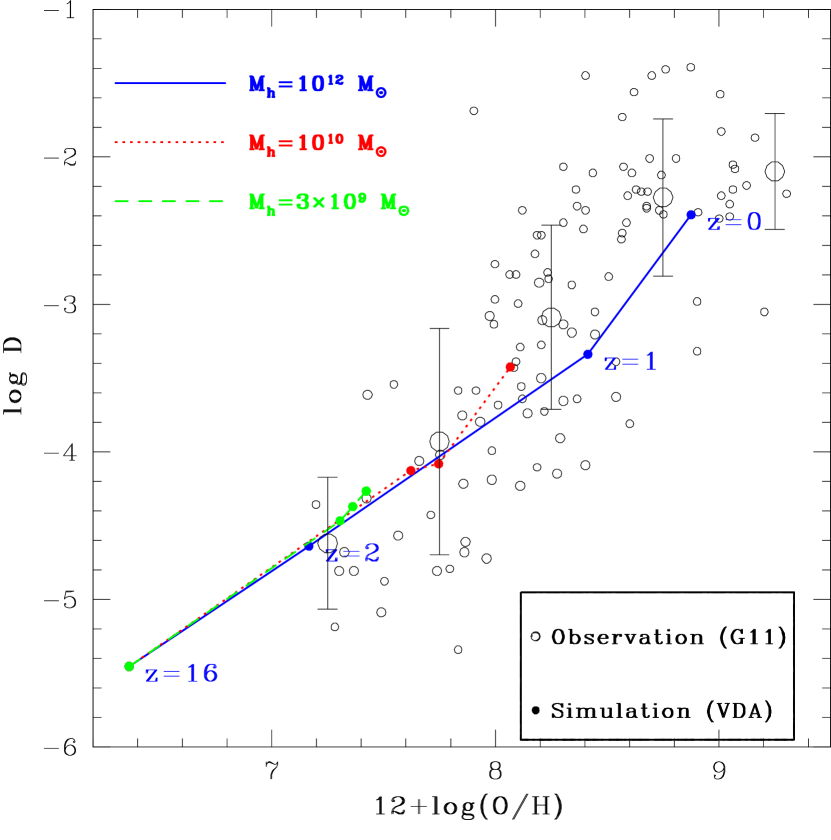
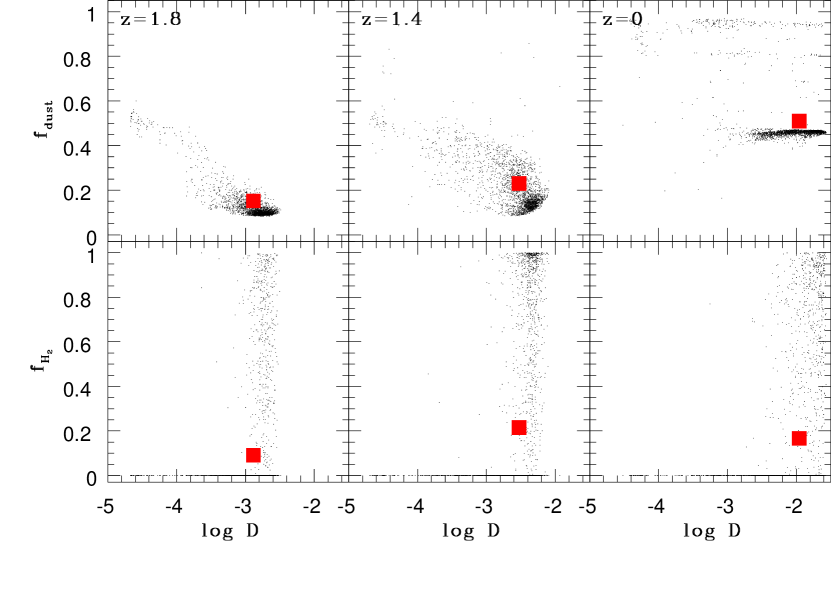
Figure 1 shows the comparison between the simulated locations of disk galaxies at on the and planes with the corresponding observations for the MW. The observational data points are from Draine & Li (2006), Zubko et al. (2004), and Nakanishi et al. (2003, 2006). It should be noted here that there is an uncertainty in the CO-to- conversion factor, ’X-factor’, in estimating (Nakanishi et al. 2006). Both a constant X-factor of ( ) and radial-dependent X-factor are adopted for the estimation of the total mass of the Galaxy in Nakanishi et al. (2006). The observational error bar of indicates the possible range of for a factor of 50% changes in the X-factor: The real range of the X-factor difference could be even larger than 50%. The two left panes with same dust parameters ( Gyr and Gyr) yet different SNF models clearly show that the final , , and are higher for weak SNF. Star formation is less strongly suppressed in the models with weak SNF so that chemical evolution and dust enrichment can proceed more efficiently. Dust is less efficiently destroyed in these models so that formation can proceed more rapidly in these models. As a result of these, can be finally larger in these models.
It appears that the model with moderate SNF can better reproduce the observed locations of the MW on the two planes. However, as shown in B13a, the evolution of and depends slightly on spatial resolution and minimum time step width of simulations. Therefore, this result can not be taken as a face value, and we need to confirm the dependences of evolution on SNF modeling later in the high-resolution models. In the adopted PAH models, the final appears to be slightly smaller than the observed one for the three SNF models. The mass fraction of Carbon metals from C-rich AGB stars that can be locked up onto dust grains is assumed to be 0.05 in these models, because our previous models with this number (0.05) could better explain the observed of the MW. If a larger value of this lock-up fraction is adopted, the final can be larger and thus closer to the observation.
The right two panels in Figure 1 shows that if dust destruction is not included, the final and can be too large to be consistent with observations. Furthermore, if dust growth is not included, then the final is too small to be consistent with observations (irrespective of whether dust destruction is included or not). These three ’non-standard’ models also show too small at their final . These results clearly demonstrate that both dust growth and destruction need to be included properly in numerical simulations of galaxy formation and evolution for self-consistent reproduction of , , and in the MW.
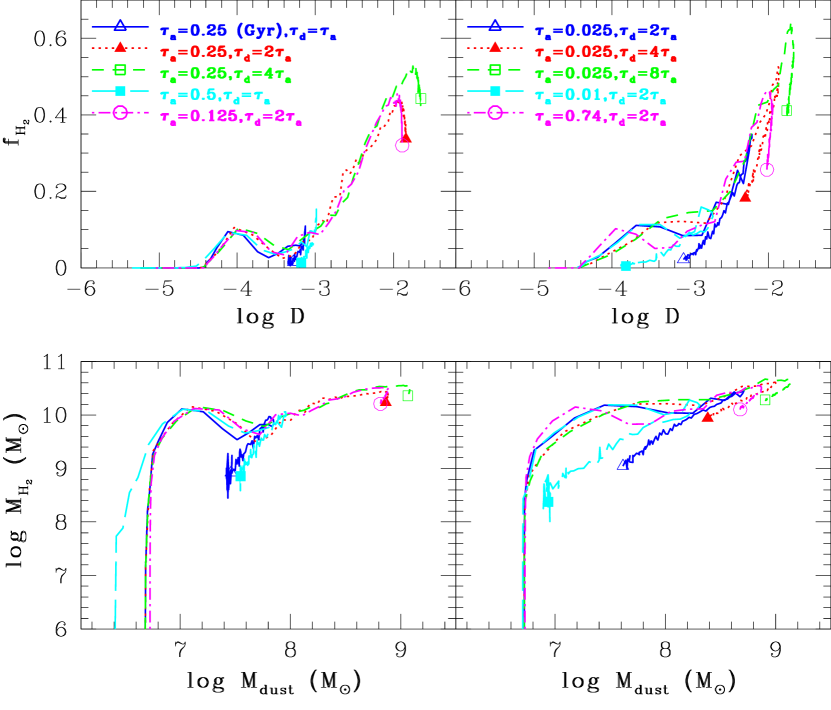
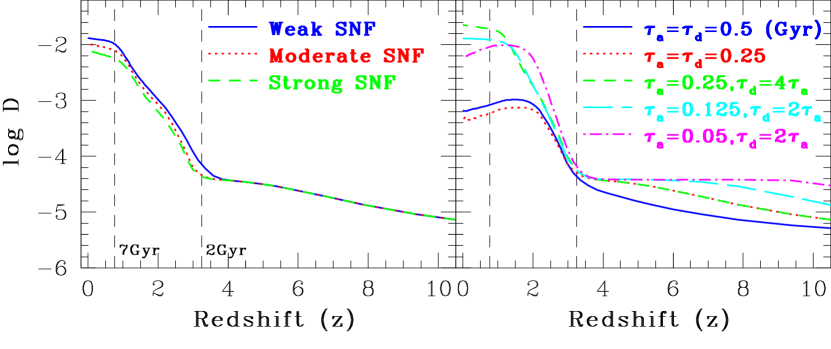
The left two panes in Figure 2 shows that as long as , the time evolution and the locations of the simulated galaxies on the and planes are reasonable for Gyr and 0.25 Gyr. For the model with Gyr, and at the final are reasonable too even for . These results for galaxy formation based on a CDM model are consistent with those in B13a in which simplified initial conditions of galaxy formation through gravitational collapse are adopted. However, the models with for Gyr and 0.5 Gyr show a very strange behavior in the sense that and decrease from some points owing to the too rapid destruction of dust grains by SNF. This behavior of dust and content evolution can not be realistic and such models with should be rejected. These results demonstrate that the ratio of dust growth to destruction timescales is a key for the evolution of dust and and thus carefully chosen in numerical simulations of galaxy formation and evolution.
The right two panes in Figure 2 shows that even if , the models with rather short (=0.01 Gyr and 0.025 Gyr) can show (i) an unrealistic behavior in the time evolution of galaxies on the two planes and (ii) the final inconsistent with observations. The origin for the rapid decrease of and is that SNF can more rapidly destroy dust grains than SNe and AGB can produce dust. These results demonstrate that not only the timescale ratio of dust growth and destruction but also the timescale of dust growth is important for the time evolution dust and properties of galaxies. It should be noted here that a larger () is required for the models with Gyr to show a realistic behavior of dust and content evolution. However, the models with short yet high show a slightly too large final () owing to too rapid growth of dust. We thus consider that such models with rather short would not be so realistic for dust and evolution of galaxies.
3 Results
3.1 Redshift evolution of dust and contents
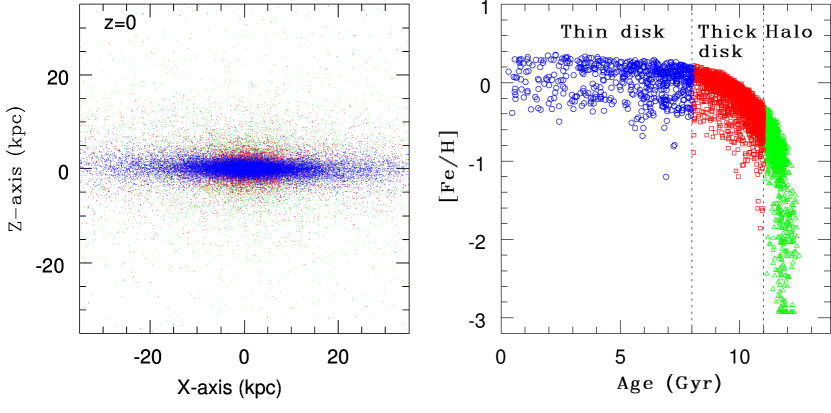
Figures 3 and 4 show the -evolution of the projected dust mass densities distributions () and the final distributions of stars with different ages and metallicities, respectively, for the fiducial model with , , the fixed IMF, and the standard CDA. Dust densities can become higher in subgalactic clumps at high (), owing to the growth of pre-galactic dust grains (i.e., dust from Pop III stars assumed in this simulation). Many dusty subgalactic clumps are connected with one another by low density filamentary structures at , which appears to be a ’cosmic web’ of dusty gaseous regions. Star formation at this stage is not active so that the increase of dust abundances due to metal ejection from SNe and AGB stars can not occur efficiently.
The interstellar dust of this forming galaxy can rapidly grow during early disk formation through dissipative merging of dusty gas clumps (). The dust densities are higher in the inner regions of subgalactic clumps, where star formation from gas clouds is ongoing very efficiently so that dust production rates from SNe and AGB stars can be very high. The merging of these clumps trigger starbursts in the forming galactic gas disk, and consequently chemical and dust enrichment processes can proceed very rapidly. As a result of this, the dust surface densities in the central regions of the disk can become significantly higher ().
The 2D distribution shows an intriguing outer ring-like structure, and the disk has many isolated dusty clumps in its outer halo region at . The final galaxy consists of three spatially different components, thin and thick disks, and old stellar halo at , as already shown in early chemodynamical simulations of disk galaxy formation (e.g., Steinmetz & Müller 1995; Bekki & Chiba 2000; Brook et al. 2004). The age-metallicity relation (i.e., higher [Fe/H] for younger ages) can be clearly seen in this model and the final stellar [Fe/H] at is consistent with the observed (solar) value. Since the origin of these different components of disk galaxies with different age and metallicity distribution functions have been discussed in many simulations already, we do not discuss these in the present study.
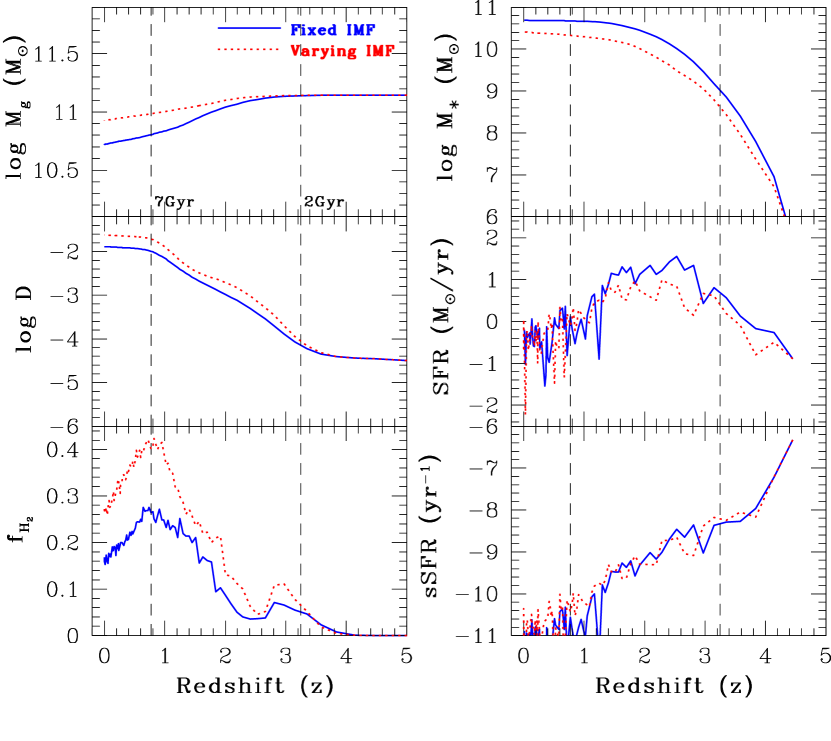
Figure 5 shows that although the -evolution of is not so rapid, the dust-to-gas-ratio () can dramatically increase during the early disk formation () via dissipative merging of gas-rich subgalactic clumps for the fixed IMF model. This strong increase can be seen also in the -evolution of and thus is in a striking contrast with the recent observational result that high- submillimeter galaxies appear to have similar to the optically selected SDSS galaxies at lower (D11). The slow and steady increase of at is due simply to the dust growth via accretion of gas-phase pre-galactic metals onto already existing dust (i.e., not due to the production of dust from active star formation at high ).
The total dust mass () in the models with weak SNF and CDA can be significantly larger than owing to the less efficient dust destruction by SN and dust growth in every gas particle. As discussed later, the total dust mass of a galaxy at depends on the modeling of SNF and dust models (CDA or VDA). As a result of larger , the final in this model is higher than the observed of the MW. In this high-mass model, the formation of small dwarf galaxies at very high can not be well resolved (owing to the adopted particle number) so that the production of dust from SNe and AGB stars can be underestimated in the high- subgalactic clumps. As a results of this, the formation of on dust grains can abruptly become very efficient at and the time evolution of and are very steep around .
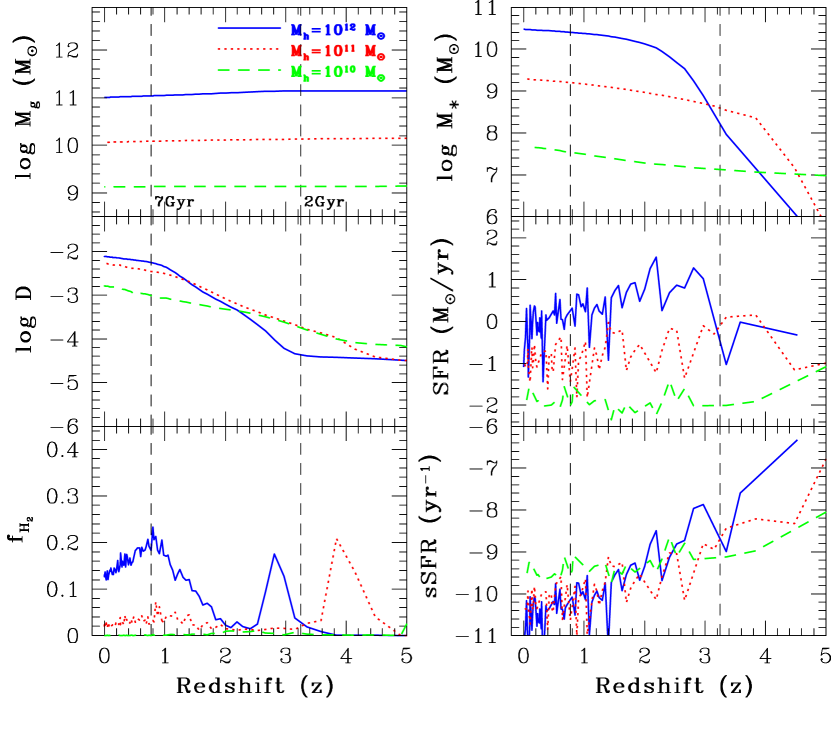
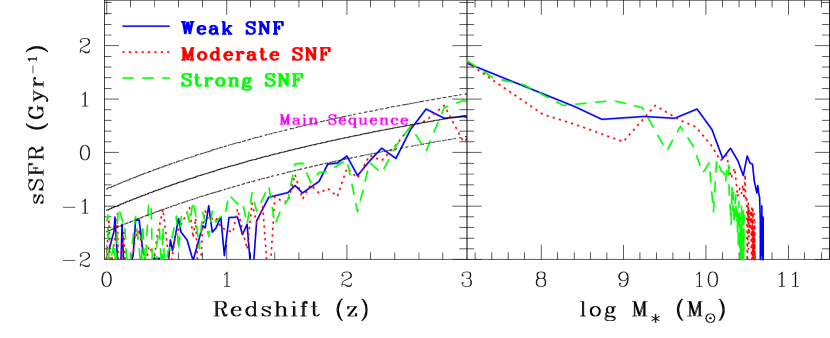
The total stellar mass () increases more sharply at , when both the SFR and sSFR (i.e., SFR/) are rather high. In the later phase of disk formation (), can grow slowly, which means that does not change so much at lower (owing to the slow change of ). The sSFR can be higher at higher , when gas-rich low-mass building blocks merge with one another to form new stars quite efficiently. The presence of a peak in the -evolution of the SFR in this model is in a striking contrast with no peak in that of the sSFR. It should be stressed here that both and are the total masses of dust and stars, respectively. The total dust mass within the disk () is significantly smaller than owing to the presence of dusty gaseous halos.
It is intriguing that the -evolution of shows two peaks at (earlier) and (later). The first peak corresponds to the most active star-formation phase of massive subgalactic clumps, where chemical/dust enrichment processes and thus formation on dust grains are effectively ongoing. During dissipative merging of gas-rich subgalactic clumps at the early disk formation, gas can be rapidly consumed by starburst in the gas disk so that and can become slightly smaller. After the first peak, gradual accretion of gas and the subsequent star formation can cause dust enrichment and thus effective formation on dust grains so that can again start increasing. Further consumption by star formation in the disk can decrease again, which ends up with the second peak.
It is clear that the -evolution of , , , and can be significantly different between the fixed and time-varying IMF models. During the disk formation with active star formation, the IMF can become more top-heavy so that a larger amount of metals can be produced and then recycled into ISM of the forming disk for the time-varying IMF. Consequently, a larger amount of dust can be retained in the disk and a larger amount of gas can be processed on dust grains. The final and can be accordingly larger in the time-varying IMF than in the fixed IMF. These intriguing differences in the time evolution of and have been already reported in B13b for disk galaxy evolution. It should be noted also that the final is smaller in the time-varying IMF, which means that stronger SNF due to more top-heavy IMF in active SF regions can suppress the gas consumption by star formation in the model. The more severe suppression of SF in the time-varying IMF (i.e., slower gas consumption) can be therefore confirmed in the present study based on the CDM model. The present study confirmed that this different evolution between the fixed and time-varying IMFs is possible in the disk galaxy formation based on a CDM model. The basic behaviors of and evolution (e.g., two peaks and rapid evolution in disk formation) are essentially the same between the two IMF models.
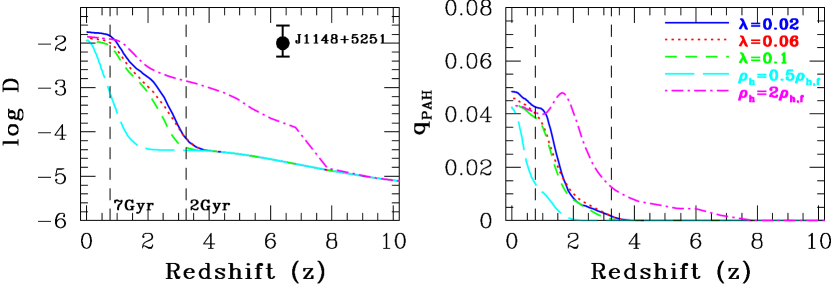
Figure 6 shows that the -evolution of and and depend more strongly on the initial mass densities of dark matter halos than on the spin parameters () for a given total mass. The steep and increases come earlier in the model with the higher initial dark matter density, mainly because star formation and the subsequent chemical and dust enrichment processes can start in subgalactic clumps earlier in the model. The observed large and at a high- QSO SDSS J1148+5251 (), however, can not be reproduced even by the high-density model in which and can start increasing at . This would mean that the dusty QSO at can be formed from very rare high-density peak and dust growth can be more rapid than the present model predicts. The origin of this QSO has been discussed by previous works (e.g., Dwek et al. 2007; Valiante et at. 2012). We accordingly do not discuss the origin of this object in detail in the present paper.
Figure 7 confirms that the -evolution of depends both on the modeling of SNF and on dust growth and destruction parameters. The final can be larger in the model with weak SNF, mainly because chemical and dust enrichment can proceed more efficiently owing to a larger amount of gas being converted into new stars in the model. The timescale ratio of to is important and should be as large as 2 so that the final can be within a reasonable range () for the MW-type disk galaxies. The models with shows unrealistically small final () at , because dust can be very rapidly destroyed by SNF in these models. These confirm the results of the low-resolution models shown in Figure 2.
Figure 8 shows that can more sharply increase in more massive forming disk galaxies and the final can be larger in the more massive galaxies. All of these three disk galaxies with different masses show the two peaks in evolution, though the second (later) peak is less clearly seen than the first (earlier) one. The low mass model () has a less pronounced second peak in evolution, which is in a striking contrast with other two more massive models (the first peak in the low mass model is around , which is outside the range of the plot in Figure 8). The first peak in evolution comes earlier in forming disk galaxies with lower masses owing to the earlier gravitational collapse. These results suggest that more massive galaxies can have larger and at .
3.2 relation
3.2.1 Constant Dust accretion model
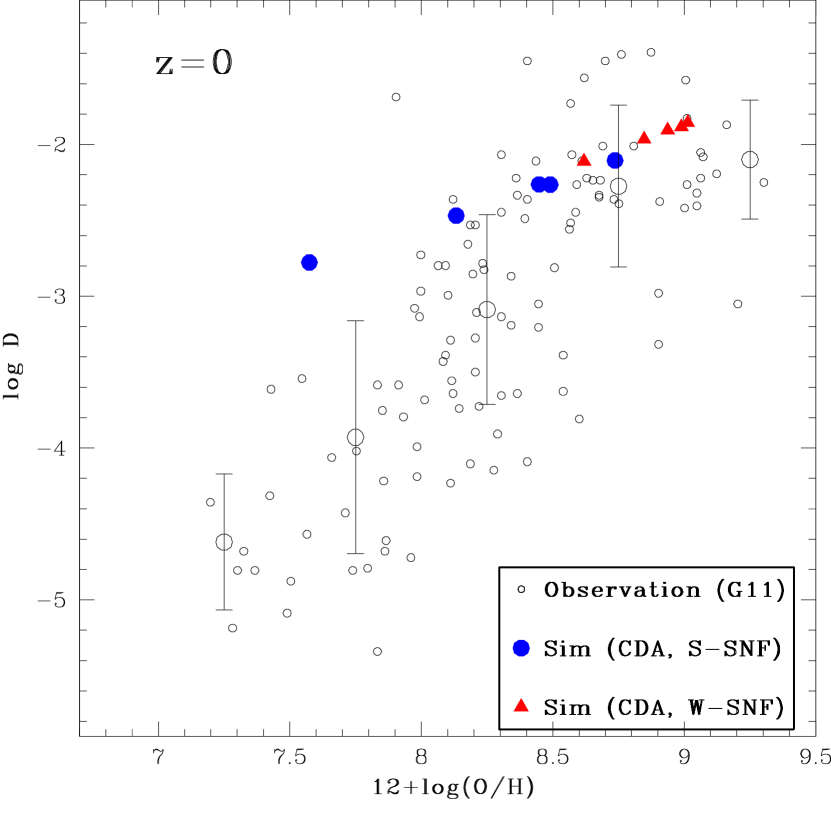
Figure 9 shows that the metallicity-dust () relation can be clearly seen in the models with CDA and weak SNF, though the relation appears to be significantly shallower than the observation. The simulated range of is narrower than the observed one in spite of the investigated large range of initial halo masses (). The models with strong SNF show wider ranges of and than those with weak SNF and thus better reproduce the observed relation. However, the simulated slope in the relation is similar to that in the models with weak SNF and thus appears to be less consistent with observations, though the observation shows a large scatter in D at a given .
Furthermore these two models with CDA show significantly higher at than the observed, which means that the present simulations overestimate in low-mass galaxies for some reasons. A possible reason for this will be discussed later in §4. Thus, although the present models with CDA and different SNF demonstrate that the origin of the metallicity-dust relation can be closely associated with the different effectiveness of SNF in galaxies with different masses, the observed steeper relation and the large dispersion at a given are not well reproduced by the models.
3.2.2 Variable dust accretion model
CDA dust models assume that the dust growth time scale for each gas particle depends only on the gas-phase metal abundance. Therefore, dust can grow with a timescale of dust growth inversely proportional to the gas-phase metal abundance (i.e., more rapid growth for higher gas-phase metal abundances), even if the density of a gas particle is low. Consequently, can increase with time for all particles irrespective of their gas density and temperature, as long as the particles have metals. This way of dust growth in CDA models might not be so realistic in real galaxy formation and evolution, though CDA models were adopted in almost all previous models of dust evolution and successful in reproducing the mean dust properties of galaxies (e.g., D98; Hirashita 1999; B13a,b). The dust growth timescale in a gas cloud depends not only on the gas-phase metal abundance but also the temperature and density of gas cloud. Therefore, it is possible that dust growth can be suppressed in low-density gaseous regions and outer halo gas in galaxies.
Figure 10 shows the locations of galaxies on the plane at (initial), 2, 1, and 0 (present) in VDA with strong SNF for , , and . The final of less massive galaxies at becomes lower in these VDA than in CDA so that the relation can be steeper. A larger amount of gas (metals and dust) can be ejected from low-mass galaxies during galaxy formation through SN winds caused by strong SNF. The ejected gas can have lower gas density so that dust growth can not efficiently occur owing to the assumed dependences of dust growth timescales on gas density in VDA. As a result of this, the final and thus can become significantly smaller in VDA.
However, the observed low () can be better reproduced in the models only if is very low (). The observed very low () can not be reproduced by the present models even for very low initial dark halo masses (). It would be intriguing that dwarfs with a wider range of () show such a very low in observations. It would be unreasonable for the present study to explain the observed very low by lowering to much less than . We thus conclude that the observed very low could be due to some physical effects that are not included in the present study. The cold gaseous components of low-mass forming galaxies can be photo-evaporated by ultraviolet background radiation in a high- reionized universe so that star-formation (and thus chemical and dust enrichment processes) can be severely suppressed (e.g., Susa & Umemura 2004). This radiative feedback effect is not included in the present study and thus could be a possible reason for the observed very low .
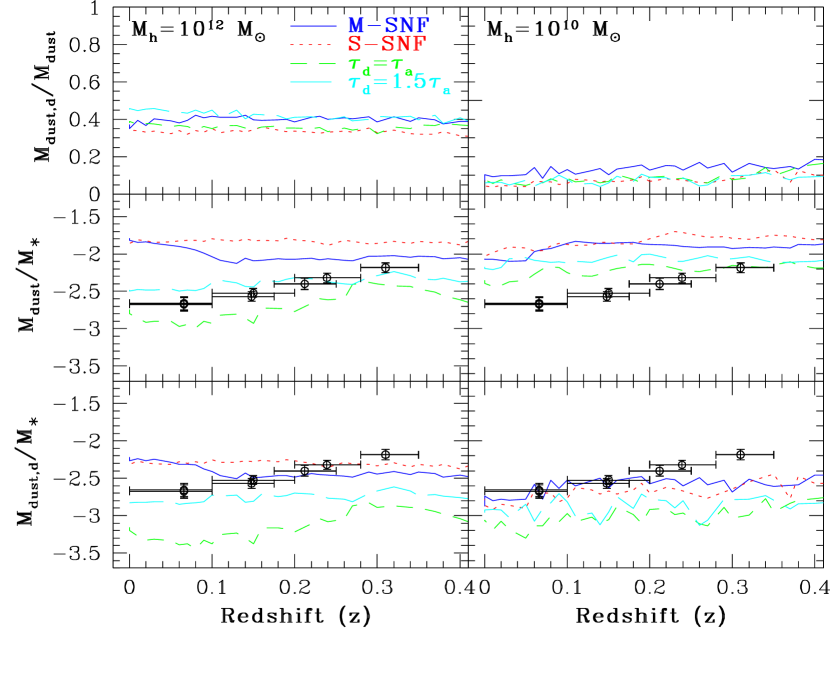
Figure 11 shows that the -evolution of dust-to-stellar-mass ratios () for is rather flat for the high mass model with . The observational results by D11 show that there is a factor of difference in between and 0.4. The models with moderate and strong SNF show systematically larger and thus the results are inconsistent with the observed -evolution. The models with shorter dust destruction timescales ( and 1.5) can show a certain degree of decrease, the models are still unable to reproduce the observed dramatic decrease. The systematically higher can be seen in the low mass model
It should be stressed here that the total dust mass of a galaxy in the present study might not correspond to the observed total dust mass, because of a simulated disk includes both disk and halo dust whereas the observed total dust of a galaxy would not include halo dust of the galaxy. We therefore investigated the -evolution of in the two mass models for a possibly fairer comparison. It is clear in Figure11 that the simulated does not show the observed level of dramatic decrease from to 0. Since the low-mass simulated disk has a larger fraction of halo dust (i.e., smaller ), its can be systematically lower than the observed value.
The reason of this failure of the present models to reproduce the observed dust evolution can be understood as follows. The total dust masses of galaxies can decrease mainly through gas consumption due to star formation within the galaxies in the present models. Gas consumption by star formation between and 0.4 is not high so that dust mass can not decrease so significantly. Furthermore, the total stellar mass can only slowly increase between and 0.4 through the formation of new stars. Therefore, the present models fail to reproduce the observed factor of decrease of and . We thus conclude that the present models can not reproduce the observed dramatic evolution of dust masses and dust-to-stellar-mass ratios between and 0.4.
3.3 Dust scaling relations at different
It is useful for the present study to provide some predictions on the dust-scaling relations, given that recent observational studies have started to reveal a number of dust scaling relations of galaxies (e.g., Cortese et al. 2012). Four dust and scaling relations are derived for 18 models with VDA and the results are described in Figure. 12-15. Figure 12 shows that a clear positive correlation between (total stellar mass) and (i.e., larger for larger ) is already established at in the simulated galaxies. The simulated correlation can be fit roughly to and does not appear to change significantly between and . The fact that the relation is less clear at suggests that the correlation can be established during the early formation of galactic disks (). The correlation does not show a large dispersion at a given in the present simulations.
As shown in Figure 13, the simulated galaxies with larger have larger at , 1, and 2, though the positive correlation can not be clearly seen at . The simulated is closer to the observed one by Corberi et al. (C12) at and starts to deviate from the observed one for galaxies with lower () at . The differences in between the observed and simulated correlations become very clear for galaxies with lower dust masses at . The simulated lower results from the fact that low-mass and low-metallicity galaxies can experience both the steady consumption of and much less efficient production (owing to low metallicity/dust contents and low gas densities) at later . This inconsistency between the observed and simulated correlations for low implies that some physical effects missing in the present study would need to be included in our future work.
Figure 14 shows that the simulated galaxies with larger show larger at , 1, and 2, though such a clear positive correlation can not be seen at . As shown in Figure 12, galaxies with larger can have larger so that the formation of gas can be more efficient in the galaxies. Therefore, it is reasonable that galaxies with larger have larger . It seems that (i) the dispersion in for a given becomes smaller at lower in the present simulations and (ii) for a given is higher at higher . These results will be able to be compared with future ALMA observations of total gas mass in galaxies at different .
As shown in Figure 15, the simulated galaxies have a positive correlation between and at , 1, and 2, though the slope of the correlation appears to be slightly different at different . The simulated almost linear (i.e., steep) correlation implies that low-mass galaxies with low can form stars much less productively owing to very low masses. The predicted tight correlation at (and lower ) can be tested against ongoing and future observations for a wide range of .
3.4 Radial gradients of and dust depletion levels
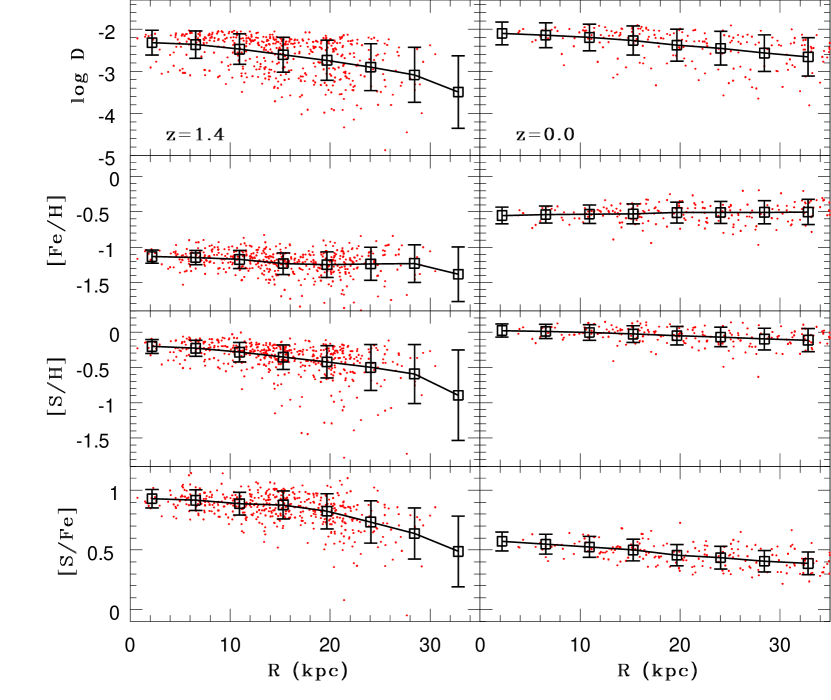
Figure 16 shows that the simulated disk galaxy at in the MW model with VDA has a negative radial gradient of (i.e., larger in smaller ), though the dispersion of at a given is quite large at this epoch. The main reason for this negative radial gradient is that the disk can have rather small in the outer region where chemical enrichment has not yet well proceeded at when the disk is still forming via dissipative merging. It should be stressed here that although different local regions (marked by small red dots) show quite different , [S/Fe] (corresponding to dust-depletion level), and [S/H] (corresponding to gas-phase metallicity that is not influenced by dust-depletion), both and [S/H] show negative radial gradients. The derived negative and gradients in the present models, which show large variation, are consistent with the recent observations for M31 (e.g., Draine et al. 2014).
The radial gradient of later becomes shallower at owing to chemical and dust enrichment processes in the outer part of the gas disk. Gas-phase chemical abundances ([Fe/H] and [S/H]) in the disk show slightly negative radial gradients and their dispersions are quite large at . The gradients become almost flat with smaller dispersions in the gas disk at . Thus, the radial gradients of and gas-phase chemical abundances evolve significantly with for the MW model with VDA.
In the present dust models, gas-phase [S/Fe] can be used as a measurement of dust depletion for each gas particle, because dust depletion is not included for S whereas it is properly included for Fe. The radial gradient of [S/Fe] at is negative (i.e., larger in smaller ) and steeper with increasingly larger dispersions at larger in this model. The derived dispersion in [S/Fe] means that dust depletion levels can be quite different between different individual local gaseous regions in a forming galaxy. The radial gradient of [S/Fe] at is flatter with rather small dispersions at different , which suggests that the spatial variations of dust depletion levels can be more clearly seen in the high- galaxies. These derived spatial and temporal variations of dust depletion levels have some important implications on observational and theoretical studies of galaxy formation, which are later discussed.
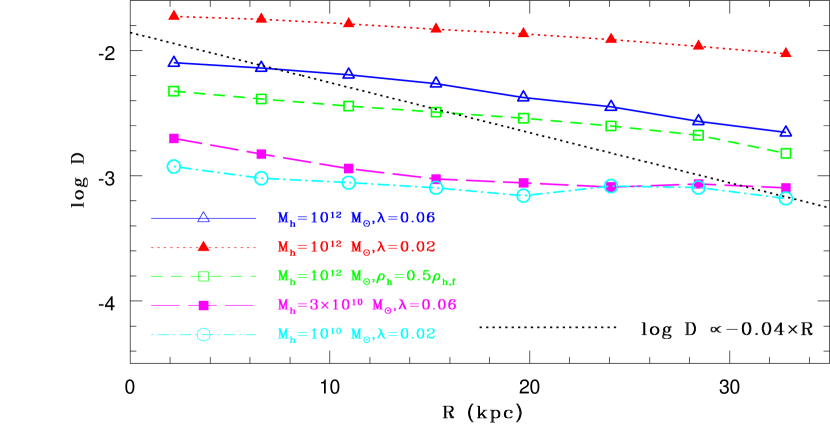
As shown in Figure 17, the radial gradients of at can be quite different in galaxies with different , , and for a given set of dust parameters. Although all of the models in Figure 17 show the negative radial gradients of , the gradients are less clear for low-mass models with . The slopes of the radial gradients are significantly shallower than (dex kpc-1) that is observed for the metallicity gradient of the Galaxy (e.g., Andrievsky et al. 2004). The negative radial gradients of less steeper than gas-phase metallicity gradients can be tested against ongoing observations.
Figure 18 shows that the dust-to-metal ratios () are quite different between different individual gaseous regions of a single galaxy at , 1.4, and 1.8 and can be quite different for a given . The mean evolves with such that it can become larger (i.e., more strongly dust-depleted) at lower . The derived temporal and spatial variations of strongly suggest that a fixed dust-to-metal ratios should not be adopted in theoretical works on the SEDs of galaxies and the formation and evolution of cold gas. The dispersion of at a given can be clearly seen at the three in this model, which demonstrates that larger does not necessarily mean higher efficiencies of formation in galaxies.
The main physical reason for large variation is that different local regions experience different chemical evolution histories and dust accretion and destruction processes caused by different physical conditions of ISM and star formation histories. Therefore, the derived variation is not due to the adopted models (e.g., star formation dependent on densities) in the present simulations. Such a large temporal variation is already found in previous one zone models, e.g., Figure 6 in Inoue (2003) and Figure 7 in Calura et al. (2008).
Recent observational studies on dust-to-metal ratios in damped Lyman- absorbers (DLAs) at higher () have revealed a large (a factor of ) variation of in the ISM of the DLAs (e.g., De Cia et al. 2013). Furthermore, at a given in the observed relation shows rather large dispersion (G11), which suggests that dust-to-metal-ratio is not constant among different galaxies. These observations are consistent with the large variation derived in the present study. The possible temporal and spatial variations would have some implications on some recent observational works, e.g., Eales et al. (2012), which have tried to estimate the total amount of cold gas in galaxies by using the continuum dust emission, and Grootes et al. (2013), which have revealed correlations between the stellar mass surface densities and the optical depth due to dust in galaxies.
3.5 Formation of extended dusty gaseous halos
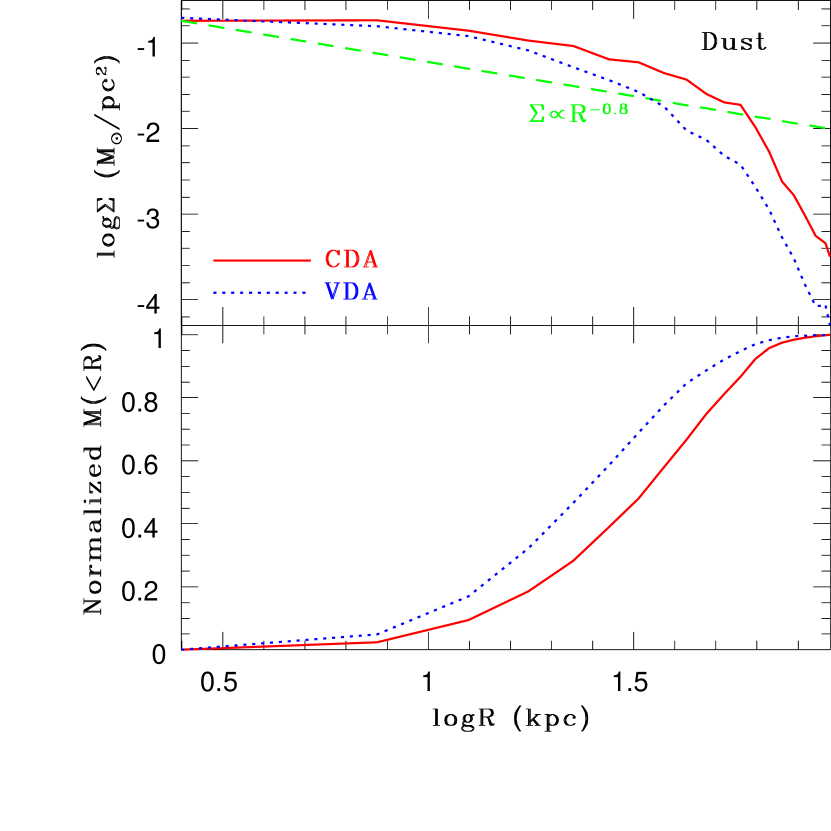
The simulated negative radial gradient of in Figure 16 implies that the projected radial density profile of dust in a galaxy can have a steep gradient. Figure 19 shows that the simulated disk galaxies can have gaseous halos ( kpc) extended well beyond the disk sizes ( kpc). The radial profile of the cumulative dust mass () normalized by the total mass within 100kpc (kpc)) clearly demonstrate that a larger fraction of dust in the outer () halo of the simulated disk galaxies. The extended dusty gaseous halos can be formed in most of the present models. Since the present chemodynamical models do not include the dust destruction by hot gaseous plasma in galaxy halos, they might have overestimated the total amount of halo dust.
The simulated slope in the mass profiles of dust in the outer halo ( kpc) are too steep to be consistent with the observed one () by Ménard et al 2010 (M10). It is currently unclear why the observed slope is significantly shallower than the mass distributions of gas and dark matter halos in galaxies. Possibly, we would need to incorporate an additional physical process for dust evolution (e.g., radiation pressure on dust grains) into chemodynamical simulations in order to reproduce the observed shallower profile of dust.
During the hierarchical build-up of the disk galaxies, their cold gas containing dust can be expelled from the galaxies owing to the energetic SNF. The expelled dust can not be return back to the host galaxies quickly so that they can be observed as being in the halo regions. This ‘blown-off’ effect of SNe is the key physical process for the formation of dusty gaseous halos in galaxies. As shown in Figure 11, the mass fractions of halo dust () can be larger in less massive galaxies. This is mainly because the less massive galaxies are more prone to the energetic SNF during their formation. It is observationally unclear, however, whether less massive disk galaxies have larger fractions of dust in their halos.
4 Discussion
4.1 Origin of the observed relation
Recent observations have found the following three characteristics of the metallicity-dust relation in galaxies (e.g., G11). First, more metal-rich galaxies with larger can show larger . Second, the dispersion in at a given is much larger than the possible observational error in the estimation of . Third, the metallicity-dust relation appears to be different for and ). The linear correlation for appears to be steeper than that for . The present study has shown that more massive galaxies can show both larger and larger , which is qualitatively consistent with the observed relation. Furthermore, the simulated relation is steeper and thus more consistent with the observed one, if the strong SNF model is adopted. The main physical reason for the larger in more massive galaxies is that a larger fraction of dust and metals can be retained in the galaxies (i.e., removal of dust and metals through energetic stellar winds is not so effective in more massive galaxies).
Although the present study has demonstrated that SNF is a key physical process for the formation of the metallicity-dust relation, the observed large scatter for a given can not be well reproduced in the present study. One possible reason for this is that the present simulations do not include dust removal through radiation pressure of stars on dust grains. If only dust (not gas-phase metals) can be selectively removed by this radiation process, then can be even lower for a given . This removal of dust through dust winds caused by stellar radiation pressure might depend on a number of physical parameters of dust and galaxies, such as size distributions of dust grains and age distributions of stars in galaxies. Therefore, the dust removal efficiency might be different between galaxies with a similar so that galaxies with a similar can show a larger dispersion in . In order to discuss whether the selective dust removal through stellar radiation is possible, we will include the dust removal process in our future more sophisticated simulations.
The observed apparently steeper slope for can not be clearly seen in the present study. The observed presence of dwarfs with and at can not be well reproduced by the present study either. The observed very low in dwarfs implies that dust is either destroyed or removed more efficiently than the present simulations predict. Some of the observed dwarfs at show a very low (), which is very hard to be explained by the present study. This inconsistency between observations and simulations clearly suggests that some physical effects related to dust formation and evolution missing in the present simulations need to be included in our future simulations.
4.2 Temporal and spatial variations of dust-to-metal-ratios in galaxies
The present study has shown that dust-to-metal ratios () of galaxies evolve with and they can be quite different between different local gaseous regions in an individual galaxy at a given . This result provides the following implications on the observational and theoretical derivation of galactic SEDs and the construction of formation models in numerical studies of galaxy formation and evolution. Numerical simulations of galaxy formation and evolution tried to predict the SEDs of dusty galaxies based on the age and metallicity distributions of stars and the spatial distributions of gas and stars in simulated galaxies (e.g., Bekki et al. 1999; Bekki & Shioya 2000, 2001; Jonsson 2006). A basic assumption in these previous works is that is fixed at a certain value (e.g., an observed value for the Galaxy) for all gas particles at a given time step. The present results suggest that such an assumption of constant is not reasonable, though it is unclear how much the previous derivation of galactic SEDs can change if variation is correctly included in their simulations. Future numerical simulations of dusty galaxies will need to include spatial and temporal variations of in order to predict the SEDs more precisely.
Numerical simulations of galaxy formation and evolution and theoretical models of star formation have just recently started to include formation on dust grains in ISM (e.g., Pelupessy et al. 2006; Krumholz, McKee & Tumlinson 2009; Christenson et al. 2012). Although the formation of on dust grains depend on dust abundances, compositions, and size-distributions, the formation efficiencies of on dust grains in these works is assumed to be a function of metallicity (i.e., dust abundances is simply proportional to metallicity). The present results mean that the assumed constant is clearly an over-simplification for the formation processes and thus that the previous simulations might have over- or under-estimated the total masses of galaxies. Future numerical simulations of galaxy formation and evolution with formation will need to include the time evolution of in order to predict contents of galaxies more precisely.
4.3 Consistency with observations
Although the present study has shown only the preliminary results of the simulations, it would be meaningful for the study to discuss the consistency between the simulated dust properties of galaxies and the corresponding observational ones. If the observed properties are not reproduced by the present models, then additional physical effects on dust grains that are not included in the models should be considered in future more sophisticated models. Table 5 lists up 13 physical properties of galaxies for which observations and simulations are compared with.
Only three observations among thirteen can be reproduced reasonably well by the present model, which means either that some key physical processes related to dust formation and evolution are not incorporated properly in the model or that the resolution of numerical simulations or adopted idealized initial conditions can be responsible for the less successful reproduction. Clearly, the influences of stellar radiation on dust grains (e.g., Ferrara et al. 1991; Bekki & Tsujimoto 2014) is completely ignored, though it can remove the dust from gas disks of galaxies. This ignorance might lead us to overestimate the dust production rate within galaxies. Furthermore, the dust-gas interaction, which is demonstrated to be important in galactic dynamics for large dust mass fractions (Theis & Orlova 2004), is also ignored in the present study. We will need to include these missing ingredients in our future simulations to address the latest observations of galactic dust evolution in detail.
Lastly, we briefly discuss the present dust-regulated star formation model by comparing the observed correlations of sSFRs with and (Elbaz et al. 2011, E11) with the corresponding simulation results. Figure 20 shows that the sSFRs are systematically lower than those for galaxies on the ‘main sequence’ at lower (). Furthermore, sSFRs of the two simulated disk galaxies at seem to be lower for their large . These results imply that the present dust-regulated SF model (or -dependent SF model) might underestimate the star formation efficiency in ISM of galaxies. We need to discuss this point in a separate paper.
5 Conclusions
We have investigated the -evolution of dust and gas contents in galaxies and its dependences on initial conditions of galaxy formation models based on a CDM cosmology by using our chemodynamical simulations with dust growth and destruction. This is the very first application of our new chemodynamical simulation code with dust evolution to a numerical study of hierarchical galaxy formation. We therefore needed to derive a reasonable range of dust parameters that explain observations by running a large number of models based on somewhat idealized initial conditions. The derived dust parameters will be used for future more sophisticated zoom-in galaxy formation simulations.
In this preliminary investigation,
we have focused particularly on the -evolution of
total dust and masses ( and , respectively),
dust-to-gas-ratios
(), molecular hydrogen fraction (),
dust depletion levels ([S/Fe] and ),
gas-phase abundances (12+log(O/H)),
and radial gradients of and gas-phase abundances.
We have also investigated
correlations and scaling-relations between these properties and
the dependences of dust and properties on
initial mass densities, spin parameters, and masses of galaxies.
The present preliminary results are as follows
(1) The dust growth and destruction timescales ( and , respectively) need to be carefully modeled so that both the present dust and properties of luminous galaxies can be reproduced reasonably well. For example, as long as Gyr is required for the models with CDA to explain the observed dust and properties of the Galaxy. Without dust growth and destruction, the observed and can not be well reproduced by the present simulations. These results imply that dust evolution needs to be properly included in numerical simulations of galaxy formation for predicting not only dust properties of the present galaxies but also the -evolution of contents in galaxies.
(2) Both and can grow rapidly during the early dissipative formation of galactic disks through merging of gas-rich subgalactic clumps at . The -evolution of and in disk galaxies depends strongly on mass densities of forming galaxies in such a way that and evolution can start increasing earlier and the commencement of the rapid increase is slightly later than that of the rapid increase in galaxies. The time evolution of and does not depend so strongly on spin parameters () for a given initial mass.
(3) Disk galaxies with lower initial masses can lose a larger amount of dust through SN winds so that their final and can be smaller. The present variable dust growth model (VDA) can better reproduce the observed relation than the fixed dust growth model (CDA). However the observed relation shows a significantly larger dispersion of at a given than the simulated one. The present simulations do not reproduce the observed dwarfs with low () and very low () at . This failure of the present models to reproduce such a low at could be related to the fact that the present models do not include dust removal through dust wind due to radiation pressure of stars.
(4) The simulated disk galaxies show little evolution of () and () between and 0.4. The observed dramatic evolution (a factor of differences between and 0.4) of these dust properties derived by D11 is thus inconsistent with the present results. The total amount of ISM with dust can be decreased by gas consumption due to star formation in the simulated disk galaxies, but the rate of gas/dust consumption can not be rapid enough to explain the observed -evolution of dust properties. These imply that some key physics related to dust evolution is missing in the present chemodynamical simulations.
(5) Disk galaxies at show negative radial gradients of (larger in smaller radii from galaxy centers) for most models, and the gradients evolve with in luminous disk galaxies (i.e., steeper at higher ). Both and gas-phase [Fe/H] are significantly different between different local regions in an individual galaxy owing to different chemical evolution and SF histories in these regions. Dwarfs (or low-mass disk galaxies) can have dusty gaseous halo that is formed through ejection of dust due to supernova winds.
(6) Dust depletion levels estimated from gas-phase [S/Fe] and are spatially different between individual local gaseous regions of a single galaxy and between different galaxies at a given . The dust depletion levels evolve with owing to chemical and dust evolution of galaxies. These results imply that dust-to-metal-ratios should not be fixed in constructing SEDs of galaxies and predicting evolution of galaxies.
(7) The simulated disk galaxies can have very extended dusty gaseous halos with the mass fractions () as large as or larger than 0.5. This could be overestimation, because dust destruction by hot gaseous halo is not included in the present simulations. During the formation of disk galaxies, the cold gas with dust can be blown off by energetic SNF. Since less massive galaxies are more prone to such SNF, the mass fractions of halo dust are higher. The projected radial density profiles of the dusty halos are rather steep and thus inconsistent with the observed ones ().
(8) The simulated scaling relation is steeper than the observe one for low-mass galaxies with lower . The present simulations predict that galaxies with larger have larger () and () . These scaling relations can be seen already at , though they are less clear at . There is a strong correlation between and () in simulated galaxies at .
(9) The final and in disk galaxies at are larger in time-varying initial mass functions (IMFs) than in fixed ones, mainly because chemical evolution can proceed more rapidly in the time-varying IMFs. Furthermore, gas consumption rates (i.e., SFRs) and final total stellar masses are lower and smaller, respectively, in the models with the time-varying IMFs. Since the present study did not investigate the models with time-varying IMFs in detail, our future works need to confirm this importance of IMFs in the -evolution of dust and properties of galaxies.
(10) Given a number of inconsistencies between the observed and simulated dust properties of galaxies in the present study, we will need to improve the dust models and the way to incorporate the dust physics into the chemodynamical models in our future works. In particular, the models for dust accretion and destruction would need to be more sophisticated by including the time evolution of dust sizes and the locally different destruction processes of dust by SNe. The influences of stellar radiation on dust grains and dust-gas interaction in ISM are among the new ingredients that should be also included in our future more sophisticated numerical simulations of galaxy formation.
6 Acknowledgment
I (Kenji Bekki; KB) am grateful to the referee for constructive and useful comments that improved this paper. Numerical simulations reported here were carried out on the three GPU clusters, Pleiades, Fornax, and gSTAR kindly made available by International Center for radio astronomy research (ICRAR) at The University of Western Australia, iVEC, and the Center for Astrophysics and Supercomputing in the Swinburne University, respectively. This research was supported by resources awarded under the Astronomy Australia Ltd’s ASTAC scheme on Swinburne with support from the Australian government. gSTAR is funded by Swinburne and the Australian Government’s Education Investment Fund. KB is grateful to Loretta Dunne for her providing the observational data sets for dust-to-stellar-mass ratios from her observations. KB is also grateful to Cameron Yozin-Smith for his constructing a table for observational data for dust-to-gas-ratios. KB acknowledges the financial support of the Australian Research Council throughout the course of this work.
References
- (1) Andrievsky, S. M., Luck, R. E., Martin, P., & Lépine, J. R. D. 2004, A&A, 413, 159
- (2) Asano, R. S., Takeuchi, T. T., Hirashita, H., & Nozawa, T. 2013, MNRAS, 432, 637
- (3) Beelen, A., Cox, P., Benford, D. J., Dowell, C. D., Kovács, A., Bertoldi, F., Omont, A., & Carilli, C. L. 2006, ApJ, 642, 694
- (4) Bekki, K. 2013, MNRAS, 432, 2298 (B13a)
- (5) Bekki, K. 2013, MNRAS, 436, 2254 (B13b)
- (6) Bekki, K. 2013, ApJ, 779, 9 (B13c)
- (7) Bekki, K. 2014, 444, 1615
- (8) Bekki, K., & Shioya, Y. 1998, ApJ, 497, 108
- (9) Bekki, K., Shioya, Y., & Tanaka, I. 1999, ApJ, 520, L99
- (10) Bekki, K., & Chiba, M. 2000, ApJ, 534, L98
- (11) Bekki, K., & Shioya, Y. 2000, ApJ, 542, 201
- (12) Bekki, K., & Shioya, Y. 2001, ApJS, 134, 241
- (13) Bekki, K., & Meurer, G. R. 2013, ApJ, 765, L22
- (14) Bekki, K., & Tsujimoto, T. 2012, ApJ, 761, 180
- (15) Bekki, K., & Tsujimoto, T., 2014, MNRAS, 444, 3879
- (16) Bertoldi, F., Carilli, C. L., Cox, P., Fan, X., Strauss, M. A., Beelen, A., Omont, A., & Zylka, R., 2003, A&A, 406, L55
- (17) Bertschinger, E., 1995, astro-ph/9506070
- (18) Bertschinger, E., 2001, ApJS, 137, 1
- (19) Blitz, L., Fukui, Y., Kawamura, A., Leroy, A., Mizuno, N., & Rosolowsky, E. 2007, Protostars and Planets V, B. Reipurth, D. Jewitt, and K. Keil (eds.), University of Arizona Press, Tucson, 951 pp., p.81-96
- (20) Bourne, N., et al 2013, MNRAS, 436, 479
- (21) Brook, C. B., Kawata, D., Gibson, B. K., & Freeman, K. C. 2004, ApJ, 612, 894
- (22) Bruzual, G., & Charlot, S. 2003, MNRAS, 344, 1000
- (23) Calura, F., Pipino, A., & Matteucci, F. 2008, A&A, 484, 107
- (24) Christensen, C., et al., 2012, MNRAS, 425, 3058
- (25) Corbelli, E., 2012, A&A, 542, 32 (C12)
- (26) Cortese, L., et al. 2012, A&A, 540, 52
- (27) Davies, J. I. 2014, MNRAS, 438, 1922
- (28) De Cia, A., Ledoux, C., Savaglio, S., Schady, P., & Vreeswijk, P. M., 2013, A&A, 560, 88
- (29) Draine, B. T., et al., 2007, ApJ, 663, 866
- (30) Draine, B. T., Li, A., 2007, ApJ, 657, 810
- (31) Draine, B. T., et al., 2014, ApJ, 780, 172
- (32) Dunne, L., et al. 2011, MNRAS, 417, 1510 (D11)
- (33) Dwek, E., 1998, ApJ, 501, 643 (D98)
- (34) Dwek, E., & Scalo, J. M., 1979, ApJ, 233, L81
- (35) Dwek, E., & Scalo, J. M., 1980, ApJ, 239, 193
- (36) Dwek, E., Galliano, F., Jones, A. P., 2007, ApJ, 662. 927
- (37) Eales, S., et al., 2012, ApJ, 761, 168
- (38) Edmunds, M., 2001, MNRAS, 328, 223
- (39) Elbaz, D., et al. 2011, 533, 119 (E11)
- (40) Galliano, F., Dwek, E., & Chanial, P. 2008, ApJ, 672, 214
- (41) Galametz, M., Madden, S. C., Galliano, F., Hony, S., Bendo, G. J., Sauvage, M., 2011, A&A, 532, 56 (G11)
- (42) Gould, R. J., Salpeter, E. E., 1963, ApJ, 138, 393
- (43) Grootes, M. W., et al., 2013, ApJ, 766, 59
- (44) Guedes, J., Callegari, S., Madau, P., Mayer, L., 2011, ApJ, 742, 76
- (45) Hernquist, L., & Katz, N., 1989, 70, 419
- (46) Hirashita, H., 1999, ApJ, 522, 220
- (47) Hirashita, H., 2012, MNRAS, 422, 1263
- (48) Hollenbach, D., Salpeter, E. E., 1971, ApJ, 163, 155
- (49) Inoue, A. K., 2003, PASJ, 55, 901
- (50) Jones, A. P., Tielens, A. G. G. M., Hollenbach, D. J., McKee, C. F., 1994, ApJ, 433, 797
- (51) Jones, A. P., Fanciullo, L., Köhler, M., Verstraete, L., Guillet, V., Bocchio, M., Ysard, N., 2013, A&A, 558, 62
- (52) Jonsson, P., 2006, MNRAS, 372, 2
- (53) Kaneda, H. et al., 2011, PASJ, 63, 601
- (54) Kashino, D., et al. 2013, ApJ, L777
- (55) Katz, N., 1992, 391, 502
- (56) Kawata, D., Gibson, B. K., 2003, MNRAS, 340, 908
- (57) Kennicutt, R. C., Jr., 1998, ApJ, 498, 541
- (58) Komatsu, et al., 2011, ApJS, 192, 18
- (59) Kroupa, P., 2001, MNRAS, 322, 231
- (60) Krumholz, M. R., McKee, C. F., Tumlinson, J., 2009, ApJ, 693, 216
- (61) Larson, R. B., 2005, MNRAS, 359, 211
- (62) Leroy, A. K., et. al., 2011, ApJ, 737, 12
- (63) Lisenfeld, U., Ferrara, A., 1998, ApJ, 498, 145
- (64) Mannucci, F., Della Valle, M., Panagia, N., 2006, MNRAS, 370, 773
- Maoz et al. (2010) Maoz, D., Sharon, K., Gal-Yam, A., 2010, ApJ, 722, 1879
- (66) Matsuura, M., et al. 2011, Sci, 333, 1258
- (67) Mckee, C. F., 1989, in IAU Symp. 135, Interstellar Dust, Edited by Louis J. Allamandola and A. G. G. M. Tielens, p431
- (68) Meixner, M., et al. 2010, A&A, 518, L71
- (69) Ménard, B., Scranton, R., Fukugita, M., Richards, G., 2010, MNRAS, 405, 1025 (M10)
- (70) Micelotta, E. R., Jones, A. P., & Tielens, A. G. G. M. 2010, A&A, 510, 36
- (71) Micelotta, E. R., Jones, A. P., & Tielens, A. G. G. M. 2010, A&A, 510, 37
- (72) Mori, M., Yoshii, Y., Nomoto, K., 1999, ApJ, 511, 585
- (73) Nakanishi, H., Sofue, Y., 2003, PASJ, 55, 191
- (74) Nakanishi, H., Sofue, Y., 2006, PASJ, 58, 847
- (75) Norman, C. A., & Spaans, M. 1997, ApJ, 480, 145
- (76) Nozawa, T., Kozasa, T., Umeda, H., Maeda, K., Nomoto, K., 2003, ApJ, 598, 785
- (77) Ouchi, M., et al. 2013, ApJ, 778, 102
- (78) Pappalardo, C., et al., 2012, A&A, 545, 75 (P12)
- (79) Pelupessy, F. I., Papadopoulos, P. P., van der Werf, P., 2006, ApJ, 645, 1024 (P06)
- (80) Popescu, C. C., Misiriotis, A., Kylafis, N. D., Tuffs, R. J., Fischera, J., 2000, A&A, 362, 138
- (81) Rosen, A., Bregman, J. N., 1995, ApJ, 440, 634
- (82) Saintonge, A., 2011, MNRAS, 415, 61
- (83) Savage, B. D., Cardelli, J. A., Sofia, U. J., 1992, ApJ, 401, 706
- (84) Schmidt, M., 1959, ApJ, 129, 243
- (85) Schneider, R., Omukai, K., 2010, MNRAS, 402, 429
- (86) Shull, J. M., 1978, ApJ, 226, 858
- (87) Silvia, D. W., Smith, B. D., Shull, J. M., 2010, ApJ, 710, 1575
- (88) Smith, D. J. B., 2012, MNRAS, 427, 703
- (89) Steinmetz, M., Muller, E., 1995, MNRAS, 276, 549
- (90) Stinson, G., Seth, A., Katz, N., Wadsley, J., Governato, F., Quinn, T., 2006, MNRAS, 373, 1074
- (91) Susa, H., Umemura, M., 2004, ApJ, 600, 1
- (92) Sutherland, R. S., Dopita, M. A., 1993, ApJS, 88, 253
- (93) Takeuchi, T. T., Ishii, T. T., Nozawa, T., Kozasa, T., Hirashita, H., 2005, MNRAS, 362, 592
- (94) Theis, C., Orlova, N., 2004, A&A, 418, 959
- (95) Thornton, K., Gaudlitz, M., Janka, H.-Th., Steinmetz, M., 1998, ApJ, 500, 95
- (96) Tielens, A. G. G. M., 2008, ARA&A, 46, 289
- (97) Tsujimoto, T., Nomoto, K., Yoshii, Y., Hashimoto, M., Yanagida, S., & Thielemann, F.-K. 1995, MNRAS, 277, 945 (T95)
- (98) Valiante, R., Schneider, R., Maiolino, R., Salvadori, S., & Bianchi, S. 2012, MNRAS, 427, L60
- (99) van den Hoek, L. B., & Groenewegen, M. A. T. 1997, A&AS, 123, 305 (VG97)
- (100) Yozin, C., & Bekki, K. 2014, MNRAS, in press
- (101) Zhukovska, S., Gail, H.-P., & Trieloff, M. 2008, A&A, 479, 453
- (102) Zhukovska, S., & Henning, T. 2013, A&A, 555, 99
- (103) Zubko, V., Dwek, E., & Arendt, R. G. 2004, ApJS, 152, 211
| Symbol | Physical meaning |
|---|---|
| CDA | constant dust accretion (model) |
| VDA | variable dust accretion (model) |
| SNF | supernova feedback (effect) |
| dust accretion timescale | |
| dust destruction timescale | |
| a constant for dust accretion timescale (VDA) | |
| gas-phase oxygen abundances | |
| dust-to-gas-ratio | |
| mass fraction of molecular hydrogen () | |
| dust-to-metal-ratio | |
| PAH-to-dust-ratio | |
| half-mass radius of stars | |
| initial halo mass | |
| total stellar mass | |
| total gas mass | |
| total dust mass | |
| total dust mass in disk () | |
| total dust mass in halo () | |
| total PAH dust mass | |
| total mass | |
| surface dust mass density |
| Physical properties | colhead Parameter values |
|---|---|
| Cosmological parameters | WMAP 7yr |
| Total Mass aa , where and are the total masses of dark matter halo and gas in a galaxy, respectively. The gas fraction () is . | |
| Initial size bb The size of a gas sphere in a comoving coordinate. | Mpc |
| Gas fraction | |
| Spin parameter | |
| Feedback | Supernova feedback (SNF) only |
| SNF strength cc Weak SNF’ means that yr, where is the adiabatic phase of (multiple) supernova explosion. | weak |
| SNIa model dd is the binary fraction of stars that can finally explode as SNe Ia. | Prompt, |
| Chemical evolution | Non-instantaneous recycling |
| Chemical yield | T95 for SN, VG97 for AGB |
| Initial metallicity | |
| Dust accretion | Constant growth (CDA) |
| Selective dust depletion | Yes |
| Dust timescales | Gyr, Gyr |
| PAH ee is the mass fraction of PAH dust to total dust in the stellar ejecta of C-rich AGB stars. | |
| Dust yield | B13a |
| Initial dust/metal ratio | 0.1 |
| SF ff is the threshold gas density for star formation and interstellar radiation field (ISRF) is included in the estimation of mass fraction in this model. | -dependent, ISRF, cm-3 |
| IMF gg The time-varying Kroupa IMF (B13b) model is also investigated just for comparison. | Fixed Kroupa |
| Softening length | kpc, kpc |
| Gas mass resolution |
| Model/Parameters aa The model M1 corresponds to the fiducial model in which the dust and properties at can be compared with those of the MW. Accordingly, the model is also referred to as the MW model. The initial mass density of this model is defined as . The low-density model with and the high-density model with are also investigated. | () bb The initial total mass of a galaxy. | (Mpc) cc The initial size of a gas sphere in a comoving coordinate. |
|---|---|---|
| M1 | 1.59 | |
| M2 | 1.01 | |
| M3 | 0.91 | |
| M4 | 0.46 | |
| M5 | 0.30 | |
| M6 | 0.20 |
| Parameters | () | (Mpc) | aa We mainly investigate the models with , though other models with and 0.1 are investigated. | Dust growth | (Gyr) bb The variation of here is applicable only for CDA. | cc A wide range of is investigated for CDA whereas is fixed at 2 for VDA. |
|---|---|---|---|---|---|---|
| Range | CDA or VDA |
| Properties | Consistency | References | Comments |
|---|---|---|---|
| relation | G11 | Stronger SNF and VDA are required. | |
| Large dispersion in | G11 | New effects should be included. | |
| relation | C12 | Too low for low . | |
| relation | ? | Observational test is required. | |
| relation | ? | Observational test is required. | |
| Negative radial gradient | P12 | Steeper gradients in larger ? | |
| Radial gradient | ? | Different dust-to-metal ratios in ISM. | |
| Extended dusty gaseous halo | M10 | Dust halo formation is uneversal | |
| Radial profile of dusty halo | M10 | The simulated profiles are too steep. | |
| Halo dust in fainter galaxies | ? | Most dust can be outside optical radii. | |
| Evolution of | D11 | evolution should be more rapid. | |
| Evolution of | D11 | New effects should be included. | |
| -evolution of sSFR | E11 | Lower sSFR at a given and . |