INTEGRAL 11-year hard X-ray survey above 100 keV
Abstract
We present results of all sky survey, performed with data acquired by the IBIS telescope onboard the INTEGRAL observatory over eleven years of operation, at energies above 100 keV. A catalogue of detected sources includes objects. The statistical sample detected on the time-averaged keV map at a significance above contains sources: 28 AGNs, 38 LMXBs, 10 HMXBs and 12 rotation-powered young X-ray pulsars. The catalogue includes also 15 persistent sources, which were registered with the significance in hard X-rays, but at the same time were firmly detected () in the keV energy band. All sources from these two groups are known X-ray emitters, that means that the catalogue has 100% purity in respect to them. Additionally, 29 sources were found in different time intervals. In the context of the survey we present a hardness ratio of galactic and extragalactic sources, a LMXBs longitudinal asymmetry and a number-flux relation for non-blazar AGNs. At higher energies, in the keV energy band, 25 sources have been detected with a signal-to-noise ratio , including 7 AGNs, 13 LMXBs, 3 HMXBs, and 2 rotation-powered pulsars. Among LMXBs and HMXBs we identified 12 black hole candidates (BHC) and 4 neutron star (NS) binaries.
keywords:
surveys X-rays: general catalogs1 Introduction
A production of photons with energies above 100 keV requires either very high temperatures of the emitting plasma or some non-thermal mechanisms, involving highly energetic/relativistic particles. Since it is not always clear what mechanism works, this energy range is under continuous investigations both from theoretical and observational points of view.
Due to severe problems of a separation of hard X-ray photons from events, created by charged particles in hard X-ray detectors, imaging capabilities of these instruments were very limited. First hard X-ray survey of the sky was performed with scanning collimators of the A4 instrument onboard the HEAO1 observatory (Levine et al., 1984), i.e. with the instrument, which was not optimized for the image reconstruction. The next step was done with the help of the SIGMA coded mask telescope (Paul et al., 1991) onboard the GRANAT observatory (Sunyaev et al., 1990), which have provided the deepest (at that time) images of the Galactic Center region (Sunyaev et al., 1991a, b) and a large portion of the Galactic plane (Revnivtsev et al., 2004) at energies 100-200 keV.
The latest generation of hard X-ray telescopes, like IBIS onboard the INTEGRAL observatory (Winkler et al., 2003) and BAT onboard the Swift observatory (Gehrels et al., 2004), which also used the coded mask imaging method, have significantly larger effective areas and fields of view in a comparison with SIGMA. These advantages together with much larger effective operational time allowed to produce hard X-ray surveys with a significantly deeper sensitivity (Krivonos et al., 2012; Baumgartner et al., 2013).
The IBIS/INTEGRAL telescope has demonstrated a great success in surveying of the hard X-ray sky at energies above 20 keV, especially in sky areas with a high surface density of sources – near the Galactic plane and Galactic Center. While the best sensitivity of this instrument is achievable at lower energies (typically keV), the harder energy band keV might be potentially interesting due to study of a possible appearance of new mechanisms of the photons generation. In this paper we present an 11-years survey of the sky with the IBIS telescope onboard the INTEGRAL observatory at energies above 100 keV. This survey is based on the substantial extension in the exposure with respect to previous INTEGRAL hard X-ray surveys at these energies (Bazzano et al., 2006, hereinafter referred to as B06).
2 Data analysis
For the current hard X-ray survey we utilized all publicly available INTEGRAL data acquired by the IBIS telescope (Ubertini et al., 2003) between December 2002 and January 2014 (spacecraft revolutions 26-1377). The survey also contains private data from M82 deep field (PI: Sazonov), and scanning observations of the Galactic Center (PI: Krivonos) and Puppis region (PI: Tsygankov). The coded-mask telescope IBIS has a wide field of view ( fully coded) and moderate angular resolution of ′. IBIS provides a localization accuracy of 2–3′ which is sufficiently enough for the search of soft X-ray and optical counterparts and a subsequent optical classification of newly discovered hard X-ray sources. An every individual INTEGRAL observation, or so called Science Window (ScW), with a typical exposure of ks was analyzed with a specially developed software package (see e.g. Krivonos et al. 2010a; Churazov et al. 2014 and references therein) to produce sky images in four energy bands: , , , and keV. Following our previous hard X-ray survey (Krivonos et al., 2012), and to account for the ongoing detector degradation and loss of the sensitivity at low energies, the flux scale in each ScW sky image was adjusted using the flux of the Crab Nebula taken from the nearest observation.
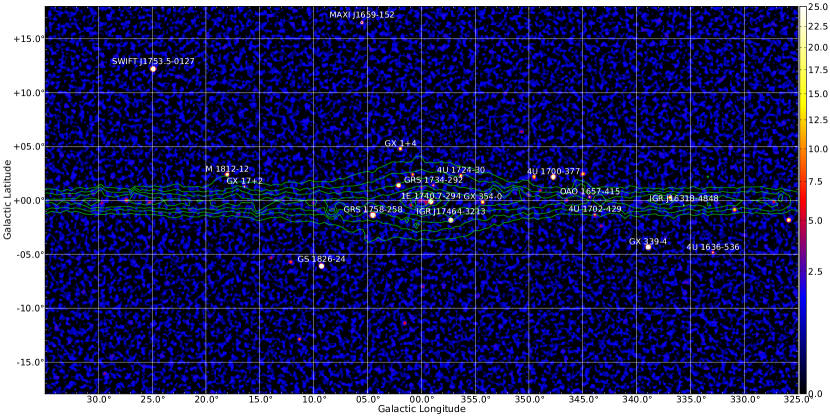
After applying selection criteria over the list of reconstructed ScW sky images, as described in Krivonos et al. (2007), we obtained 95180 ScWs in each band, which comprises Ms of the effective exposure. Individual sky images were projected onto sky frames covering the whole sky in the HEALPix reference grid (Górski et al., 2005) with 192 tiles in total. For the visualization purposes we accumulated sky mosaics in the Cartesian projection aligned with the Galactic plane as it was done for the nine-year INTEGRAL Galactic hard X-ray survey111http://hea.iki.rssi.ru/integral (Krivonos et al., 2012). Fig. 1 shows the Galactic bulge and disk map in the keV energy band.
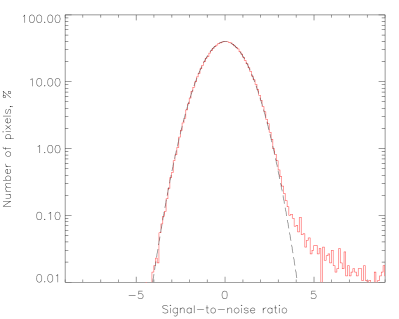
It is important to emphasize here that the sensitivity of our survey is limited by a photon statistics only and not affected by a systematic noise, which severely limits the sensitivity achievable at lower energies (see, e.g., Krivonos et al., 2010b, 2012). This fact is demonstrated in Fig. 2, where we show a signal-to-noise distribution of fluxes in pixels along with the Normal distribution representing a statistical noise. The positive tail of the distribution is formed by real source counts.
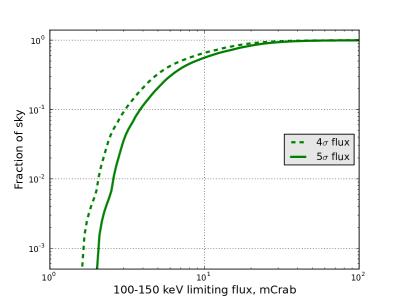
The survey sky coverage as a function of a limiting flux is shown in Fig. 3. The peak sensitivity of the survey is about 2 mCrab ( erg s-1 cm-2 in the keV energy band). The survey covers % of the sky down to the flux limit of 3.7 mCrab ( erg s-1 cm-2) and 90% of the sky at 25 mCrab ( erg s-1 cm-2). To compare our sensitivity with the previous survey conducted in this energy band by B06, we plotted also the covered sky area at a limiting flux, which was used by these authors. As a result the current survey more then doubled the covered sky area at the limiting flux of 10 mCrab: 65% sky fraction versus 27% in B06.
2.1 The average sky
The source detection has been done on each mosaic image in the reference keV energy band. The angular resolution of the IBIS telescope is , which gives independent pixels on the whole sky. In order to ensure a false detection of not more than one source at the whole sky we should adopt a detection threshold for the time-average sky if the distribution of signal-to-noise ratios is purely statistical. To check it, we divided the fluxes by errors, estimated for pure photon counting noise and analyzed this distribution for our maps. An example of such a distribution, obtained in the Galactic Center region is shown in Fig.2. Is it seen that this distribution is very close to the pure Gaussian one. With this distribution the adopted detection threshold indeed allows not more than one false detection over the whole sky. At the same time it can be seen also from Fig.2 that there exist a number of real excesses on the sky with a statistical significance in the range of .
In order to take into account (to include) such sources in the catalogue we applied a second detection criterion: the source candidate, which is registered with a signal-to-noise ratio and have a (or more) detection in the keV energy band is also included in the catalogue. The adopted ratio of in the energy ranges keV and keV approximately corresponds to the Crab-like spectrum of a source.
Using the first detection criterion () we have found 88 sources over the whole sky. Among them there are 38 low-mass X-ray binaries (LMXBs), 10 high-mass X-ray binaries (HMXBs), 28 active galactic nuclei (AGNs), and 12 of other types.
An application of the second criterion (source candidates in the range but with in the keV energy band) led to the detection of 15 additional sources of a different nature: 7 LMXBs, one HMXB, 6 AGNs, and one PWN.
It is important to note that, in contrast to the first (main) selection criterion, the second one has a more complicated selection function. Therefore only the sample will be used below for statistical analysis, e.g., for studying the AGN surface density – flux relation known as NS distribution.
It is worth to mention as well that all detected hard X-ray ( keV) sources were also registered in the softer energy band keV. This means that we have not detected objects with exotic emission mechanisms and extremely hard spectra.
SN 2014J in M82. The only counter example (and only partial, because the source under the discussion was not detected at level more than in the keV band) to this statement is the transient emission from the supernova explosion SN 2014J in the galaxy M82. This source was detected at a significance level of in the energy band keV with the highest flux at energies keV (Churazov et al., 2014) and remained undetected at energies below 100 keV. The extreme hardness of the emission of SN 2014J is a result of unusual formation of its photon spectrum. Usually photons at energies keV appear as a result of the Compton upscattering of softer seed photons on hot electrons, while in the case of the supernova explosion the hard X-ray photons diffuse from harder energy range keV as a result of the Compton downscattering on colder electrons, or produced via three-photon annihilation of positrons. Up to date only two sources with such a type of spectrum were detected over all history of the X-ray astronomy – supernova SN 1987A (Sunyaev et al., 1987) and supernova SN 2014J (Churazov et al., 2014). Another example of the Compton downscattering predicted at energies below 100 keV or so called “Compton hump” (Sunyaev & Titarchuk, 1980), has been recently observed in great detail with NuSTAR in some Compton-thick AGNs (Baloković et al., 2014).
| No. | Name | Ra | Dec | Flux | Type | Ref.1 | Notes2 |
|---|---|---|---|---|---|---|---|
| deg | deg | ||||||
| 1 | Crab | 83.63 | 22.02 | PSR/PWN | TeV J0534+220; | ||
| 2 | NGC 2110 | 88.05 | -7.46 | (5.9) | AGN | Sy2 z=0.007579; | |
| 3 | NGC 4151 | 182.63 | 39.41 | AGN | Sy1 z=0.003262; | ||
| 4 | NGC 4388 | 186.45 | 12.66 | (5.9) | AGN | Sy2 z=0.008426; | |
| 5 | 3C273 | 187.28 | 2.05 | AGN | Blazar; z=0.15834; | ||
| 6 | Cen A | 201.36 | -43.02 | AGN | Sy2 z=0.001830; | ||
| 7 | PSR B1509-58 | 228.48 | -59.14 | (8.8) | PSR | ||
| 8 | XTE J1550-564 | 237.76 | -56.46 | LMXB | 1 | BHC; | |
| 9 | 4U 1630-47 | 248.52 | -47.39 | (8.4) | LMXB | 2 | C; BHC; |
| 10 | GX 339-4 | 255.71 | -48.79 | LMXB | 3 | BHC; | |
| 11 | 4U 1700-377 | 255.98 | -37.84 | HMXB | NS; | ||
| 12 | IGR J17091-3624 | 257.29 | -36.41 | (6.5) | LMXB | 4,5,6 | C; BHC; |
| 13 | GX 354-0 | 262.99 | -33.83 | (6.6) | LMXB | burster; | |
| 14 | 1E 1740.7-294 | 265.98 | -29.73 | LMXB | 7 | C; BHC; | |
| 15 | Swift J174510.8-262411 | 266.30 | -26.40 | LMXB | 8 | BHC; | |
| 16 | IGR J17464-3213 | 266.56 | -32.23 | LMXB | 9,10 | H1743-322/XTE J1746-322; BHC; | |
| 17 | SWIFT J1753.5-0127 | 268.37 | -1.45 | LMXB | 11,12 | BHC; | |
| 18 | GRS 1758-258 | 270.30 | -25.74 | LMXB | 13 | BHC; | |
| 19 | M 1812-12 | 273.78 | -12.09 | (8.7) | LMXB | 14 | burster; |
| 20 | GS 1826-24 | 277.37 | -23.80 | LMXB | 15 | burster; | |
| 21 | GRS 1915+105 | 288.80 | 10.95 | LMXB | 16 | BHC; | |
| 22 | Cyg X-1 | 299.59 | 35.20 | HMXB | 17 | BHC; | |
| 23 | Cygnus A | 299.87 | 40.74 | (6.2) | AGN | Sy2 z=0.056146; =3C 405.0; | |
| 24 | Cyg X-3 | 308.11 | 40.96 | HMXB | 18 | BHC; | |
| 25 | 3C 454.3 | 343.49 | 16.15 | (7.2) | AGN | 19 | Blazar; z=0.859; |
1 References: (1) Smith (1998), (2) Parmar et al. (1986), (3) Samimi et al. (1979), (4) Kuulkers et al. (2003), (5) Lutovinov & Revnivtsev (2003), (6) Capitanio et al. (2006), (7) Sunyaev et al. (1991c), (8) Vovk et al. (2012), (9) Revnivtsev et al. (2003), (10) Kalemci et al. (2006), (11) Morgan et al. (2005), (12) Neustroev et al. (2014), (13) Sunyaev et al. (1991a), (14) Murakami et al. (1983), (15) Ubertini et al. (1999), (16) Greiner et al. (2001), (17) Herrero et al. (1995), (18) Schmutz, Geballe, & Schild (1996), (19) Donato, Sambruna, & Gliozzi (2005).
2The spatial confusion with another source (mostly detected at energies below keV) is indicated by sign C. Names of sources in the confusion can be found in the full online version of Table 2. The measured flux of sources being in the spatial confusion should be taken with the caution.
We also investigated a sky map in the harder energy band keV and found 25 significantly () detected sources of a different nature: 7 AGNs (one Seyfert type 1, 4 Seyfert type 2 galaxies, 2 blazars at high redshifts), 13 LMXBs, 3 HMXBs (Cyg X-1, Cyg X-3 and 4U 1700-377), and 2 rotation-powered pulsars (PSRs: Crab and PSR B1509-58). Among LMXBs and HMXBs we identified 12 black hole candidates, the neutron star binary system 4U 1700-377 and 3 X-ray bursters (GX 354-0, M 1812-12 and GS 1826-24). All these sources have been detected in the keV energy band as well and therefore present in the catalogue. Table 1 lists all the sources detected in the keV band with corresponding fluxes and source types.
2.2 Timing analysis
The sky averaged over the time period of eleven years is optimized for the detection of persistent sources, therefore, transient events or periods of a sources activity can be missed in such a survey.
In order to recover periods of the activity of transients, we measured the flux of known sources, detected in our previous surveys ( sources, see Krivonos et al. 2007, 2010b, 2012), over each spacecraft revolution (3 days). Further these data were combined into a lightcurve in order to estimate the source ratio in sliding time windows and to find periods of its significant excess.
More precisely, we averaged the source flux over all orbits in the range of , where is the current revolution and a half-width of the time window is varied from 0 to 400 orbits. It allow to cover time scales from 3 days (one orbit) to years, which is nearly half-time of the whole time span of the survey (1380 orbits or 11 years). For the source detection we applied the second detection criterion, requiring the detection in the keV energy band and the soft keV counterpart.
As a result, we found periods of the activity for 29 catalogued sources, which were not detected on the time-average map. Taking four objects with tentative classification into account, the list of transients includes 20 LMXBs, 8 HMXBs, and AGN Seyfert type 2 MRK 3, (Cotton et al., 1999). Thus, galactic sources (LMXBs and HMXBs) are the dominant among transients at energies above 100 keV.
It is interesting to note, that a number of transient HMXBs is comparable with a number of persistent sources of this class, detected above 100 keV – 8 vs 11, or %. At the same time a relative part of transient LMXBs in this energy band is significantly lower – 20 vs 45, or %. This may be due to the fact that a vast majority of transient HMXBs are X-ray pulsars (presumably in binary systems with Be stars). From time to time such objects show a strong outburst activity and despite their relatively soft spectrum become bright enough to be detected above 100 keV. Sometimes such sources demonstrate an additional hard X-ray component in their spectrum as well (see, e.g., the X-ray pulsar RX J0440.9+4431, Tsygankov et al. 2012).
3 Discussion
The sky at energies keV at our flux cut of a few mCrab is dominated by galactic sources (60 out of 88), including 38 LMXBs, 10 HMXBs and 12 PSRs. Compared to the INTEGRAL Galactic nine-year keV survey at (Krivonos et al., 2012), the number of LMXBs and HMXBs drops by a factor of and correspondingly. Such a dramatic difference is indeed expected as HMXBs have softer spectra than LMXBs. Indeed, the vast majority of high mass X-ray binaries, seen by INTEGRAL, are magnetic neutron stars, accreting matter from their binary companions (Liu et al., 2006; Lutovinov & Tsygankov, 2009; Lutovinov et al., 2013). The emergent spectra of these sources are generated by a hot plasma, heated in an accretion column near the neutron star surface (e.g. Davidson & Ostriker, 1973; Basko & Sunyaev, 1976; Nagel, 1981; Becker & Wolff, 2005), and usually demonstrate an exponential cutoff at high energies (see, e.g., White et al., 1983; Filippova et al., 2005). In several cases a hard X-ray component was found in spectra of HMXBs (see, e.g., Di Salvo et al., 1998; Barnstedt et al., 2008; Doroshenko et al., 2012; Lutovinov et al., 2012), that allows one to detect them above 100 keV in the persistent state.
An emission of low mass X-ray binaries is formed in the innermost regions of the accretion flow around typically non-magnetic sources. Extensive studies of these sources show that they demonstrate different spectral states (e.g. Esin, McClintock, & Narayan, 1997; Poutanen, Krolik, & Ryde, 1997; Barret et al., 2000; Di Salvo et al., 2000). Typically LMXBs have hard spectra (both BH and NS) during low level of their mass accretion rate and soft spectra at high mass accretion rates. The total number of LMXBs in INTEGRAL Galactic nine-year survey is mainly provided by faint sources (i.e. sources with low level of mass accretion rate). It means that their spectra are hard (harder than those of HMXBs) and thus we should expect that the ratio of number of LMXBs in 17-60 keV and 100-150 keV should be smaller than that for HMXBs.
Another class of galactic sources detected above 100 keV are rotation-powered young X-ray pulsars. They typically demonstrate hard power-law spectra with photon indexes of 1.5-2.0 at energies above 20 keV. It is widely accepted that their hard X-ray emission is dominated by the extended pulsar wind nebula (PWN) emitting synchrotron photons and Compton upscattering of softer photons on relativistic electrons (e.g. Harding, 2005). The INTEGRAL nine-year Galactic plane survey in the keV energy band contains 16 PSRs at (Krivonos et al., 2012). The current keV survey includes 13 PSRs, one of which – PSR 0540-69 – the pulsar and supernova remnant in the Large Magellanic Cloud. As a result only 4 galactic () PSRs detected in the keV energy band are below of the detection threshold in the keV energy band. Thus PSRs becomes a second dominant class of galactic hard X-ray sources (after LMXBs) above 100 keV. This clearly demonstrates that a non-thermal emission mechanisms start to play an important role at these energies.
3.1 Hardness ratio
A hardness ratio characterizes a steepness of the source spectrum and can be calculated as a ratio of a source flux in two adjacent energy bands. Assuming Crab-like spectra we converted and keV fluxes from units of mCrab to erg s-1 cm-2 and calculated their ratio. Hardness ratio histograms of different classes of sources detected with using of the first condition () are shown in Fig. 5.
Several facts can be easily seen from this figure. In particular, BHCs tend to have harder power-law slopes, than NSs in low mass X-ray binaries, which demonstrate softer spectra; PSRs have even harder spectra; non-blazar AGNs occupy a similar region to that of LMXB/BHCs; blazars are shifted in the harder domain. Hardness of HMXBs is below than that of LMXBs and AGNs, which reflects the known fact that spectra of HMXBs are softer in general (see above for details). Three known HMXB/BHCs – Cyg X-1, Cyg X-3 and SS433 are also highlighted in Fig.5. Thus, we can conclude that Fig. 5 demonstrates a gradual hardening of spectra from HMXBs through LMXBs to AGNs, and from NS to BHC. Of course one should bear in mind that all these objects are selected based on their keV flux.

3.2 LMXBs longitude asymmetry
Weidenspointner et al. (2008) reported a distinct asymmetry in the 511-keV line emission coming from the inner Galactic disk. Authors argued that this asymmetry resembles an asymmetry in the distribution of LMXBs, indicating that they may be a dominant origin of positrons (a hypothesis that subclass of LMXBs – so-called microquasars – can be responsible for the positron production was proposed, e.g., by Guessoum et al. 2006, and verified observationally by Tsygankov & Churazov 2010). Based on the INTEGRAL hard X-ray survey above keV, performed by Bird et al. (2007), Weidenspointner et al. (2008) demonstrated that a number of LMXBs at negative longitudes (45) is higher than that at positive longitudes (26) by a factor of , and at higher energies the ratio becomes even larger (B06). We investigated this LMXB asymmetry using greatly improved high-completeness hard X-ray surveys by Krivonos et al. (2012) and this work.
The 9-year Galactic survey (Krivonos et al., 2012) contains 108 LMXBs detected in the 17-60 keV band at , 37 of them are found at positive and 54 at negative longitutes (hereafter within the selection box and ), comprising the ratio . Despite the apparent excess of LMXBs right to the Galactic center (GC), the presumption against null hypothesis or symmetric distribution is rather low ().
The number of LMXBs detected with on the average keV map of the current survey at negative longitudes (19) is higher than that at positive longitudes (11) by a factor of (chance probability ). The corresponding flux-weighted ratio is lower than estimated by Weidenspointner et al. (2008) from the previous keV survey (B06). LMXBs designated as black hole candidates demonstrate a similar asymmetry at low significance ().
Compared LMXB counts on both sides from GC in and keV bands, we confirm LMXB asymmetry derived from B06, but do not see significant growth of the ratio with energy.
4 Number-flux relation (LogN–LogS)
Extragalactic population. The sample of sources detected at in the keV energy range on time-averaged sky maps contains 29 extragalactic sources. Apart from the young pulsar PSR 0540-69 in Large Magellanic Cloud all other sources are AGNs. We removed nine blazars from this AGN sample (Mrk 421, MKN 501, IGR J16562-3301, 3C 454.3, PKS 2149-306, PKS 1830-211, 3C279, PKS 1219+04 and S5 0836+71) to construct a non-blazar AGN selection and to measure their surface density over the sky. Note, that our 19 AGN sample doubles the keV AGN selection by B06, which contained 10 sources.
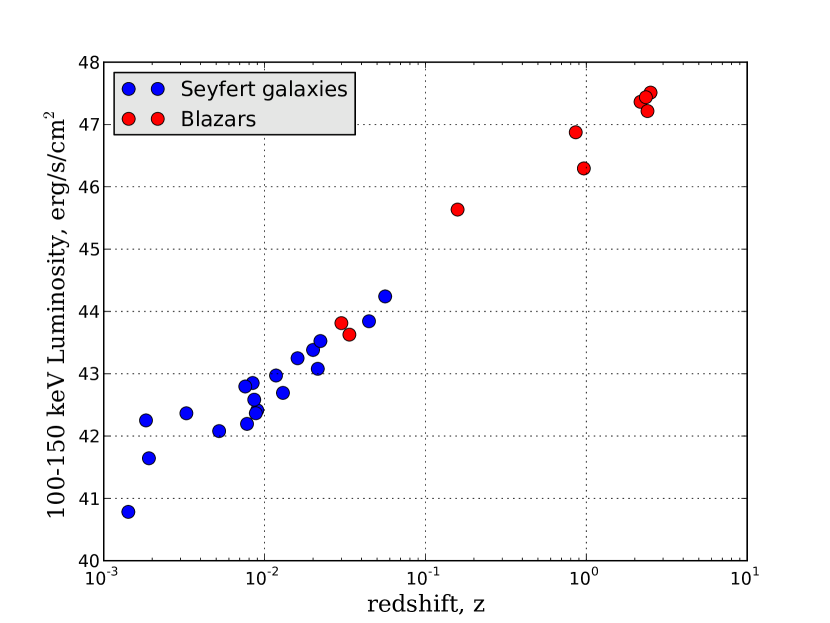
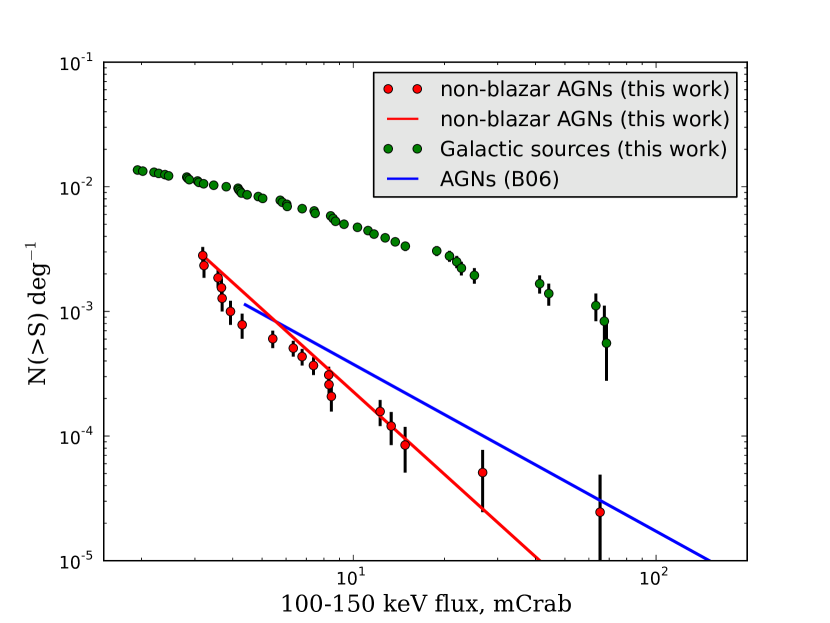
Fig. 6 shows a luminosity versus redshift diagram of the selected AGN sample. It demonstrates the fact that our AGN sample is dominated by nearby AGNs (). At the same time, we can detect very distant AGNs (mostly blazars) generating a collimated emission in the high energy domain. Some of them, namely blazar 3C273 (z=0.158), have been even detected in the keV energy band (see Table 1). The sensitivity-corrected cumulative relation for AGNs from our sample is shown in Fig. 7. This – distribution can be adequately fitted by a power law . Using a maximum-likelihood estimator (see, e.g., Jauncey, 1967; Crawford et al., 1970), we determined the best-fit values of the slope and normalization: and deg-2 at mCrab ( erg s-1 cm-2). The observed – shape doesn not look smooth and its slope is somewhat steeper than expected for the homogeneous distribution of sources in space (), which is probably caused by (i) deep field observations around known AGNs and/or (ii) deep field observations of the sky regions where nearby large scale structure can affect number-flux relation. In support of this assumption one can point out to the deep observations around 3C 273 and the Coma Cluster (Krivonos et al., 2005; Paltani et al., 2008), which are located in the region of the highest mass concentrations in the local Universe, well traced in hard X-rays by AGN spatial distribution (Krivonos et al., 2007; Ajello et al., 2012). Krivonos et al. (2007) demonstrated that nearby mass inhomogeneity can strongly affect AGN number-flux relation. Our – is also steeper than that measured by B06 (). The latter is also shown in Fig. 7 and plotted down to the flux of the weakest source in their sample (4.4 mCrab, PKS 1830-211, however removed in our AGN sample). As seen from the figure we extended the hard X-ray ( keV) – down to the flux of 3.2 mCrab (NGC 4235) or by a factor of .
AGNs with fluxes exceeding the survey detection threshold account for of the intensity of the cosmic X-ray background (CXB) in the keV band, based on the CXB spectrum of Gruber et al. (1999).
Galactic population. We constructed also a number-flux relation for galactic sources (Fig. 7). Similar to Krivonos et al. (2007), we selected sources at , ending up with 49 objects, including 30 LMXBs, 9 HMXBs, and 10 of other types. Since the population of galactic sources is not isotropically distributed in space we cannot correct the diagram for the sensitivity map in the same way as we did it for AGNs. Therefore the cumulative histogram shown in Fig. 7 is just a number of sources divided by the sky area within . This number-flux of Galactic sources is useful for easy estimates of expected number of hard X-ray sources for future surveys of the Galactic plane.
5 Catalogue of sources
The catalogue has been compiled from sources passed through detection conditions in the reference keV energy band on time-average sky maps (Sect. 2.1) and maps built over different time periods (Sect. 2.2). A sample catalogue is shown in Table 2. The text below describes columns of the catalogue table, which is also can be applied to Table 1 of sources detected in the keV energy band.
| No. | Name | Ra | Dec | Flux | Range | Type | Ref.1 | Notes |
|---|---|---|---|---|---|---|---|---|
| deg | deg | orbits | ||||||
| 1 | IGR J00291+5934 | 7.26 | 59.57 | (2.7) | LMXB | 1,2 | accreting millisecond pulsar; | |
| – | 0261 0263 | V* V1037 Cas; | ||||||
| 2 | PSR J0146+6145 | 26.59 | 61.75 | PSR | AXP; 4U 0142+61; | |||
| 3 | NGC 788 | 30.28 | -6.82 | (4.1) | AGN | Sy2 z=0.0136; | ||
| 4 | 4U 0241+61 | 41.24 | 62.46 | (5.1) | AGN | Sy1 z=0.044557; | ||
| 5 | 4U 0352+30 | 58.85 | 31.04 | HMXB | X Per; | |||
| 6 | 3C111 | 64.58 | 38.02 | (4.0) | AGN | Sy1 z=0.0485; | ||
| 7 | RX J0440.9+4431 | 70.23 | 44.56 | 0.7 | HMXB | 3 | ||
| – | (5.0) | 0963 0965 | ||||||
| 132 | 3C 454.3 | 343.49 | 16.15 | AGN | 4 | Blazar; z=0.859001; |
Column (1) “Id” – source sequence number in the catalogue.
Column (2) “Name” – source name. According to our previous hard X-ray surveys (Krivonos et al., 2007, 2010a, 2012), their common names are given for sources whose nature was known before their detection by INTEGRAL. Sources discovered by INTEGRAL or whose nature was established thanks to INTEGRAL observations are named “IGR”. The source name is highlighted by bold font if the source is significantly detected on the time-averaged map.
Columns (3,4) “RA, Dec” – source equatorial (J2000) coordinates. The positional accuracy of sources detected by IBIS depends on the source significance (Gros et al., 2003). The estimated confidence intervals for sources detected at 5–6, 10, and are ′, ′, and ′, respectively (Krivonos et al., 2007).
Column (5) “Flux” – time-averaged source flux in the keV energy band. Other energy bands – , , and keV are available only online. The flux measured at is highlighted in red. The flux with is shown as an upper limit, also in red color. If the detection significance does not exceed , it is shown in braces. The flux is expressed in units of .
Column (6) “Range” – time interval in units of spacecraft orbits, when the corresponding flux has been measured. If this column contains empty value, the flux has been determined from the whole time span of the survey. INTEGRAL orbital revolutions can be roughly converted into the Modified Julian Date (MJD) with the following empirical expression: .
Column (8) “Type” – general astrophysical type of the object: LMXB (HMXB) – low- (high-) mass X-ray binary, AGN – active galactic nucleus, SNR – supernova remnant, PSR – isolated pulsar or pulsar wind nebula (PWN), SGR – soft gamma repeater. A type in blue with a question mark indicates that the specified type is not firmly determined and should be confirmed.
6 Summary
In this paper we have presented the catalogue of hard X-ray sources detected in the keV all-sky survey performed by the INTEGRAL observatory over 11 years of operation. The current survey significantly improves our knowledge about a high energy sky compared to previous survey conducted by Bazzano et al. (2006). Our catalogue contains sources detected both on time-averaged sky maps – optimized mostly for persistent sources, and in different time intervals – preferential for transients. The survey has 100% purity for persistent sources, while the list of transients contains objects with tentative classification (4). Summary of source types over different detection conditions is presented in Table 3.
| Time | Total | |||
|---|---|---|---|---|
| LMXB | 38 | 7 | 20 | 65 |
| HMXB | 10 | 1 | 8 | 19 |
| PSR | 12 | 1 | 0 | 13 |
| AGN | 28 | 6 | 1 | 35 |
| Total | 88 | 15 | 29 | 132 |
The survey is dominated by 97 hard X-ray sources of the galactic origin (mainly, LMXBs and HMXBs – in total 83), in comparison with the extragalactic source population represented by 35 AGNs.
We provided hardness ratio ( keV/ keV) histograms for different source classes, showing a gradual hardening of spectra from HMXBs and LMXBs through PSRs to AGNs, and from NS to BHC (Sect. 3.1).
We characterized the keV non-blazar AGN population, collected from the survey, by the redshift-luminosity diagram and number-flux relation based on 19 AGNs. Obtained results is compared to that published by Bazzano et al. (2006) and show that our – is extended down to fainter fluxes by a factor of 1.4 and have a steeper slope.
The hard X-ray flux from the non-blazar AGN sample at accounts for of the CXB intensity in the keV energy band.
Acknowledgments
Research is based on observations with INTEGRAL, an ESA project with instruments and science data centre funded by ESA member states (especially the PI countries: Denmark, France, Germany, Italy, Switzerland, Spain), Czech Republic and Poland, and with the participation of Russia and the USA. Research has made use of data obtained through the High Energy Astrophysics Science Archive Research Center Online Service, provided by the NASA/Goddard Space Flight Center. Authors thank Max Planck Institute fuer Astrophysik for computational support. The work was supported by grant of Russian Science Foundation 14-22-00271.
References
- Ajello et al. (2012) Ajello, M., Alexander, D. M., Greiner, J., et al. 2012, ApJ, 749, 21
- Baloković et al. (2014) Baloković, M., Comastri, A., Harrison, F. A., et al. 2014, ApJ, 794, 111
- Barnstedt et al. (2008) Barnstedt J., et al. 2008, A&A, 486, 293
- Barret et al. (2000) Barret D., Olive J. F., Boirin L., Done C., Skinner G. K., Grindlay J. E., 2000, ApJ, 533, 329
- Basko & Sunyaev (1976) Basko M. M., Sunyaev R. A., 1976, MNRAS, 175, 395
- Baumgartner et al. (2013) Baumgartner W. H., Tueller J., Markwardt C. B., Skinner G. K., Barthelmy S., Mushotzky R. F., Evans P. A., Gehrels N., 2013, ApJS, 207, 19
- Bazzano et al. (2006) Bazzano, A., Stephen, J. B., Fiocchi, M., et al. 2006, ApJ, Letters, 649, L9
- Becker & Wolff (2005) Becker P. A., Wolff M. T., 2005, ApJ, 630, 465
- Bird et al. (2007) Bird, A. J., Malizia, A., Bazzano, A., et al. 2007, ApJ, Supplement, 170, 175
- Capitanio et al. (2006) Capitanio F., et al., 2006, ApJ, 643, 376
- Churazov et al. (2014) Churazov, E., Sunyaev, R., Isern, J., et al. 2014, Nature, 512, 406
- Cotton et al. (1999) Cotton, W. D., Condon, J. J., & Arbizzani, E. 1999, ApJ, Supplement, 125, 409
- Crawford et al. (1970) Crawford, D. F., Jauncey, D. L., & Murdoch, H. S. 1970, ApJ, 162, 405
- Davidson & Ostriker (1973) Davidson K., Ostriker J. P., 1973, ApJ, 179, 585
- Di Salvo et al. (1998) Di Salvo T., Burderi L., Robba N., Guainazzi M. 1998, ApJ, 509, 897
- Di Salvo et al. (2000) Di Salvo T., et al., 2000, ApJ, 544, L119
- Donato, Sambruna, & Gliozzi (2005) Donato D., Sambruna R. M., Gliozzi M., 2005, A&A, 433, 1163
- Doroshenko et al. (2012) Doroshenko V., Santangelo A., Kreykenbohm I., Doroshenko R. 2012, A&A, 540, L1
- Eckert et al. (2004) Eckert D., Walter R., Kretschmar P., Mas-Hesse M., Palumbo G. G. C., Roques J.-P., Ubertini P., Winkler C., 2004, ATel, 352, 1
- Esin, McClintock, & Narayan (1997) Esin A. A., McClintock J. E., Narayan R., 1997, ApJ, 489, 865
- Filippova et al. (2005) Filippova E.V., Tsygankov S.S., Lutovinov A.A., Sunyaev R.A. 2005, Astron. Lett. 31, 729
- Gehrels et al. (2004) Gehrels N., et al., 2004, ApJ, 611, 1005
- Greiner et al. (2001) Greiner J., Cuby J. G., McCaughrean M. J., Castro-Tirado A. J., Mennickent R. E., 2001, A&A, 373, L37
- Gros et al. (2003) Gros, A., Goldwurm, A., Cadolle-Bel, M., Goldoni, P., Rodriguez, J., Foschini, L., Del Santo, M., & Blay, P. 2003, A&A, 411, L179
- Gruber et al. (1999) Gruber, D. E., Matteson, J. L., Peterson, L. E., & Jung, G. V. 1999, ApJ, 520, 124
- Guessoum et al. (2006) Guessoum, N., Jean, P., & Prantzos, N. 2006, A&A, 457, 753
- Górski et al. (2005) Górski, K. M., Hivon, E., Banday, A. J., et al. 2005, ApJ, 622, 759
- Harding (2005) Harding A. K., 2005, AIPC, 745, 105
- Herrero et al. (1995) Herrero A., Kudritzki R. P., Gabler R., Vilchez J. M., Gabler A., 1995, A&A, 297, 556
- Jauncey (1967) Jauncey, D. L. 1967, Nature, 216, 877
- Kalemci et al. (2006) Kalemci E., Tomsick J. A., Rothschild R. E., Pottschmidt K., Corbel S., Kaaret P., 2006, ApJ, 639, 340
- Krivonos et al. (2005) Krivonos, R., Vikhlinin, A., Churazov, E., et al. 2005, ApJ, 625, 89
- Krivonos et al. (2007) Krivonos, R., Revnivtsev, M., Lutovinov, A., et al. 2007, A&A, 475, 775
- Krivonos et al. (2010a) Krivonos, R., Revnivtsev, M., Tsygankov, S., et al. 2010a, A&A, 519, A107
- Krivonos et al. (2010b) Krivonos, R., Tsygankov, S., Revnivtsev, M., et al. 2010b, A&A, 523, A61
- Krivonos et al. (2012) Krivonos, R., Tsygankov, S., Lutovinov, A., et al. 2012, A&A, 545, A27
- Kuulkers et al. (2003) Kuulkers E., Lutovinov A., Parmar A., Capitanio F., Mowlavi N., Hermsen W., 2003, ATel, 149, 1
- Levine et al. (1984) Levine A. M., et al., 1984, ApJS, 54, 581
- Liu et al. (2006) Liu, Q. Z., van Paradijs, J., & van den Heuvel, E. P. J. 2006, A&A, 455, 1165
- Lutovinov & Revnivtsev (2003) Lutovinov A. A., Revnivtsev M. G., 2003, AstL, 29, 719
- Lutovinov & Tsygankov (2009) Lutovinov, A., & Tsygankov, S. 2009, The Extreme Sky: Sampling the Universe above 10 keV, 10
- Lutovinov et al. (2012) Lutovinov, A., Tsygankov, S., Chernyakova, M. 2012, MNRAS, 423, 1978
- Lutovinov et al. (2013) Lutovinov, A. A., Revnivtsev, M. G., Tsygankov, S. S., & Krivonos, R. A. 2013, MNRAS, 431, 327
- Markwardt, Swank, & Strohmayer (2004) Markwardt C. B., Swank J. H., Strohmayer T. E., 2004, ATel, 353, 1
- Morgan et al. (2005) Morgan, E., Swank, J., Markwardt, C., & Gehrels, N. 2005, The Astronomer’s Telegram, 550, 1
- Murakami et al. (1983) Murakami T., et al., 1983, PASJ, 35, 531
- Nagel (1981) Nagel W., 1981, ApJ, 251, 278
- Neustroev et al. (2014) Neustroev, V. V., Veledina, A., Poutanen, J., et al. 2014, MNRAS, 445, 2424
- Paltani et al. (2008) Paltani, S., Walter, R., McHardy, I. M., et al. 2008, A&A, 485, 707
- Parmar et al. (1986) Parmar A. N., White N. E., Giommi P., Gottwald M., 1986, ApJ, 308, 199
- Paul et al. (1991) Paul J., et al., 1991, AdSpR, 11, 289
- Poutanen, Krolik, & Ryde (1997) Poutanen J., Krolik J. H., Ryde F., 1997, MNRAS, 292, L21
- Reig & Roche (1999) Reig P., Roche P., 1999, MNRAS, 306, 100
- Revnivtsev et al. (2003) Revnivtsev M., Chernyakova M., Capitanio F., Westergaard N. J., Shoenfelder V., Gehrels N., Winkler C., 2003, ATel, 132, 1
- Revnivtsev et al. (2004) Revnivtsev M. G., Sunyaev R. A., Gilfanov M. R., Churazov E. M., Goldwurm A., Paul J., Mandrou P., Roques J. P., 2004, AstL, 30, 527
- Samimi et al. (1979) Samimi J., et al., 1979, Natur, 278, 434
- Schmutz, Geballe, & Schild (1996) Schmutz W., Geballe T. R., Schild H., 1996, A&A, 311, L25
- Smith (1998) Smith D. A., 1998, IAUC, 7008, 1
- Sunyaev & Titarchuk (1980) Sunyaev, R. A., & Titarchuk, L. G. 1980, A&A, 86, 121
- Sunyaev et al. (1987) Sunyaev, R., Kaniovsky, A., Efremov, V., et al. 1987, Nature, 330, 227
- Sunyaev et al. (1990) Sunyaev R. A., Babichenko S. I., Goganov D. A., Tabaldyev S. R., Iamburenko N. S., 1990, AdSpR, 10, 233
- Sunyaev et al. (1991a) Sunyaev R., et al., 1991a, A&A, 247, L29
- Sunyaev et al. (1991b) Sunyaev R. A., et al., 1991b, AdSpR, 11, 177
- Sunyaev et al. (1991c) Sunyaev R., et al., 1991c, SvAL, 17, 54
- Tsygankov & Churazov (2010) Tsygankov, S., Churazov E. 2010, Astron. Lett, 36, 237
- Tsygankov et al. (2012) Tsygankov, S., Krivonos, R., Lutovinov, A. 2012, MNRAS, 421, 2407
- Ubertini et al. (1999) Ubertini P., Bazzano A., Cocchi M., Natalucci L., Heise J., Muller J. M., in ’t Zand J. J. M., 1999, ApJ, 514, L27
- Ubertini et al. (2003) Ubertini, P., Lebrun, F., Di Cocco, G., et al. 2003, A&A, 411, L131
- Vovk et al. (2012) Vovk I., et al., 2012, ATel, 4381, 1
- Weidenspointner et al. (2008) Weidenspointner, G., Skinner, G., Jean, P., et al. 2008, Nature, 451, 159
- White et al. (1983) White N.E., Swank J.H., Holt S.S. 1983, ApJ, 270, 711
- Winkler et al. (2003) Winkler C., et al., 2003, A&A, 411, L1