PHENIX Collaboration
Systematic Study of Azimuthal Anisotropy in CuCu and AuAu Collisions at =62.4 and 200 GeV
Abstract
We have studied the dependence of azimuthal anisotropy for inclusive and identified charged hadrons in AuAu and CuCu collisions on collision energy, species, and centrality. The values of as a function of transverse momentum and centrality in AuAu collisions at =200 GeV and 62.4 GeV are the same within uncertainties. However, in CuCu collisions we observe a decrease in values as the collision energy is reduced from 200 to 62.4 GeV. The decrease is larger in the more peripheral collisions. By examining both AuAu and CuCu collisions we find that depends both on eccentricity and the number of participants, . We observe that divided by eccentricity () monotonically increases with and scales as . The CuCu data at 62.4 GeV falls below the other scaled data. For identified hadrons, divided by the number of constituent quarks is independent of hadron species as a function of transverse kinetic energy between GeV. Combining all of the above scaling and normalizations, we observe a near-universal scaling, with the exception of the CuCu data at 62.4 GeV, of vs for all measured particles.
pacs:
25.75.DwI Introduction
The azimuthal anisotropy of particles produced in relativistic heavy ion collisions is a powerful probe for investigating the characteristics of the quark-gluon plasma (QGP) Adcox et al. (2005); Adams et al. (2005); Back et al. (2005); Arsene et al. (2005). The elliptic azimuthal anisotropy () is defined by the amplitude of the second-order harmonic in a Fourier series expansion of emitted particle azimuthal distributions:
| (1) |
where represents the azimuthal emission angle of a particle and is the azimuthal angle of the reaction plane, which is defined by the impact parameter and the beam axis. The brackets denote statistical averaging over particles and events. Elliptic flow is sensitive to the early stage of heavy ion collisions because pressure gradients transfer the initial geometrical anisotropy of the collision region to an anisotropy in momentum space.
One of the most remarkable findings at the Relativistic Heavy Ion Collider (RHIC) is that the strength of Adler et al. (2003) is much larger than what is expected from a hadronic scenario Bleicher and Stoecker (2002). Moreover, a scaling of by the number of constituent quarks in a hadron in the intermediate transverse momentum region ( - GeV) has been found for a broad range of particle species produced in AuAu at =200 GeV Adare et al. (2007, 2012). Both STAR and PHENIX experiments have observed that scales better as a function of the transverse kinetic energy of the hadron. These scalings of are consistent with constituent quark flow at early collision times and recombination as the dominant process of hadronization.
The detailed interpretation of results requires modeling Heinz and Snellings (2013); Ollitrault (1992) of the wavefunction of the incoming nuclei, fluctuations of the initial geometry, viscous relativistic hydrodynamics, hadronic freeze out and subsequent rescattering, along with various model parameters such as the assumed equation of state and transport coefficients, e.g. viscosity. In recent calculations, the strength of for hadrons in heavy ion collisions at = 200 GeV can be reproduced by hydrodynamical models that include shear viscosity and initial fluctuations Niemi et al. (2012); Song et al. ; Soltz et al. (2013).
At the LHC, experiments have measured as a function of from PbPb collisions at an order of magnitude higher beam energy, at = 2.76 TeV Aamodt et al. (2010); Aad et al. (2012); Chatrchyan et al. (2013a). These results as a function of for inclusive hadrons are very similar in magnitude and shape to the RHIC measurements at 200 GeV. However, the measurements for identified hadrons at LHC Abelev et al. (2013, ) below 3 GeV/ do not scale well with the quark number and transverse kinetic energy of the hadron with deviations up to 40%.
A comparison of measured at the lower beam energies at RHIC ( = 7.7–200 GeV) shows that as a function of seems to be saturated above GeV and decreases below this beam energy Adamczyk et al. (2013). The scaling of with transverse kinetic energy is broken below a beam energy of 19 GeV Adamczyk et al. (2013). Possible explanations for this behavior include rescattering in the later hadronic phase, incomplete thermalization in the initial stage, or the plasma not being formed at these lower beam energies.
Because transverse kinetic energy scaling is broken at energies significantly lower and higher than RHIC’s full energy of 200 GeV, it is important to provide systematic measurements of for identified hadrons as a function of system size, collision energy, and centrality. These systematics are needed in order to make progress on the nature of the QGP at lower energy-density. We report on such a set of measurements in this paper, examining both AuAu and CuCu collisions at 200 GeV and 62.4 GeV beam energies. This adds to the low-energy AuAu measurements made by STAR Adamczyk et al. (2013) and their CuCu data at 200 GeV and 62.4 GeV beam energies Abelev et al. (2010). The system size dependence of flow is particularly important because long-range azimuthal correlations have also been observed in high-multiplicity events from much smaller systems such as Au collisions Adare et al. (2013) at RHIC, Khachatryan et al. (2010), and Pb collisions Chatrchyan et al. (2013b) at LHC. The origin of these anisotropies is currently unknown; various competing explanations include parton saturation and hydrodynamic flow.
We expect that the systematic study of for inclusive and identified particles can provide information on the temperature dependence of s (i.e. the ratio of shear viscosity to entropy density s), the impact of viscosity on systems of different sizes, as well as constraining models of the reaction dynamics.
The organization of this paper is as follows: Section II describes the PHENIX detector used for this analysis, Section III describes the experimental method of azimuthal anisotropy analysis, Section IV presents the results of the systematic study for inclusive charged hadron , and Section V presents the results of the systematic study for the of identified charged hadrons. The new data published in this paper are the CuCu data at 62.4 GeV, as well the AuAu results for GeV/. Other data come from prior PHENIX publications. Afanasiev et al. (2009a); Adare et al. (2007)
II PHENIX DETECTOR
The results that we present in this paper were obtained with the PHENIX detector at RHIC Adcox et al. (2003a). We discuss below the main detector components that were used for this analysis.

II.1 Global Detectors
The Beam-Beam Counters (BBCs) are located 144 cm upstream and downstream of the beam crossing point. Each BBC comprises 64 individual quartz Čerenkov counters and covers the full azimuthal angle in the pseudorapidity range . The average of the times measured by the two BBCs from fast leading particles provide the start time for the event, while the difference in times provides the vertex position of the collision. The timing and position resolution of the BBCs are 20 ps and 0.6 cm respectively for both AuAu and CuCu collisions. The event start time is also used for particle identification through the time-of-flight to the TOF and EMCal subsystems in the PHENIX central arms.
The Zero Degree Calorimeters (ZDCs) cover the pseudorapidity range and measure the energy of spectator neutrons with an energy resolution of approximately 20%. More details about these detectors can be found in Aizawa et al. (2003).
II.2 Central-arm tracking detectors
Two (identical) Drift Chambers (DC) are installed in the east and west arms of the PHENIX central detector and are located between 2.02 and 2.46 m radial distance from the interaction point. Each of the two drift chambers extends 180 cm along the beam direction and subtends /2 in azimuth. The momentum resolution for tracks reconstructed by the DC is 0.7%1.1% (GeV/). The position of the DCs relative to the other detectors in the central spectrometer is shown in Fig. 1 and details of the DC construction and tracking performance can be found in Adcox et al. (2003b).
The PHENIX pad chambers (PC) are multi-wire proportional chambers composed of three separate layers of pixel detectors. Each pad chamber detector contains a single plane of wires in a gas volume bounded by two cathode planes.The innermost pad chamber plane, PC1, is located between the DC and a ring-imaging Čerenkov counter (RICH) on both East and West arms, PC2 is placed in back of the RICH on the West arm only, and PC3 is located in front of the Electromagnetic Calorimeters on both East and West arms.
The PC system determines space points outside the magnetic field and hence provides straight-line particle trajectories. They are the only nonprojective detectors in the central tracking system and thus are critical elements of the pattern recognition. PC1 is also essential for determining the three-dimensional momentum vector by providing the coordinate of each track at the exit of the DC. Details of the PC construction and their performance can be found in Adcox et al. (2003b).
II.3 Time-of-flight counters
The PHENIX time-of-flight (TOF) detector serves as a particle identification device for charged hadrons. The time resolution for the BBC-TOF system is around 120 ps, which enables 2 separation of /K up to 2.0 GeV/. The length of the flight path of each track from the event vertex to the TOF detector is calculated by the momentum reconstruction algorithm. The length and time of flight are combined to identify the charged particles. The TOF is located between the PC3 and EMCal in the east arm and about 5.06 m away from the collision vertex. It covers 0.35 and azimuthal angle, = 45∘. Details of the TOF construction and performance can be found in Aizawa et al. (2003).
II.4 Electromagnetic calorimeter
The PHENIX EMCal was designed to measure the spatial position and energy of electrons and photons produced in heavy ion collisions. The EMCal covers the full central spectrometer acceptance of 0.35 and is installed in both arms, each subtending in azimuth, i.e. larger than the TOF acceptance. The EMCal comprises six sectors of lead-scintillator (PbSc) calorimeters and two sectors of lead-glass (PbGl) calorimeters. The PbGl is not used in this analysis, but we note that the TOF detector is in front of the PbGl so no PID coverage is lost. The PbSc is a sampling calorimeter and has a timing resolution of 400 ps for hadrons. The PbSc can be used to separate / with 2 up to 1.0 GeV/. Details of the PbSc construction and performance are described in Aphecetche et al. (2003).
II.5 RICH
A Ring Imaging Čerenkov Counter (RICH) is installed on each of the PHENIX central arms. Each RICH detector is a threshold gas Čerenkov detector with a high angular segmentation filled with CO2 gas. In this analysis we use the RICH to reject electrons by removing tracks that match to a RICH ring. It is noted that charged pions with larger than 4 GeV/ also radiate in the CO2 gas.
III experimental method
III.1 Data sets and event selection
We measured CuCu and AuAu collisions at = 62.4 and 200 GeV. The CuCu data were taken during RHIC Run-5 (2005) and AuAu data were taken during RHIC Run-4 (2004) running periods. We used a minimum bias trigger that was defined by a coincidence between the two BBCs and an energy threshold of one neutron in both ZDCs. The collision vertex along the beam direction, , was measured by the BBC. The total number of minimum bias events that were analyzed after requiring an offline vertex cut of cm and selecting good runs are listed in Table 1.
| Year | Species | Energy [GeV] | # of events |
|---|---|---|---|
| 2004 | AuAu | 200 | |
| 2004 | AuAu | 62.4 | |
| 2005 | CuCu | 200 | |
| 2005 | CuCu | 62.4 |
In AuAu collisions at 200 GeV the centrality of the collision was determined by using the correlation of the total energy deposited in the ZDCs with the total charge deposited in the BBCs, as described in Adler et al. (2005). However, in 200 GeV CuCu, 62.4 GeV CuCu, and 62.4 GeV AuAu collisions, the resolving power of the ZDCs is insufficient to significantly contribute to the centrality definition. Therefore, the total charge deposited in the BBCs is used to determine centrality in these collision systems, as described in Adler et al. (2005). A Glauber model Monte-Carlo simulation of the each collision Alver et al. (2007); Miller et al. (2007) was used to estimate the average number of participating nucleons and participant eccentricity (). This simulation includes modeling of the BBC and ZDC response. The eccentricty is also known as the participant eccentricity and includes the effect of fluctuation from the initial participant geometry. Table 2 summarizes , its systematic uncertainties (), and its systematic uncertainties ().
| centrality | AuAu 200 GeV | AuAu 62.4 GeV | CuCu 200 GeV | CuCu 62.4 GeV | ||||||||||||
|---|---|---|---|---|---|---|---|---|---|---|---|---|---|---|---|---|
| bin | [%] | [%] | [%] | [%] | ||||||||||||
| 0%–10% | 325.2 | 3.3 | 0.103 | 2.6 | 320.7 | 7.9 | 0.107 | 2.3 | 98.2 | 2.4 | 0.163 | 2.0 | 93.3 | 2.6 | 0.169 | 1.7 |
| 10%–20% | 234.6 | 4.7 | 0.200 | 2.5 | 230.7 | 9.2 | 0.207 | 2.2 | 73.6 | 2.5 | 0.241 | 3.0 | 71.1 | 2.4 | 0.248 | 2.6 |
| 20%–30% | 166.6 | 5.4 | 0.284 | 2.1 | 163.2 | 7.6 | 0.292 | 2.0 | 53.0 | 1.9 | 0.317 | 1.9 | 51.3 | 2.0 | 0.324 | 1.9 |
| 30%–40% | 114.2 | 4.4 | 0.356 | 1.7 | 113.0 | 5.6 | 0.365 | 1.8 | 37.3 | 1.6 | 0.401 | 1.9 | 36.2 | 1.8 | 0.408 | 1.6 |
| 40%–50% | 74.4 | 3.8 | 0.422 | 1.5 | 74.5 | 4.1 | 0.431 | 1.3 | 25.4 | 1.3 | 0.484 | 1.6 | 24.9 | 1.5 | 0.494 | 2.1 |
| 50%–60% | 45.5 | 3.3 | 0.491 | 1.1 | 45.9 | 3.1 | 0.498 | 1.0 | 16.7 | 0.9 | 0.579 | 1.4 | 16.1 | 0.9 | 0.587 | 1.5 |
| 60%–70% | 25.7 | 3.8 | 0.567 | 0.7 | 25.9 | 1.7 | 0.573 | 0.8 | 10.4 | 0.6 | 0.674 | 2.1 | 0.696 | 2.3 | ||
| 70%–80% | 13.4 | 3.0 | 0.666 | 1.2 | 0.678 | 1.1 | 6.4 | 0.5 | 0.721 | 1.7 | 0.742 | 1.6 | ||||
| 80%–90% | 0.726 | 2.8 | 0.740 | 2.2 | 0.856 | 7.2 | 0.867 | 6.2 | ||||||||
III.2 Track selection
The analysis was performed for inclusive charged hadrons over the transverse momentum range GeV/, and for identified charged particles (pions (), kaons (), and protons ()) in the momentum range up to 2.2, 3, and 4 GeV/ respectively.
The track reconstruction procedure is described in Mitchell et al. (2002). Tracks reconstructed by the DC which do not originate from the event vertex have been investigated as background to the inclusive charged particle measurement. The main background sources include secondary particles from hadron decays and pairs from the conversion of photons in the material between the vertex and the DC Adler et al. (2004). To minimize background originating from the magnets, reconstructed tracks are required to have a -position less than cm when the tracks cross the outer radius of the DC. The DC is outside the central magnet field hence we can approximate reconstructed tracks through the central-arm detectors as straight lines. This enables tracks to be projected to outer detectors and matched to measured hits. Good tracks are required to be matched to a hit in the PC3, as well as in the EMCal, within 2.5 of the expected hit location in both azimuthal and beam directions.
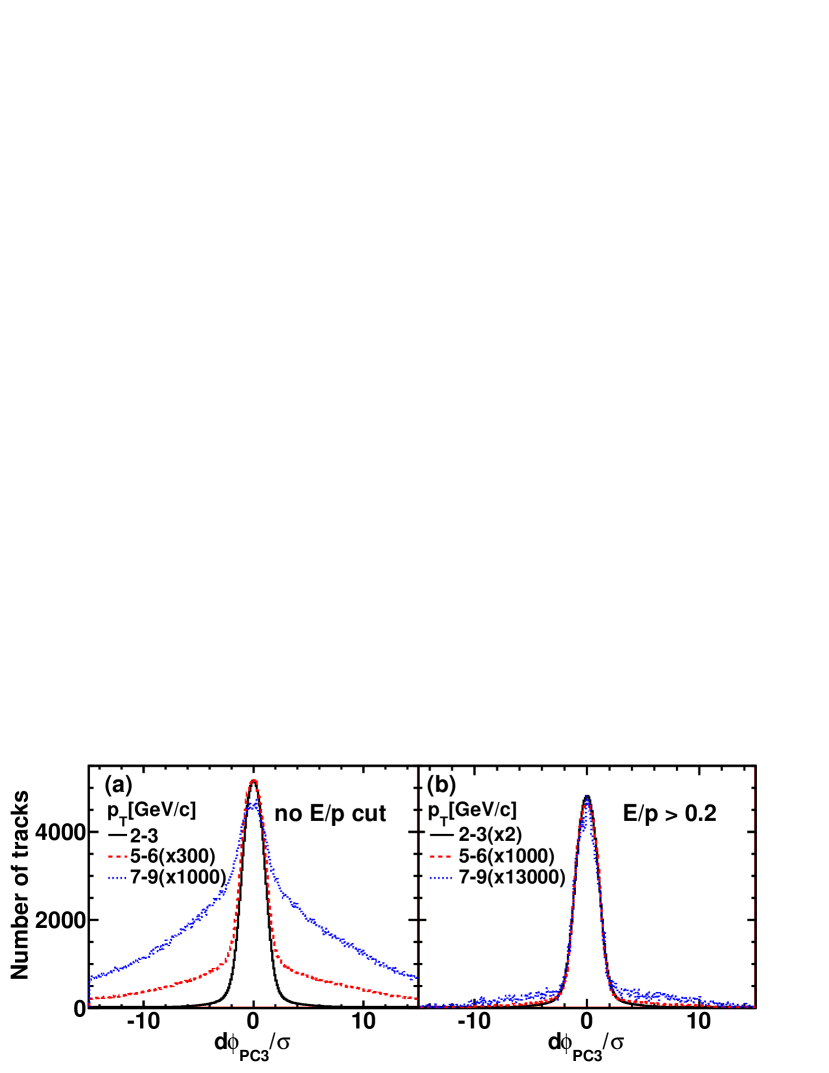
The Ring Imaging erenkov detector (RICH) also reduces the conversion background. For tracks with 4 GeV/ we apply a cut of where is the number of fired phototubes in the RICH ring. For 4 GeV/, we require tracks to have 0.2, where denotes the energy deposited in the EMCal and is the transverse momentum of particles measured in the DC. Because most of the background from photon conversion are low-momentum particles that were incorrectly reconstructed at higher momentum, when we require a large deposit of energy in the EMCal this suppresses the conversion background Adler et al. (2006).
To demonstrate the effectiveness of the cut, Fig. 2 shows the track/hit matching distributions at PC3, where is the residual between the track projection point and the detector hit position along and is the standard deviation of the distribution. The left panel shows the without an / cut, and the right panel shows the distribution with a cut of . Note that the vertical scale between the panels is different. The / 0.2 cut substantially reduces the background for high tracks. The residual background remaining after these cuts has been estimated by the fitting the distributions in PC3 with a double Gaussian function (signal and background). The signal and residual background distributions are required to have the same mean. For 4 GeV/ the residual background is less than 5% of the real tracks and reaches 10% for 8-10 GeV/. The efficiency of the cut is 0.3 at GeV/ and 0.1 at GeV/.
III.3 Particle identification
For identified charged hadrons we also require the tracks to have a hit in the TOF detector or EMCal within at most 2 of the expected hit location in both azimuthal and beam directions. Particles are identified by their mass-squared, using the momentum measurement from the DC (), time-of-flight between BBC and TOF/EMCal (), and flight path length () from the collision vertex point to the hit position on the TOF wall or cluster in the EMCal. The square of the particle’s mass is calculated as
| (2) |
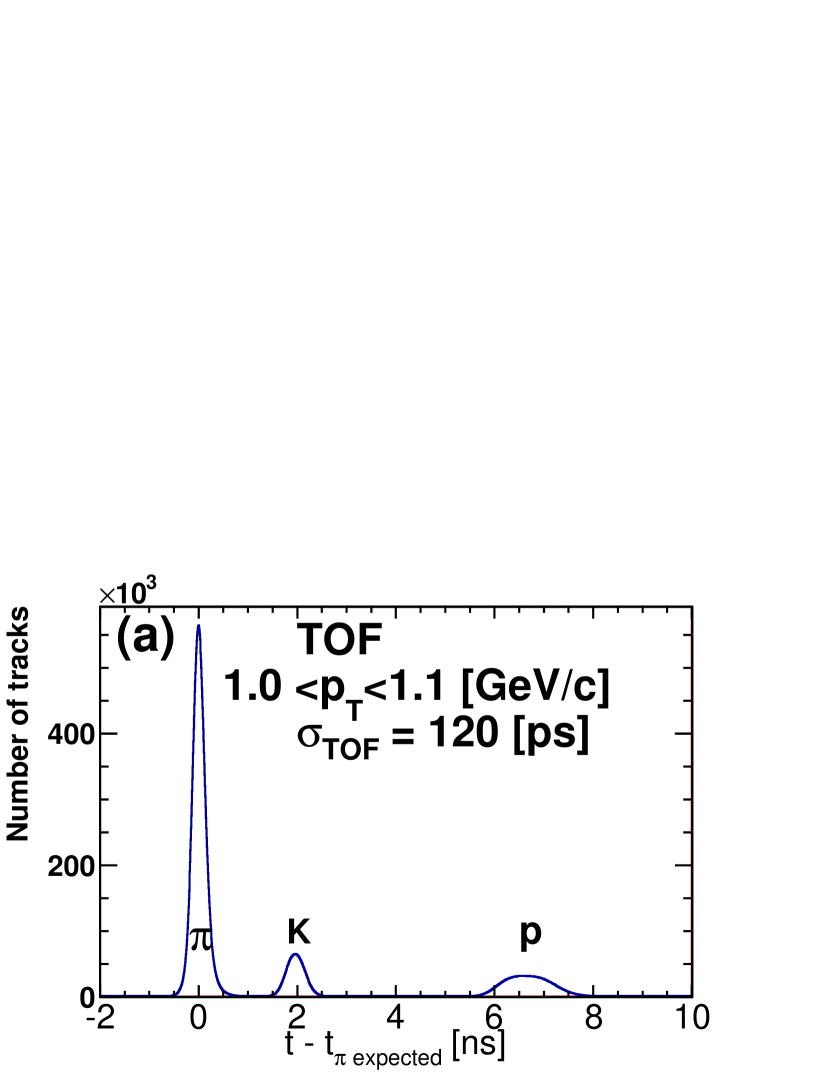
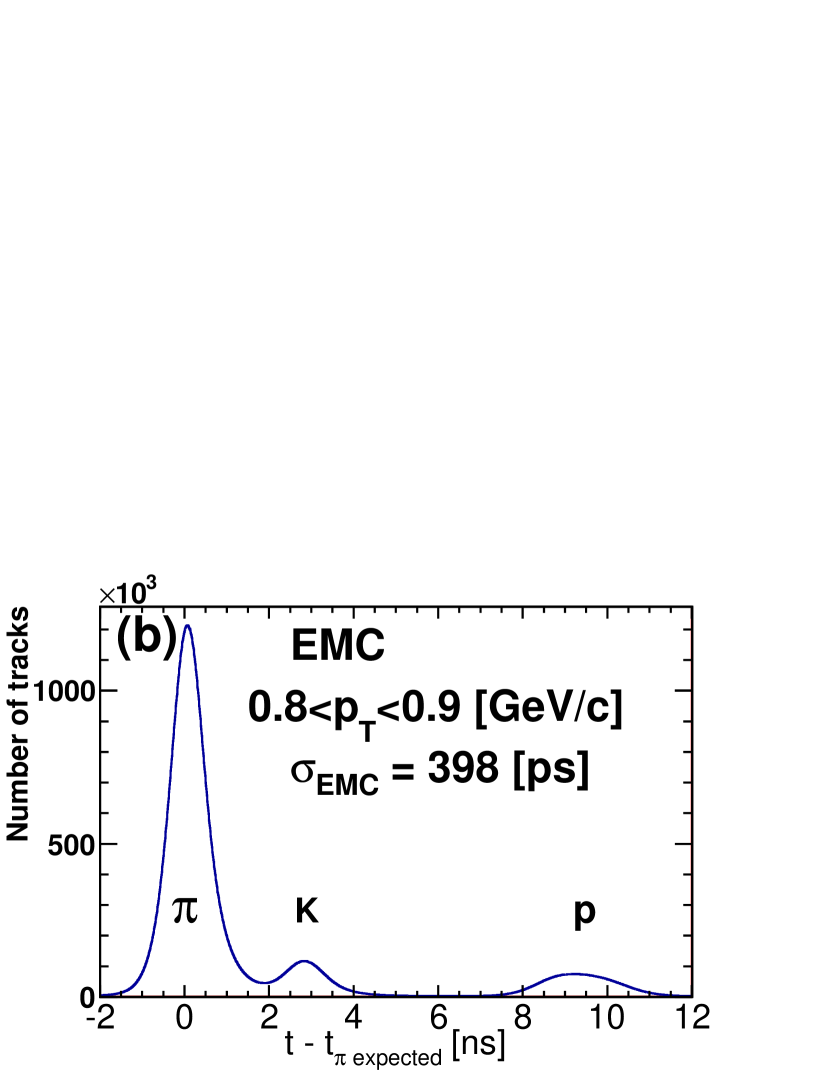
The timing resolution of the BBC-TOF and BBC-EMCal systems was determined by examining the timing difference between the measured flight-time and , the time which is expected under the assumption that the particles are pions. The resulting time distribution is shown in Fig. 3. A narrow peak centered around corresponds to pions, and the other two broad peaks are kaons and protons. A Gaussian distribution is fit to the pion peak and yields a resolution of 120 ps for the BBC-TOF system and 400 ps for the BBC-EMCal system.
The PID is performed by applying momentum-dependent cuts in mass-squared (). The distributions are fit with a 3-Gaussian function corresponding to pions, kaons, and protons. The corresponding widths and centroids are extracted from the data as a function of transverse momentum. To select candidate tracks of a particle species, the is required to be within two standard deviations of the mean for the selected particles species and outside 2.5 standard deviations of the mean for the other particle species. This provides a sample for each particle species with at least 90% purity in PID. For the BBC-TOF system the upper momentum cutoff is 2.2 GeV/ for kaons and 3 GeV/ for pions. For protons the upper momentum cutoff is 4 GeV/. For the BBC-EMCal system the upper momentum cutoff is 1 GeV/ for kaons and 1.4 GeV/ for pions. For protons the upper momentum cutoff is 2.2 GeV/. The lower momentum cutoff for both PID systems is 0.2 GeV/ for pions, 0.3 GeV/ for kaons and 0.5 GeV/ for protons. The PID results for the 200 GeV AuAu data set were obtained using TOF detector only; for the 62.4 GeV AuAu and 200 GeV CuCu data sets the PID results were obtained by including identified particles from either the TOF or EMCal over different momentum ranges. For overlap region, we use BBC-EMC because of the better statistics and include the differences between BBC-EMC and BBC-TOF as systematic uncertainty shown in Tab. 6. No correction is applied for any contamination from misidentified hadrons.
III.4 Azimuthal anisotropy: event plane method
Because the principal axis of the participants cannot be measured directly in the experiment, the azimuthal angle of the reaction plane is estimated Poskanzer and Voloshin (1998). The estimated reaction plane is called the “event plane” and is determined for each harmonic of the Fourier expansion of the azimuthal distribution. The event flow vector and azimuth of the event plane for -th harmonic of the azimuthal anisotropy can be expressed as
| (3) | |||||
| (4) | |||||
| (5) |
where denotes the number of particles used to determine the event plane, is the azimuthal angle of each particle and the weight is the charge seen in the corresponding channel of the BBC. Once the event plane is determined, the elliptic flow can be extracted by correlating the azimuthal angle of emitted particles with the event plane:
| (6) |
where is the azimuthal angle of tracks in the laboratory frame, is the -th order event plane and the brackets denote an average over all charged tracks and events. The denominator Res{} is the event plane resolution that corrects for the difference between the estimated event plane and true reaction plane . We measure using the same harmonic event plane () because this leads to a better accuracy Poskanzer and Voloshin (1998).
The second-harmonic event planes were independently determined with two BBCs located at forward (BBC South) and backward (BBC North) pseudorapidities –3.9 Adler et al. (2003). The planes were also combined to provide the event plane for the full event. More details study on using the BBC for the reaction plane measurement can be found in Afanasiev et al. (2009a). The measured of hadrons in the central arms with respect to the combined second-harmonic BBC event plane will be denoted throughout this paper as .
III.4.1 Event plane determination
To determine each event plane we chose the weights at each azimuthal angle to be the charge seen in the corresponding channel of the BBC. Corrections were performed to remove possible biases from small nonuniformities in the acceptance of the BBC. In this analysis we applied two corrections; the re-centering and shift methods Poskanzer and Voloshin (1998). In the re-centering method, event flow vectors are shifted and normalized using the mean and width of the vector distribution;
| (7) |
This correction reduces the dependence of the event plane resolution on the laboratory angle. Most acceptance effects are removed by this re-centering method. The shift method was used as a final correction Poskanzer and Voloshin (1998). In the shift method the reaction plane is shifted by defined by
| (8) | |||||
where = 8 in this analysis. The shift ensures that is isotropic. When was reduced to , the difference in the extracted was negligible and thus we include no systematic uncertainty due to the choice of in our results Afanasiev et al. (2009a).
Independent re-centering and shift corrections were applied to each centrality selection, in 5% increments, as well as 20 cm steps in -vertex. This optimizes the event plane resolution. The corrections were also performed for each experimental run (the duration of a run is typically 1-3 hours) to minimize the possible time-dependent response of detectors.
III.4.2 Event plane resolution
The event plane resolution for was evaluated by the two-subevent method. The event plane resolution Poskanzer and Voloshin (1998) is expressed as
| (9) |
where , is the number of particles used to determine the event plane , is the modified Bessel function of the first kind and = 1 for the second harmonic BBC event plane.
To determine the event plane resolution we need to determine . Because the North and South BBCs have approximately the same coverage, the event plane resolution of each sub-detector is expected to be the same. Thus, the subevent resolution for south and north event planes can be expressed as
| (10) |
where denotes the event plane determined by the South (North) BBC. Once the subevent resolution is obtained from Eq. (10), one can calculate using Eq. (9). The for the full event can then be estimated by . This is then substituted into Eq. (9) to give the full event resolution. Because the multiplicity of the full event is twice as large as that of the subevent, is proportional to .
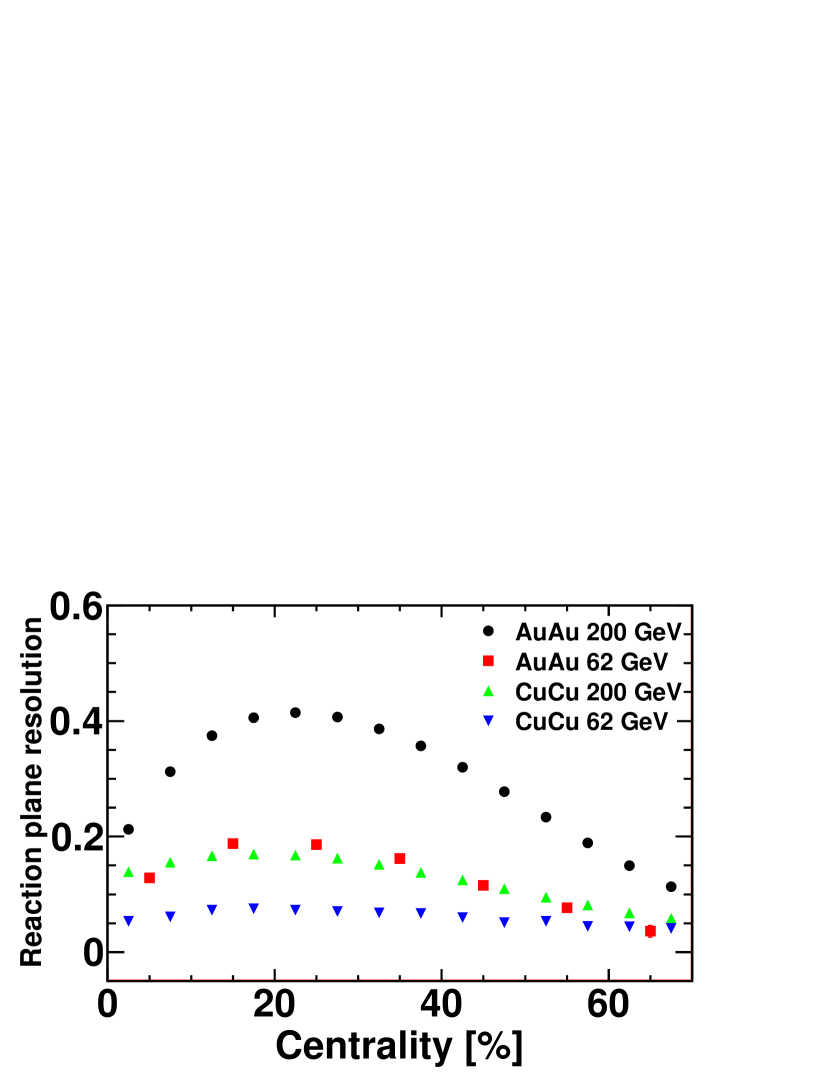
Figure 4 shows the BBC North-South-combined resolution of the event plane as a function of the centrality in AuAu and CuCu at = 200 and 62.4 GeV. The reaction-plane resolution and its uncertainties in AuAu and CuCu at 62.4 and 200 GeV are summarized in Table 3.
| AuAu 200 GeV | AuAu 62.4 GeV | CuCu 200 GeV | CuCu 62.4 GeV | |||||
|---|---|---|---|---|---|---|---|---|
| Centrality | Reso- | Stat. Uncert. | Reso- | Stat. Uncert. | Reso- | Stat. Uncert. | Reso- | Stat. Uncert. |
| bin | lution | for [%] | lution | for [%] | lution | for [%] | lution | for [%] |
| 0%–5% | 0.212 | 0.20 | 0.128 | 2.0 | 0.139 | 0.55 | 0.053 | 5.6 |
| 5%–10% | 0.312 | 0.09 | 0.155 | 0.44 | 0.061 | 4.3 | ||
| 10%–15% | 0.375 | 0.06 | 0.189 | 0.94 | 0.167 | 0.38 | 0.073 | 3.0 |
| 15%–20% | 0.405 | 0.05 | 0.170 | 0.37 | 0.075 | 2.8 | ||
| 20%–25% | 0.414 | 0.05 | 0.186 | 0.97 | 0.168 | 0.38 | 0.073 | 3.0 |
| 25%–30% | 0.407 | 0.05 | 0.162 | 0.40 | 0.071 | 3.2 | ||
| 30%–35% | 0.387 | 0.06 | 0.163 | 1.3 | 0.152 | 0.46 | 0.068 | 3.4 |
| 35%–40% | 0.357 | 0.07 | 0.138 | 0.56 | 0.067 | 3.5 | ||
| 40%–45% | 0.320 | 0.09 | 0.118 | 2.4 | 0.125 | 0.68 | 0.060 | 4.4 |
| 45%–50% | 0.278 | 0.12 | 0.110 | 0.88 | 0.051 | 6.1 | ||
| 50%–5%5 | 0.234 | 0.16 | 0.079 | 5.4 | 0.095 | 1.2 | 0.054 | 5.6 |
| 55%–60% | 0.189 | 0.25 | 0.082 | 1.6 | 0.045 | 7.9 | ||
| 60%–65% | 0.150 | 0.40 | 0.044 | 17.5 | 0.068 | 2.3 | 0.044 | 8.2 |
| 65%–70% | 0.113 | 0.70 | 0.058 | 3.1 | 0.041 | 9.6 | ||
III.5 Systematic uncertainty for
The sources of systematic uncertainty on the measurement include: reaction plane determination, the effects of matching cuts, the effects of the E/p cut, and occupancy effects for PID . These are described below.
| Centrality | AuAu | CuCu | ||
|---|---|---|---|---|
| bin | 200 GeV | 62.4 GeV | 200 GeV | 64 GeV |
| 0%–10% | 2 | 3 | 3 | 14 |
| 10%–20% | 3 | 2 | 2 | 9 |
| 20%–30% | 4 | 2 | 2 | 6 |
| 30%–40% | 4 | 7 | 2 | 2 |
| 40%–50% | 3 | 7 | 2 | 3 |
| 50%–60% | 3 | 5 | 2 | 5 |
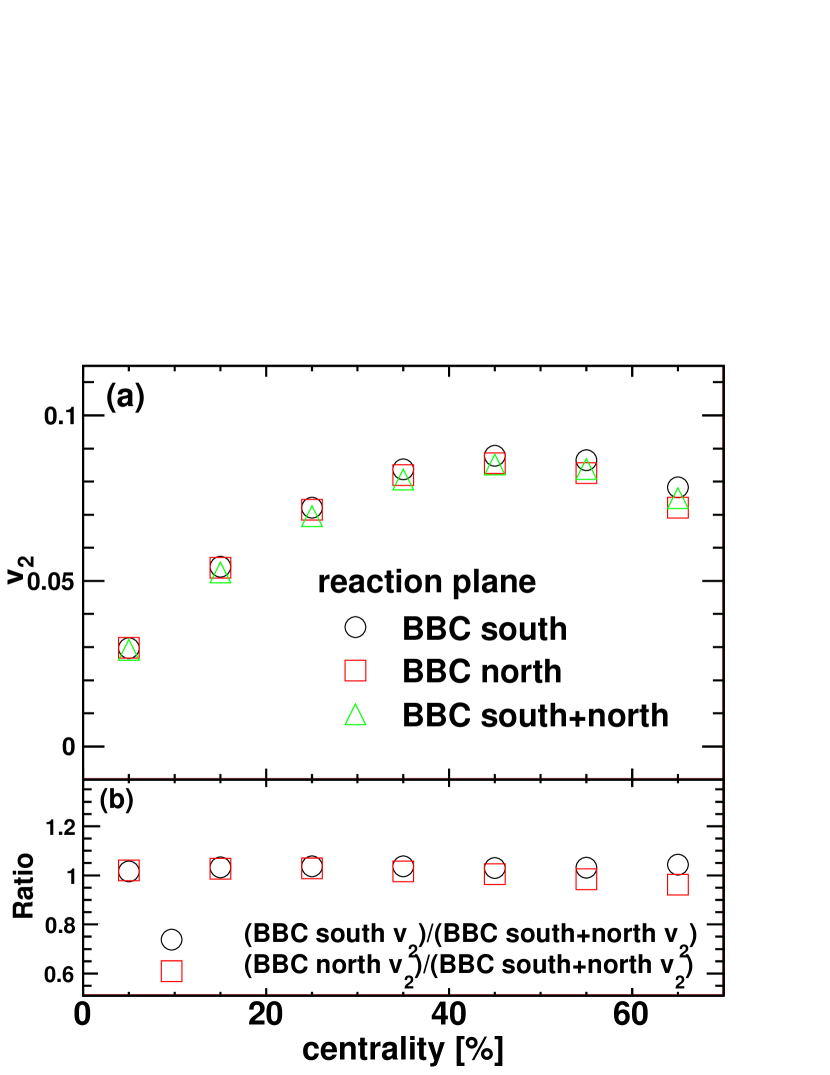
The systematic uncertainties due to the reaction plane determination were estimated by comparing the values extracted using three different reaction planes; the BBC North, BBC South, and BBC North-South combined. Figure 5a shows vs. centrality for three reaction planes (BBC South, North, South-North combined) for AuAu 200 GeV. The bottom panel shows the ratio of with BBC North and South RP to with BBC North-South combined (default). The percentage systematic uncertainty was obtained by taking the largest values away from unity of these ratios. These uncertainties are summarized in Table 4 summarizes for each data set and each centrality bin.
| AuAu 200 GeV | AuAu 62.4 GeV | CuCu 200 GeV | CuCu 62.4 GeV | |||||||||
| Systematic Uncertainty (%) | Systematic Uncertainty (%) | Systematic Uncertainty (%) | Systematic Uncertainty (%) | |||||||||
| (GeV/) | Matching cut | cut | Matching cut | cut | Matching cut | cut | Matching cut | cut | ||||
| 0.2–1.0 | 1 | 1 | 1 | 2 | 1 | 3 | 2 | 3 | ||||
| 1.0–2.0 | 1 | 3 | 1 | 4 | 1 | 2 | 1 | 2 | ||||
| 2.0–4.0 | 1 | 2 | 4 | 3 | 1 | 3 | 2 | 3 | ||||
The default matching cuts for tracks projected to PC3 are and . To obtain the systematic uncertainty from the dependence on these matching cuts, we examined different cut windows, e.g. and , and compared values using these cuts to values from the default cut. The difference between values with these matching cuts determine the systematic uncertainties. Because the alternative cut windows have a smaller sample of data, we extracted the systematic uncertainty from the minimum bias event sample and used these for all centralities. Table 5 shows the matching systematic uncertainties.
The cut can reject background from conversions, especially for high tracks. The default cut, , was used for tracks with 4 GeV/. To test the sensitivity to the value of the cut, we apply cuts of 0.1, 0.2 and 0.3 cuts for tracks 4 GeV/; a lower momentum was used because we have more statistics there. The ratio of with different cuts contributes to the systematic uncertainty. We obtained the systematic uncertainty due to the cut using the minimum bias event sample, because within the statistics we did not observe any centrality dependence for how changed with different cuts. Table 5 lists the systematic uncertainties from the cut.
Both EMCal and TOF detectors are used for particle identification. In the low region both detectors can be used, and the difference between measured with the EMCal and TOF, averaged across , is used for the systematic uncertainty due to timing performance. This includes the 1% uncertainty due to background contributions in the particle identification. The values are summarized in Table 6. Note, that the timing systematic uncertainty only affects the identified hadron results.
| Collision | identified hadron | |||
| Species | [GeV] | K | p | |
| AuAu | 62.4 | 2 | 4 | 6 |
| CuCu | 200 | 3 | 5 | 6 |
The values for can be impacted due to finite occupancy which tends to lower the measured . The magnitude of this effect has been estimated to be largest for central AuAu collisions at 200 GeV as a reduction in for PID particles of approximately 0.0013 for the running conditions of the data presented here. This effect is independent of . For different centrality and beam-energies we take the systematic uncertainty on PID to linearly decrease with the average charged particle multiplicity in those collisions.
IV results for of inclusive charged hadrons
In this section we describe the measurements and how they change as a function of collision energy and system size. We present the measured for inclusive charged particles in AuAu and CuCu collisions at 62.4 and 200 GeV. For 200 GeV, the results for GeV/ are obtained by re-binning the data published in Adare et al. (2007); Afanasiev et al. (2009a); Adare et al. (2010). The new 200 GeV data published in this paper are results for GeV/. In addition the 62.4 GeV CuCu data are new results original in this paper.
The centrality selections of each collision system are:
-
1.
AuAu collisions at = 200 GeV
-
•
Minimum Bias ; 0%–92%
-
•
10% steps ; 0%–10%, 10%–20%, 20%–30%, 30%–40%, 40%–50%, 50%–60%
-
•
20% steps ; 0%–20%, 20%–40%, 40%–60%
-
•
Most peripheral bin ; 60%–92%
-
•
-
2.
AuAu collisions at = 62.4 GeV
-
•
Minimum Bias ; 0%–83%
-
•
10% steps ; 0%–10%, 10%–20%, 20%–30%, 30%–40%, 40%–50%
-
•
-
3.
CuCu collisions at = 62.4 and 200 GeV
-
•
Minimum Bias ; 0%–88%
-
•
10% steps ; 0%–10%, 10%–20%, 20%–30%, 30%–40%, 40%–50%
-
•
IV.1 vs. results for inclusive charged hadrons
IV.1.1 AuAu at = 200GeV
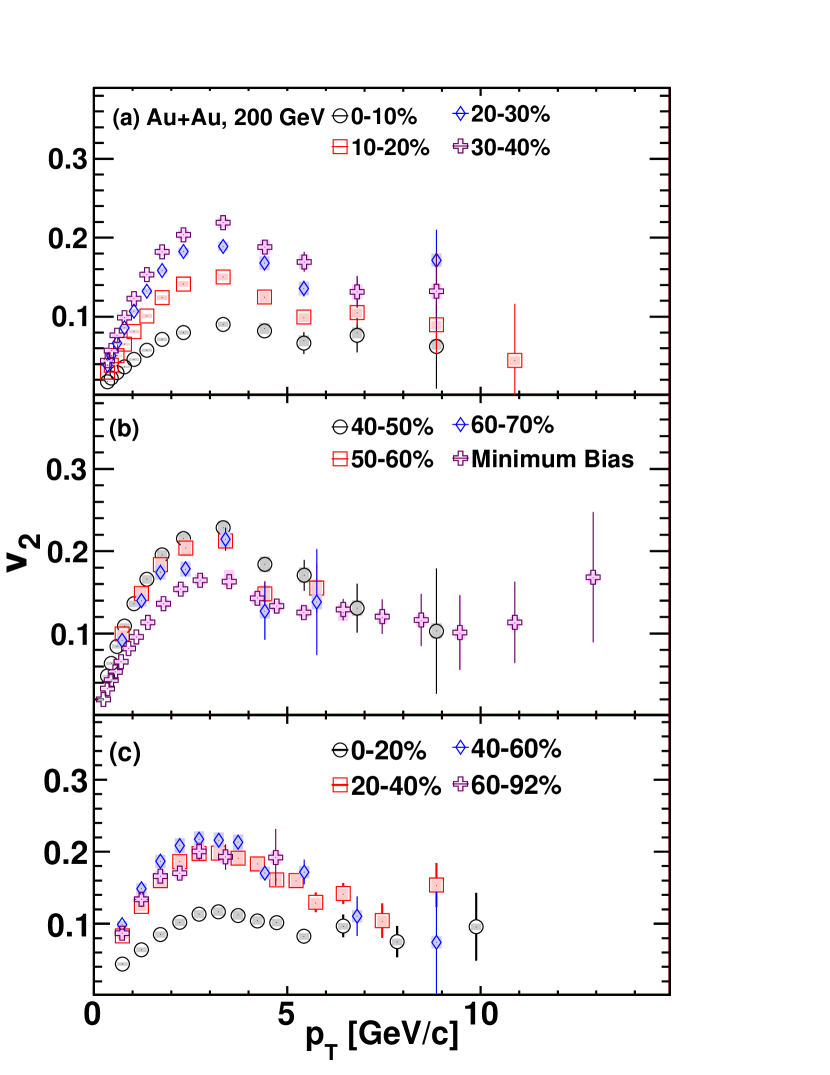
We analyzed 860 million AuAu collisions at 200 GeV collected during the 2003-04 experimental period, which is more than 20 times larger than the sample of events (30 M) analyzed from the 2001-02 experimental period Adler et al. (2003). Figure 6 shows the for inclusive charged hadrons in AuAu collisions at 200 GeV.
IV.1.2 AuAu at = 62.4GeV
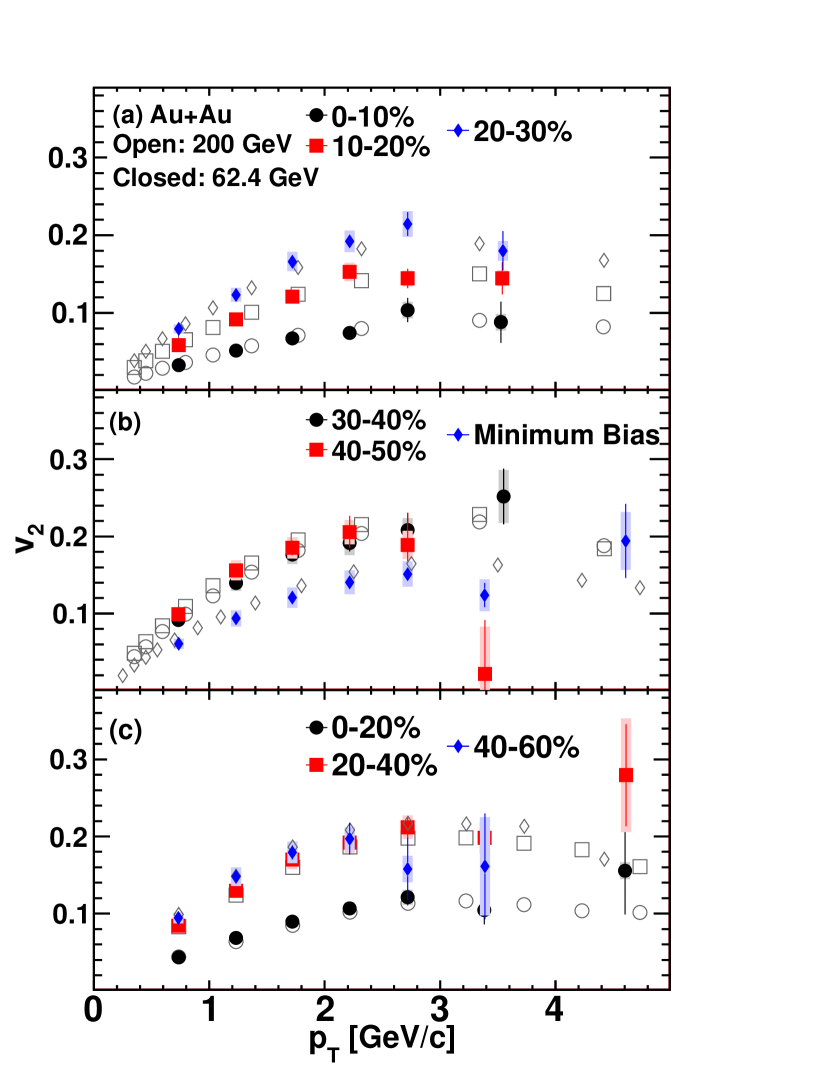
For AuAu collisions at 62.4 GeV, 30 million events were analyzed to study the dependence of on collision center-of-mass energy. The measured results from this collision system are shown in Fig. 7, together with the results from AuAu 200 GeV collisions. The values of are very similar at these two beam energies. We observe that the measurements for AuAu collisions at 62.4 GeV are consistent with those for AuAu at 200 GeV, within the combined statistical and systematic uncertainties.
IV.1.3 CuCu at = 200 and 62.4GeV
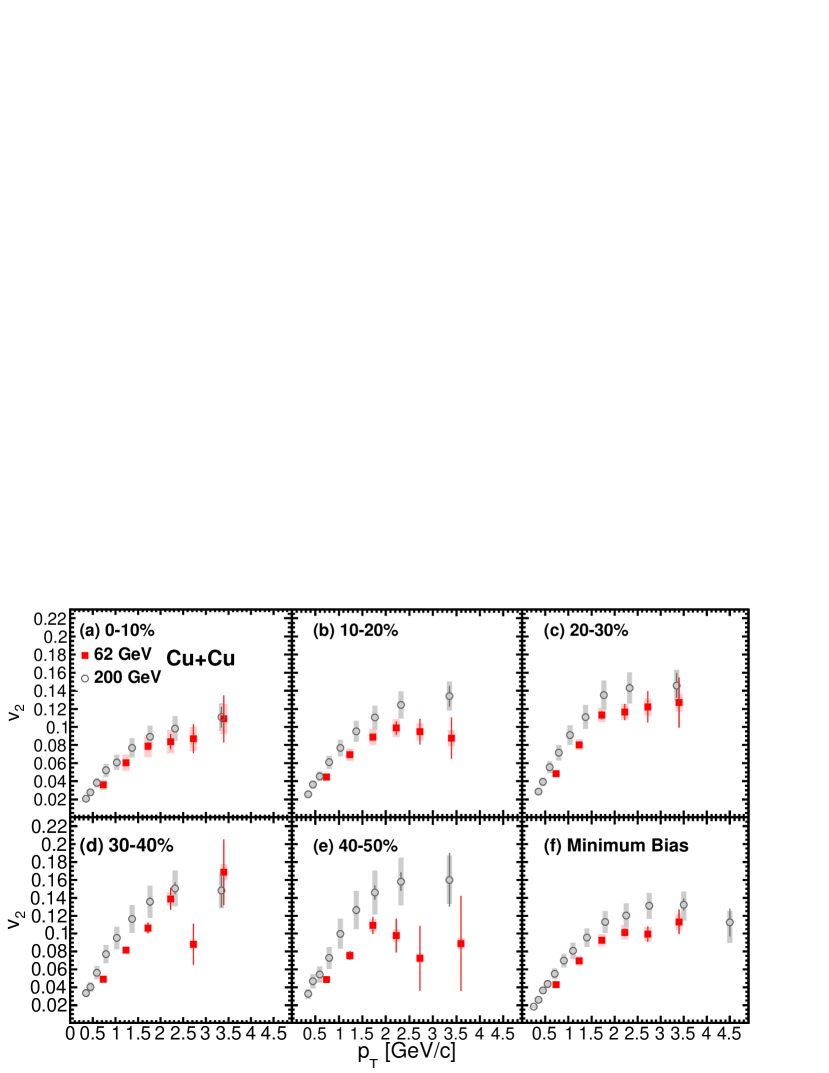
For CuCu collisions at 62.4 GeV, 340 million events were analyzed to study the dependence of on collision center-of-mass energy and system size. Figure 8 shows the results at 62.4 GeV in minimum bias events and 10% centrality selections. These are compared with CuCu 200 GeV results Adare et al. (2007). The results for CuCu collisions at 62.4 GeV are clearly smaller than those in 200 GeV collisions, especially at GeV/.
IV.2 System comparisons
IV.2.1 Centrality and collision energy dependence
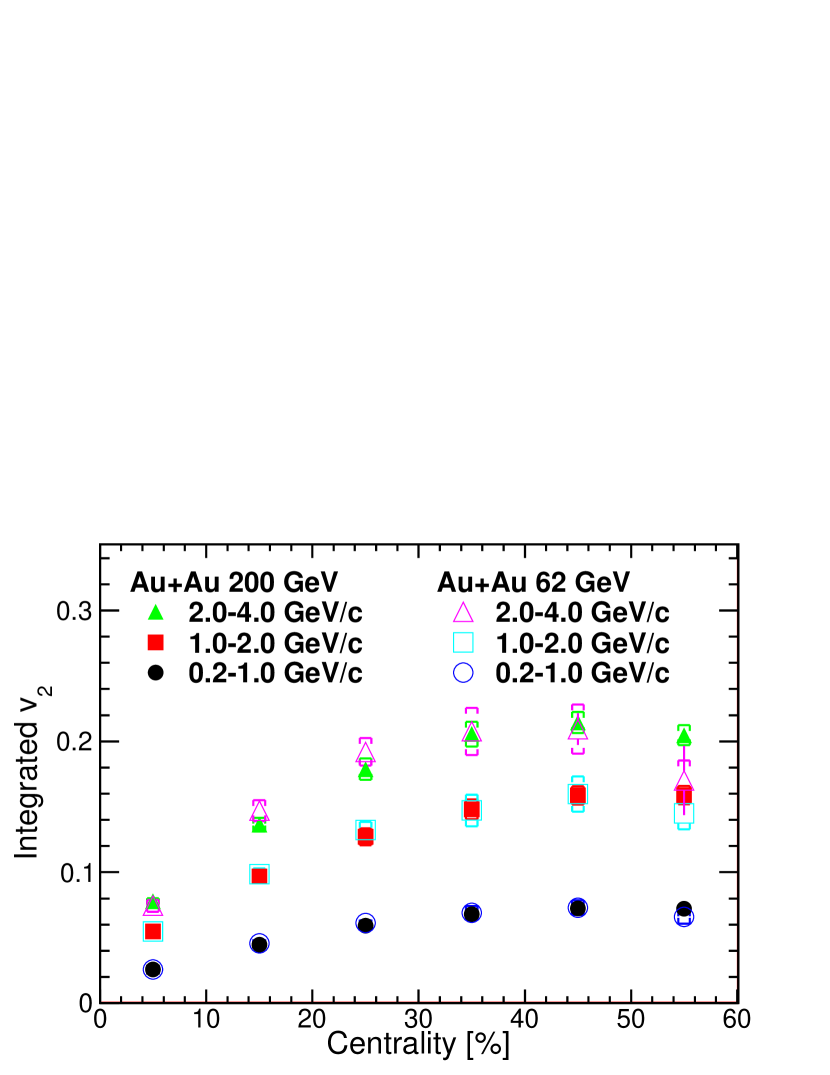
An alternative view of these data is to make separate selections and to plot in a given range as a function of centrality and collision energy. Figure 9 presents the AuAu data as a function of centrality, where triangles, boxes, and circles correspond to three bins: 0.2–1.0, 1.0–2.0 and 2.0–4.0 GeV/ respectively. The two different beam energies are presented by open and closed symbols for 62.4 and 200 GeV respectively. The data confirms prior results that increases from central to midcentral collisions and then begins to decrease again towards peripheral collisions. The for AuAu at 62.4 and 200 GeV agree to within statistical and systematic uncertainties for all measured centralities.
A similar comparison has been carried out by the STAR experiment reaching even lower energies from 7.7 to 200 GeV Adamczyk et al. (2013). Their results show that the () increases slightly from 7.7 up to 39 GeV, then saturates above 39 GeV.
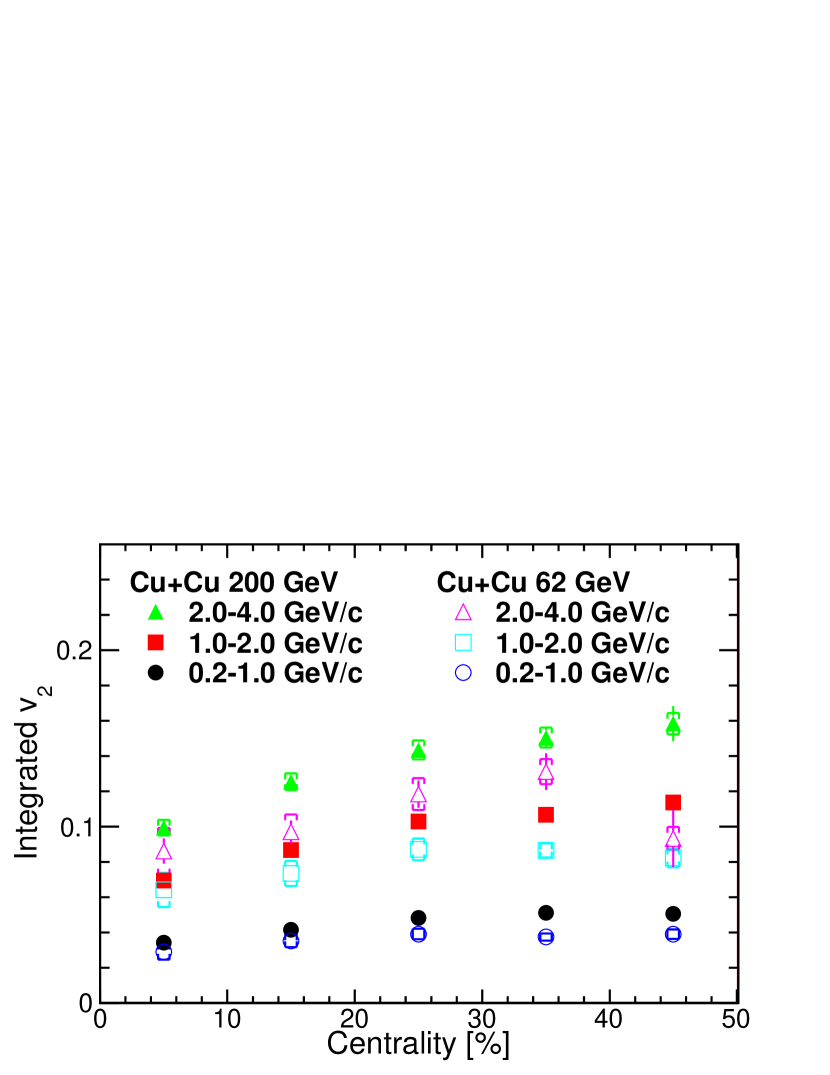
Figure 10 shows the centrality dependence of for charged hadrons emitted at different from CuCu collisions at 62.4 and 200 GeV. The statistical uncertainties are larger due to lower statistics for the CuCu in the 62.4 GeV data sample. The measured values are lower at 62.4 GeV compared with 200 GeV.
We have made a comparison between the measured PHENIX and the previously published STAR measurement Abelev et al. (2010) in Cu+Cu collisions and found them to be generally consistent. For 200 GeV Cu+Cu the PHENIX are higher by about 10% in the 0-10%, 10-20%, 20-30% and 30-40% centrality bins, and higher by about 20% in 40-50% bin; these differences are within statistical and systematic uncertainties of the PHENIX results in all cases. At 62.4 GeV the PHENIX is lower by approximately 10% in the 0-40% bins and by 20% in 40-50% bin. These differences are within statistical and systematic uncertainties in the 0-20% bins, though they are roughly twice the statistical and systematic uncertainties in 20-50% bins, taking into account errors on the PHENIX measurement alone.
IV.2.2 Geometry dependence, eccentricity and
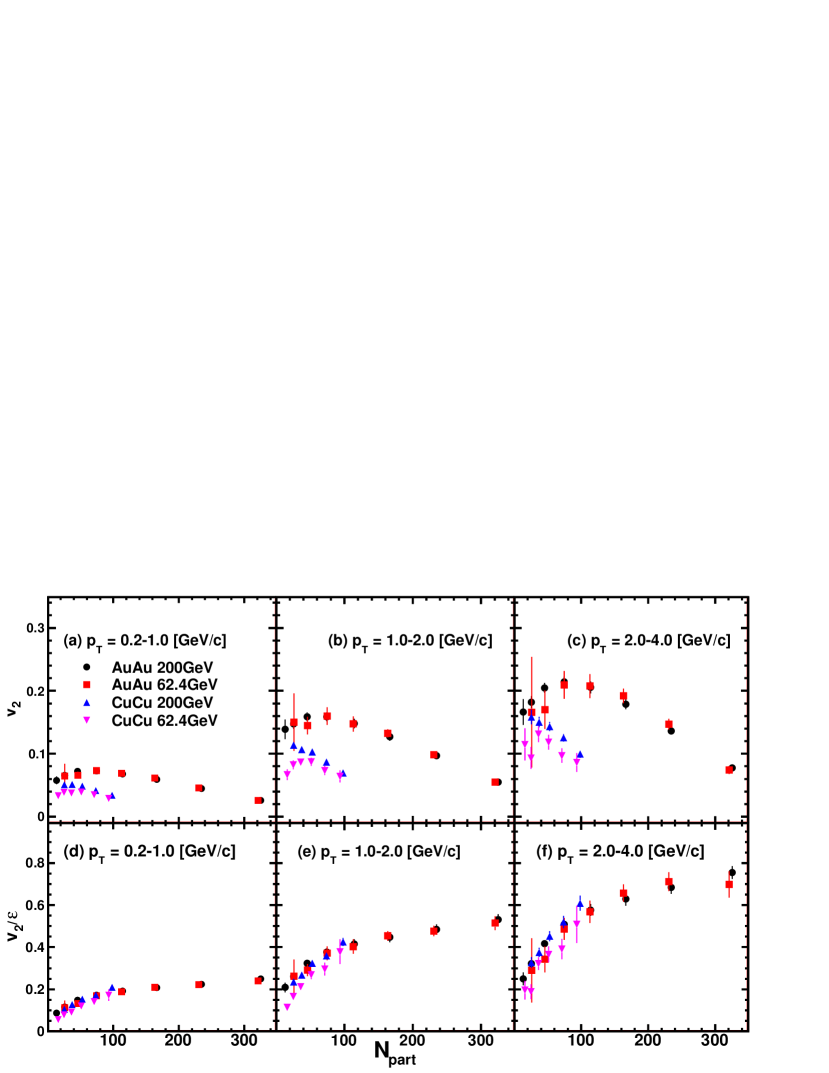
There are two ways to establish the extent that changes with the system size: one is to change the collision centrality, the other is to change the colliding nuclei. As seen in Fig. 11, the measured in CuCu collisions is smaller than that of AuAu at a comparable .
Because is different between AuAu and CuCu collisions at the same , we can try to normalize by . In the lower row of Fig. 11, normalized by is similar in magnitude for both CuCu and AuAu collisions. This confirms that the eccentricity normalization can account for the effect of the initial geometrical anisotropy Alver et al. (2007). The exception is that the CuCu 62.4 GeV data falls below the other data. Note that the ratio also depends on centrality () and that there is a similar rate of increase of with for all three bins: 0.2–1.0, 1.0–2.0, and 2.0–4.0 GeV/. This pattern suggests the need for an additional normalization or scaling factor that depends on .
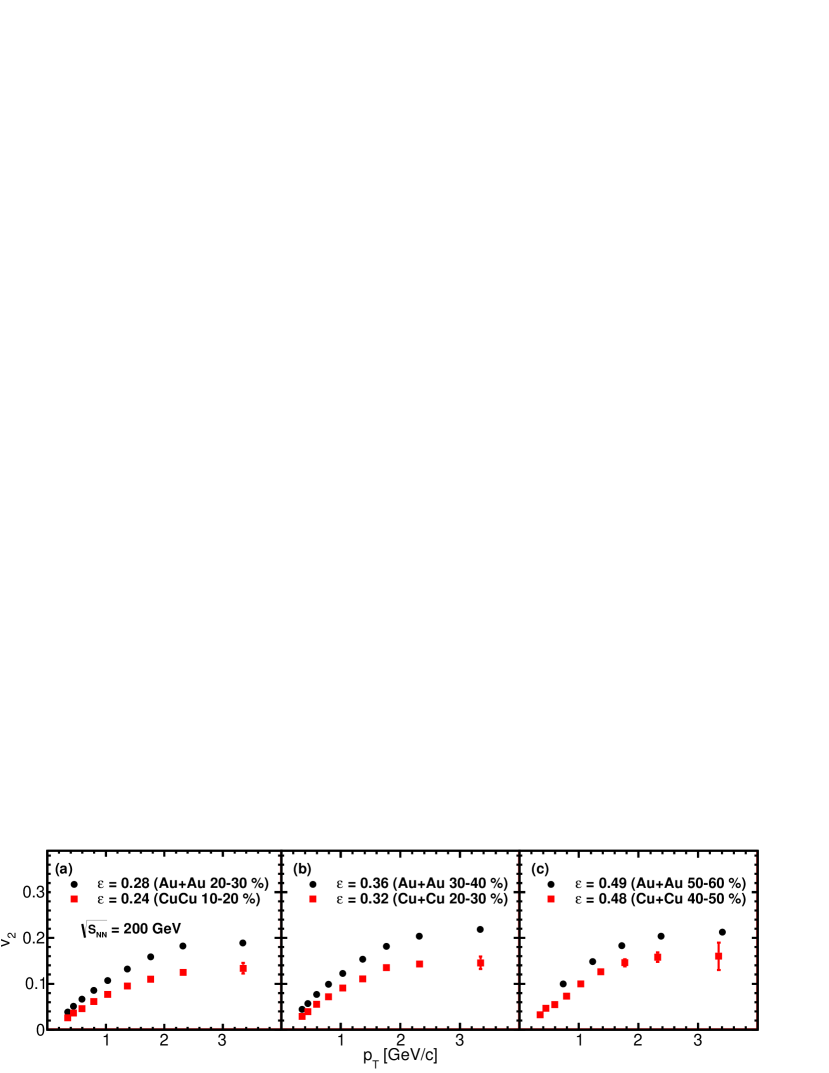
Figure 12 is a comparison of as a function of for centrality classes that have approximately the same value of but with different values of . The average is 166.6 for 20%–30%, 114.2 for 30%–40% and 45.5 for 50%–60% in AuAu collisions, while is 73.6 for 10%–20%, 53.0 for 20%–30% and 25.4 for 40%–50% in CuCu collisions. It can be clearly seen that increases with for similar .

IV.2.3 Participant scaling
We empirically explore using as a potential scaling factor of in addition to . We draw on results with a different observable, namely that the HBT source sizes at RHIC have been observed to scale with Afanasiev et al. (2009b). Under the phenomenological assumption that is proportional to the volume of hot/dense matter formed in high-energy nuclear collisions, can be considered as a quantity proportional to a length scale.
Figure 13 plots /( ) for integrated bins of = 0.2–1.0, 1.0–2.0, and 2.0–4.0 GeV/. This combination of two scaling factors works well, i.e. the scaled data are at comparable values, with the exception of the CuCu data at 62.4 GeV which deviate from this scaling, particularly at 40. That this empirical scaling works well suggests that is determined by both the initial geometrical anisotropy and the number of participants.
Other scalings for the system size dependence have been suggested, particularly Adler et al. (2002) where is the transverse area of the participant zone. Because dN/dy is proportional to at a given beam energy and is approximately proportional to ()2/3, is then proportional to .
V results for of identified charged hadrons
More information can be obtained by examining for charged pions, kaons and (anti) protons (/K/p) each as a function of transverse momentum . The charged particles are identified by TOF and EMCal and the data are presented for several classes of collision centrality;
-
1.
AuAu collisions at = 62.4 GeV
-
•
10%–40% (Particles and antiparticles are measured separately.)
-
•
10% bins from 0% to 50% (Particles and antiparticles are measured together.)
-
•
-
2.
AuAu collisions at = 200 GeV
-
•
0%–92% (Particles and antiparticles are measured separately.)
-
•
10% bins from 0% to 50% (Particles and antiparticles are measured together.)
-
•
-
3.
CuCu collisions at = 200 GeV
-
•
10% bins from 0% to 50% (Particles and antiparticles are measured together.)
-
•
Note we do not present CuCu 62.4 GeV data in this section because there were insufficient statistics to determine for identified particles.
V.1 Beam energy dependence
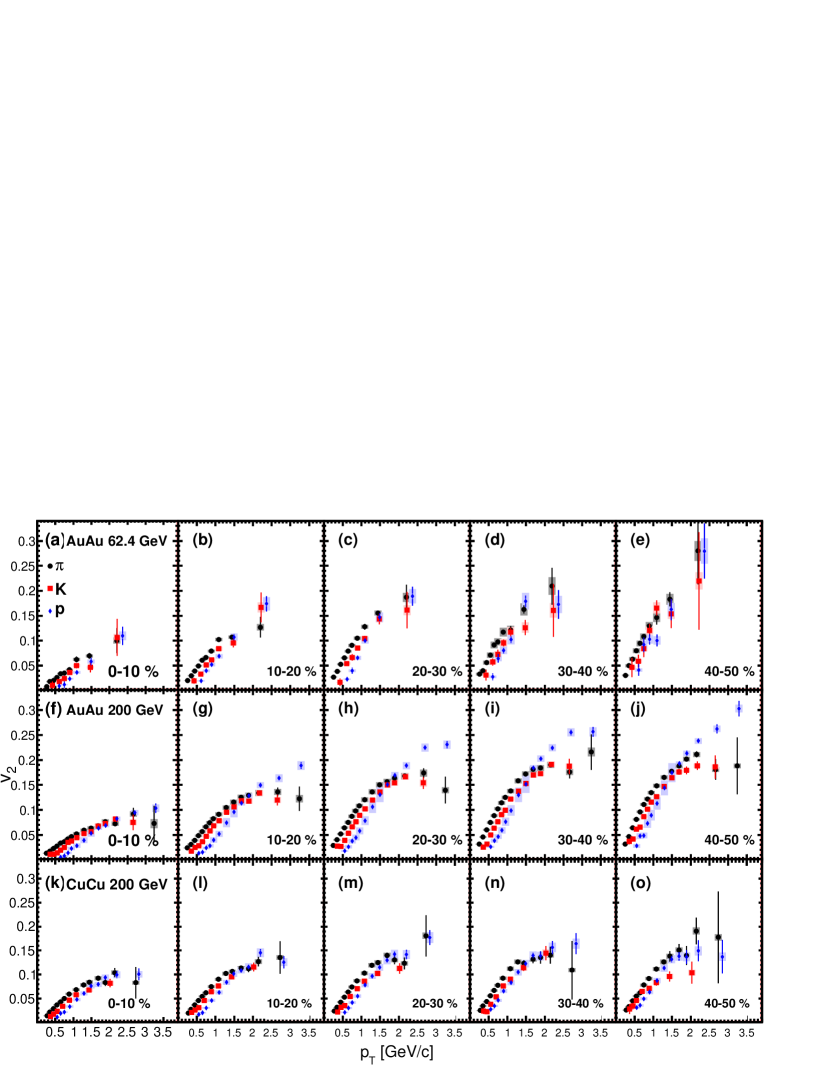
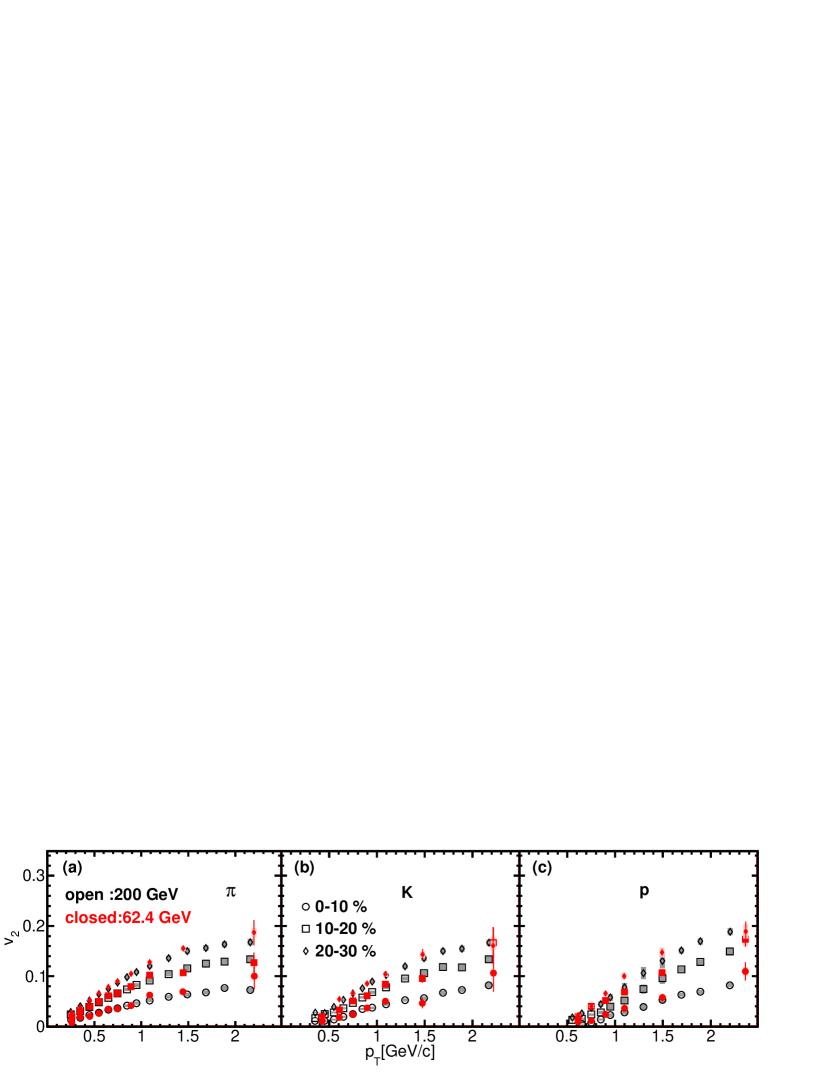
Figure 14 shows a summary of measurements of identified particles for three different data sets; AuAu at 62.4 and 200 GeV and CuCu at 200 GeV. Figure 15 shows the comparison between 62.4 and 200 GeV for AuAu collisions. The measured in the 62.4 and 200 GeV data sets are consistent, within the systematic uncertainties, with the exception of proton at 62.4 GeV which is slightly higher than at 200 GeV in the lower region. These small differences could be caused by larger radial flow at higher , especially for heavier particles such as protons.
The observation that the proton is larger at 62.4 GeV than at 200 GeV for AuAu collisions is opposite to the earlier observation that inclusive charged at 62.4 GeV is lower than that at 200 GeV CuCu. Therefore, the differences in lower for inclusive charged hadrons from CuCu may be caused by different physics than the radial flow effect seen in AuAu collisions.
V.2 Particle-antiparticle comparison
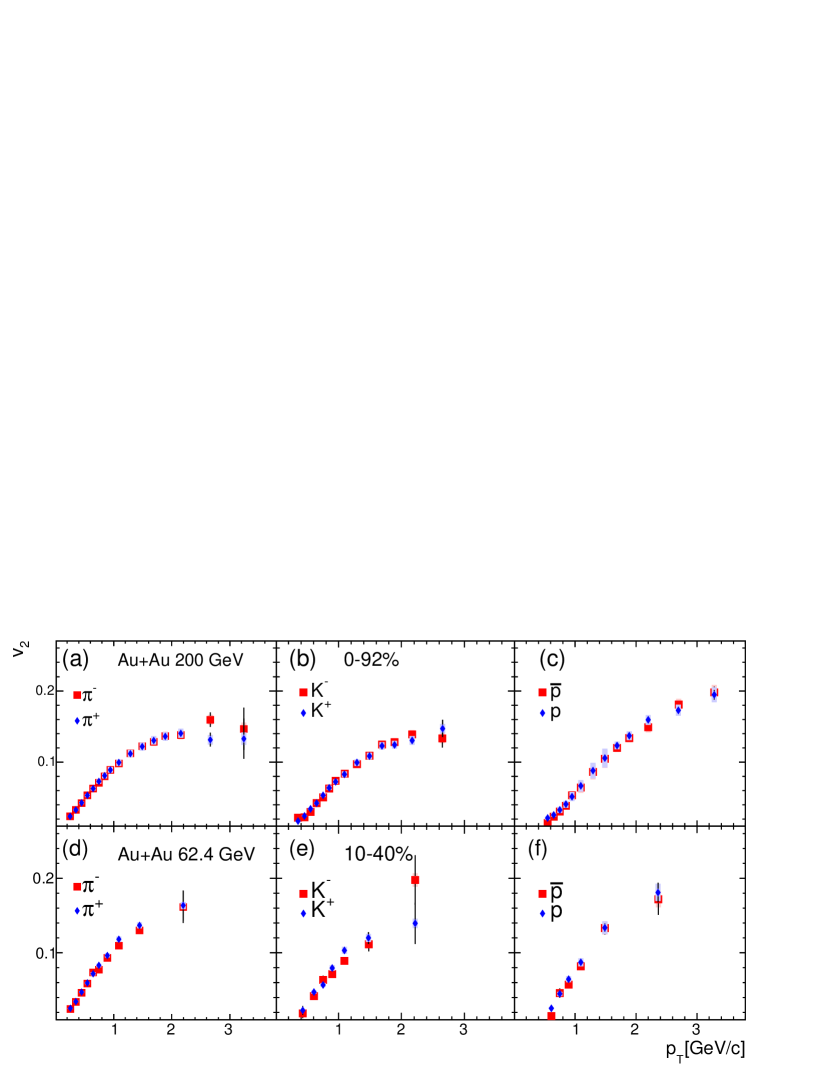
When we examine identified we will combine opposite charged particles, e.g. , to form . Prior results on the ratio of for antiparticles and particles can be found in Refs. Abelev et al. (2007); Adamczyk et al. (2013). In this section we compare the particle and antiparticle in AuAu collisions at 200 and 62.4 GeV in wide centrality classes: a minimum bias sample (0%–92%) for 200 GeV and 10%–40% for 62.4 GeV data. The first and second rows of plots in Fig. 17 present as a function of for , K±, p and in AuAu collisions at 200 and 62.4 GeV. The lines for each point are the statistical uncertainties and the boxes are systematic uncertainties.
At both 200 and 62.4 GeV, the the measured AuAu values of particle and antiparticle are comparable to each other within uncertainty, though there is a possible indication of a small reduction of anti-proton at lower . When we combine particle and anti-particle we average over these differences.
V.3 Number of valence quark scaling of
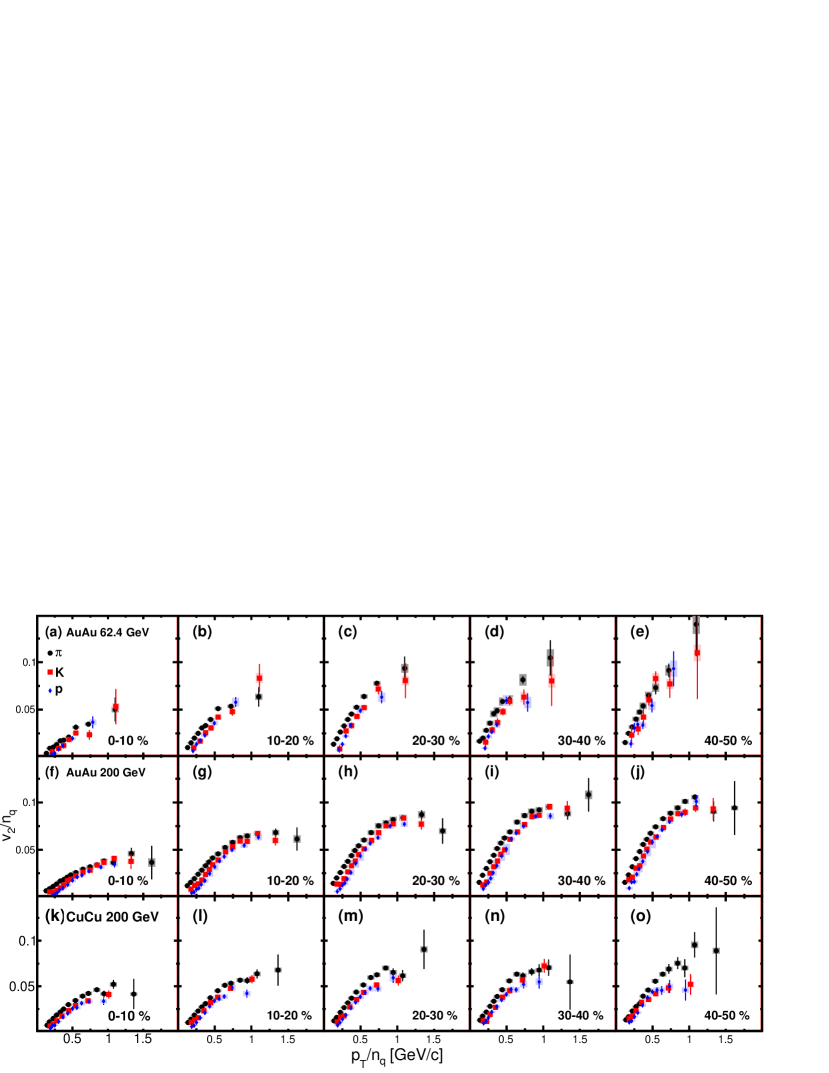
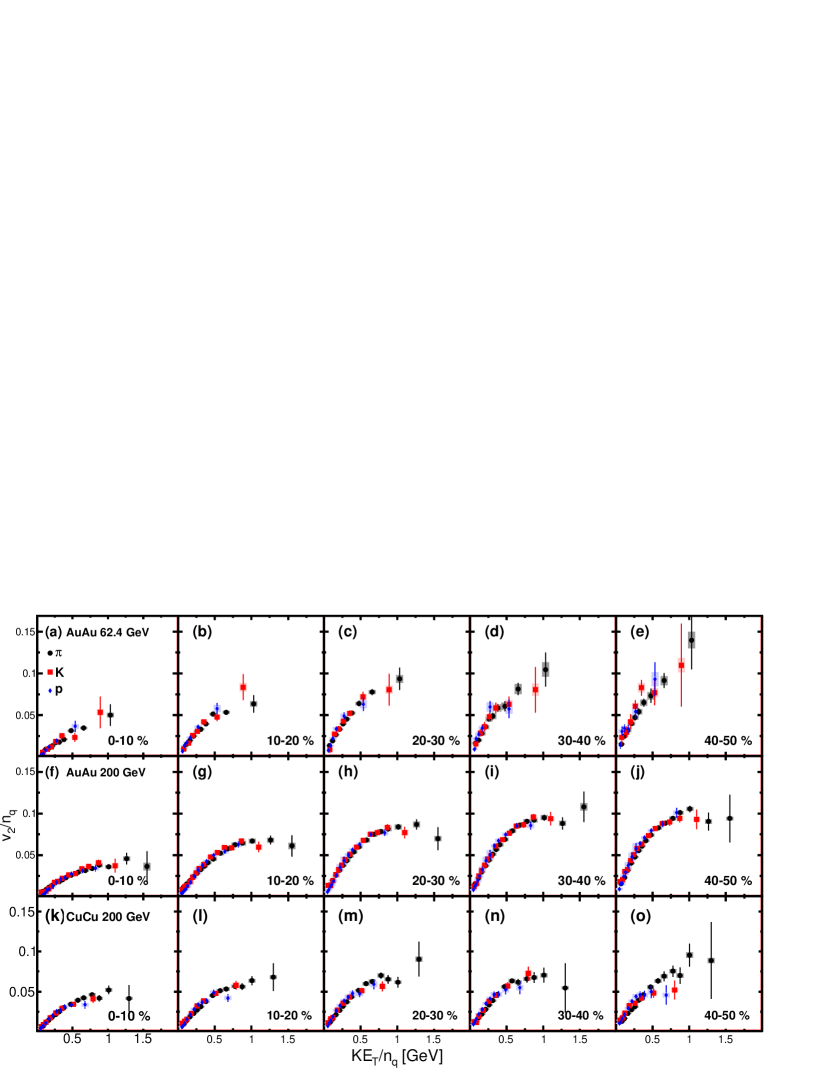
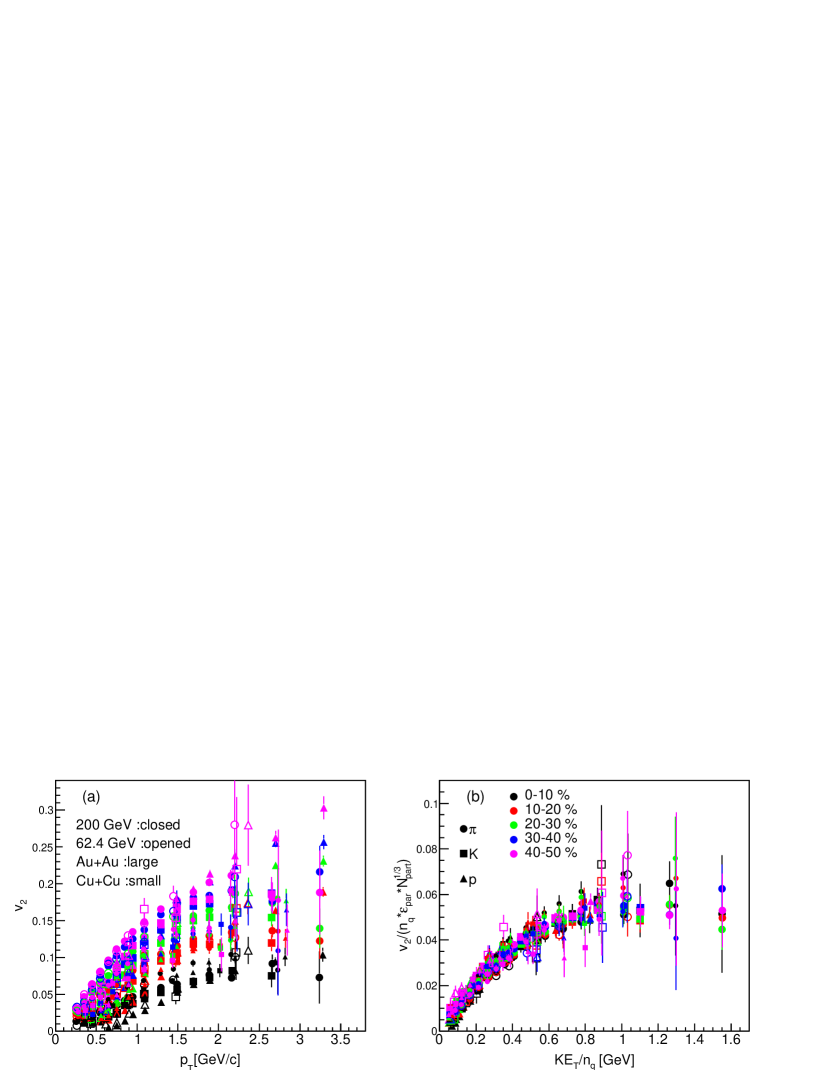
The measurements of identified particles for three different data sets; AuAu at 62.4 and 200 GeV and CuCu at 200 GeV collisions are re-plotted in Fig. 17 after scaling by the number of constituent quarks for both and axes as shown. An alternative scaling is to use transverse kinetic energy. We define transverse kinetic energy as = , where m is the mass of the hadron and . The quark number scaled are shown as a function of / for all three data sets in Fig. 19.
Note that at higher values, / 0.7, PHENIX has observed significant deviations from scaling for AuAu noncentral collisionsAdare et al. (2012). Those higher results indicate that the azimuthal anisotropy of these high particles are impacted by mechanisms such as parton-energy loss, jet chemistry, and/or different fragmentation functions. For comparison, at the LHC Abelev et al. (2013, ), does not scale well with the quark number and transverse kinetic energy of the hadron in any range of /, with up to 40% deviations observed at low values of /.
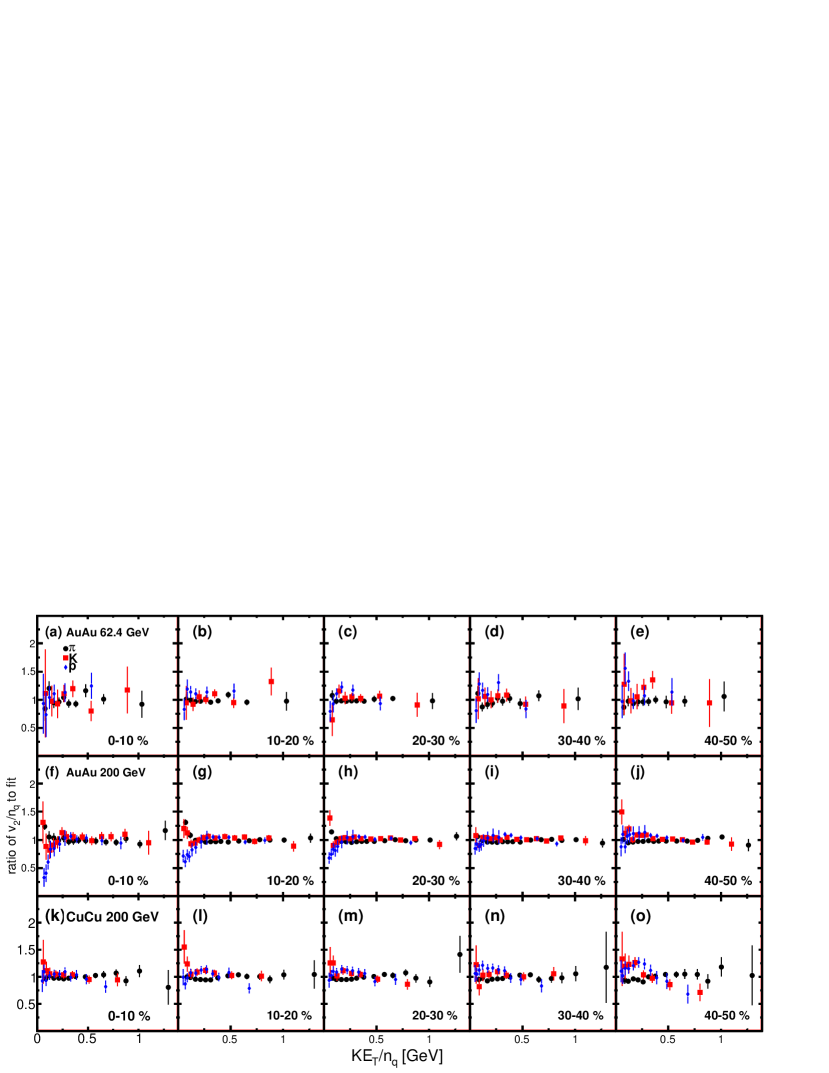
To quantify how well the number of quark scaling with works with the current data, we fit all the hadron species data in Figure 19 with a common polynomial function for each centrality and colliding system. We divide the data by these fits to compare how close different hadron species are to the common scaled shape of . Figure 19 shows these ratios as a function of / for /K/p in AuAu and CuCu. Deviations from the fitted polynomial function are observed, especially with the high statistics data sets at 200 GeV AuAu and 200 GeV CuCu collisions. For AuAu central collisions in the low / region (/ GeV), protons sit below the common scaling fit and rise above the fit at moderate /. These deviations systematically change with centrality, i.e. the proton is smaller than pion at low / in the most central AuAu collisions at 200 GeV, while the proton becomes larger than pion in peripheral collisions. The proton is also larger than the pion at low / in 200 GeV CuCu peripheral collisions. The proton and pion become comparable in central CuCu collisions. It is noted that the location where the proton and pion flows are comparable occurs at a similar number of participants for AuAu and CuCu. This could be explained by an increase in radial flow as a function of the number of participants, which effectively reduces the proton relative to the pion for a given Voloshin et al. (2008).
For CuCu collisions at 200 GeV, the bottom five panels of Figs. 17 and 19 show the / vs. / and /, respectively for /K/p emitted from CuCu collisions at 200 GeV for the five centrality bins: 0%–10%, 10%–20%, 20%–30%, 30%–40% and 40%–50%. For the smaller system of CuCu at 200 GeV (the bottom row of Fig. 19), quark number with scalings reduces the spread in values better than scaling in Fig. 17, especially for the more central collisions between 0%–40%. For peripheral CuCu collisions, the number of quark scaling with does not work well. The deviation from scaling seems to be largest at peripheral collisions, i.e. at 40%–50%, especially between pions and protons.
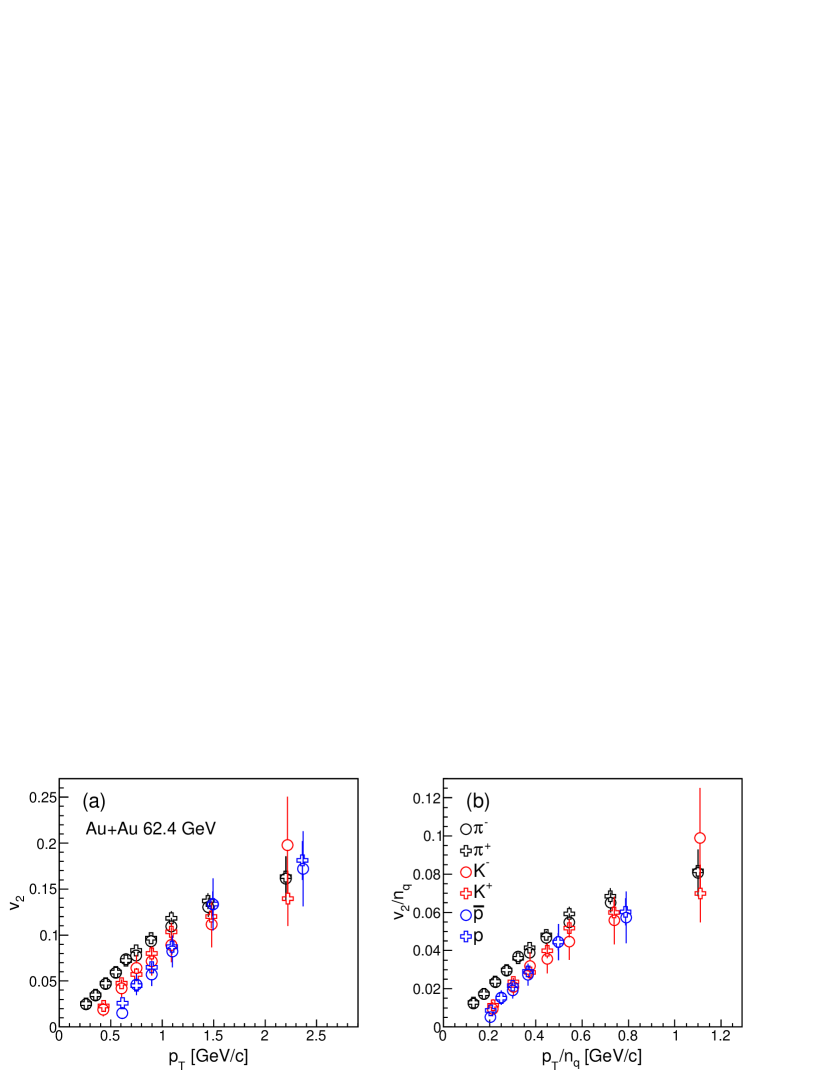
We examine in more detail the scaling at low in the 62.4 GeV data in stages. First, the left panel in Fig. 20 summarizes the unscaled data from 10%–40% central AuAu collisions at 62.4 GeV. The values are broadly spread in their magnitude. A reduction in spread is observed in the right panel when , the number of valence quarks, is used as a scaling. However the scaled values do not collapse to a universal curve. Figure 21 does show a better scaling with /.
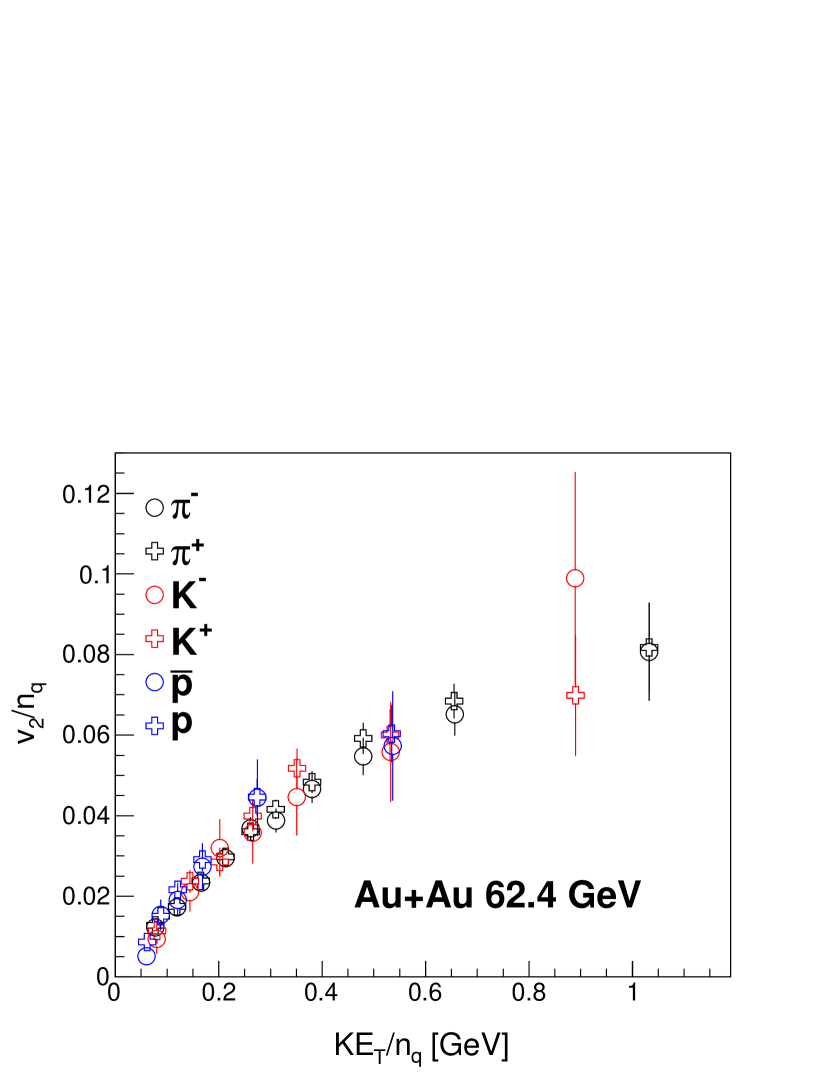
Overall, the combined scaling works well (typical deviations less than 20%) for / 1 GeV, indicating that the elliptic collective motion is created at a level consistent with constituent quarks both at 62.4 GeV in AuAu and at 200 GeV in CuCu.
V.4 Universal scaling
We consider a universal scaling for all the measurements in this paper for identified hadrons between / 1 GeV. Within a given collision system, i.e. each centrality bin for each set of AuAu and CuCu collisions, we first apply quark number scaling and scaling. Then we apply the eccentricity normalization and scaling for each colliding system. Because we have observed that saturates with beam energy between 62 -200 GeV, we do not apply any scaling with beam energy. The data with the four factors applied (quark number scaling, scaling, eccentricity normalization and scaling) are shown as a function of / in Fig. 22, which includes data from AuAu at 200 GeV, AuAu at 62.4 GeV and CuCu at 200 GeV at five centrality bins over 0%–50% in 10% steps for each system. There are 45 data sets in total. The combined data is fit with a single 3rd-order-polynomial, producing a = 1034/490 = 2.11 (including both statistical and systematic uncertainties). Note there is no CuCu 62.4 GeV data in Fig. 22, because there were insufficient statistics to determine for identified particles.
If we apply the scaling to the same data sets instead of scaling, we obtain . Therefore, is a better scaling factor than . As we mentioned Section V.3, there are some deviations from the quark number and scalings, therefore this normalized curve is not perfectly a single line. Further investigation of these deviations would require higher precision measurements.
VI summary and conclusion
We have measured the strength of the elliptic anisotropy, , for inclusive charged hadrons and identified charged hadrons (/K/p) in AuAu and CuCu collisions at = 200 and 62.4 GeV to study the dependence of on collision energy, species and centrality. Results of this systematic study reveal the following features. Comparisons between 200 and 62.4 GeV collisions demonstrate that as a function of does not depend on beam energy in AuAu. In CuCu, the at 62.4 GeV is slightly lower than that at 200 GeV.
One possibility for the lower values 62.4 GeV in CuCu is less complete thermalization in small systems at lower beam energies. At least two types of theoretical models have been used to investigate the question of incomplete thermalization for systems formed at RHIC. Borghini argues that because / depends on dN/dy Borghini (2006), the systems formed at RHIC are not fully thermalized during the time when develops. Borghini argues that this dN/dy dependence can be interpreted as dependence on a Knudsen number representing incomplete thermalization. Recent hydrodynamical models that include shear viscosity and initial fluctuations Niemi et al. (2012); Song et al. ; Soltz et al. (2013) effectively include nonequilibrium effects through the finite viscosity. Using a different non-equilibrium approach, microscopic transport models Uphoff et al. (2015) solve the relativistic Boltzmann equation. Both the viscous hydrodynamical and the Boltzmann transport models can be tested with our two observation that the at CuCu at 62.4 GeV is slightly lower than that at 200 GeV, and that the measured universal scaling breakdowns in peripheral CuCu.
For various hadron species the measured results as a function of are well scaled by quark number. Interestingly, it appears that this scaling holds also for higher orders in azimuthal anisotropy Adare et al. . The scaling performs better than scaling, particularly in the intermediate transverse momentum region ( = 1–4 GeV/). This scaling property suggests that the matter flows with quark-like degrees of freedom, and therefore is consistent with the formation of QGP matter Adare et al. (2007). A small deviation from scaling can be seen for both AuAu and CuCu collisions, and this deviation depends on the number of participants . This deviation might indicate a restricted region where scaling works well, possibly dependent on the strength of the radial flow.
For both AuAu to CuCu collisions, we confirm that can be normalized by participant eccentricity () Alver et al. (2007). This indicates that the effect of initial geometrical anisotropy can be partially removed by eccentricity normalization. However, normalized by still depends on , is not fully determined by alone and we have empirically found that / is proportional to . The initial participant size , is related to a length scale or an expansion time scale. Taking account all scalings and normalization, the data “/// vs. /” lie on a universal curve for / GeV.
ACKNOWLEDGMENTS
We thank the staff of the Collider-Accelerator and Physics Departments at Brookhaven National Laboratory and the staff of the other PHENIX participating institutions for their vital contributions. We acknowledge support from the Office of Nuclear Physics in the Office of Science of the Department of Energy, the National Science Foundation, Abilene Christian University Research Council, Research Foundation of SUNY, and Dean of the College of Arts and Sciences, Vanderbilt University (U.S.A), Ministry of Education, Culture, Sports, Science, and Technology and the Japan Society for the Promotion of Science (Japan), Conselho Nacional de Desenvolvimento Científico e Tecnológico and Fundação de Amparo à Pesquisa do Estado de São Paulo (Brazil), Natural Science Foundation of China (P. R. China), Ministry of Education, Youth and Sports (Czech Republic), Centre National de la Recherche Scientifique, Commissariat à l’Énergie Atomique, and Institut National de Physique Nucléaire et de Physique des Particules (France), Bundesministerium für Bildung und Forschung, Deutscher Akademischer Austausch Dienst, and Alexander von Humboldt Stiftung (Germany), National Science Fund, OTKA, Károly Róbert University College, and the Ch. Simonyi Fund (Hungary), Department of Atomic Energy (India), Israel Science Foundation (Israel), National Research Foundation and WCU program of the Ministry Education Science and Technology (Korea), Ministry of Education and Science, Russian Academy of Sciences, Federal Agency of Atomic Energy (Russia), VR and Wallenberg Foundation (Sweden), the U.S. Civilian Research and Development Foundation for the Independent States of the Former Soviet Union, the US-Hungarian NSF-OTKA-MTA, and the US-Israel Binational Science Foundation.
References
- Adcox et al. (2005) K. Adcox et al. (PHENIX Collaboration), “Formation of dense partonic matter in relativistic nucleus-nucleus collisions at RHIC: Experimental evaluation by the PHENIX Collaboration,” Nucl. Phys. A 757, 184 (2005).
- Adams et al. (2005) J. Adams et al. (STAR Collaboration), “Experimental and theoretical challenges in the search for the quark gluon plasma: The STAR Collaboration’s critical assessment of the evidence from RHIC collisions,” Nucl. Phys. A 757, 102 (2005).
- Back et al. (2005) B. B. Back et al. (PHOBOS Collaboration), “The PHOBOS perspective on discoveries at RHIC,” Nucl. Phys. A 757, 28 (2005).
- Arsene et al. (2005) I. Arsene et al. (BRAHMS Collaboration), “Quark gluon plasma and color glass condensate at RHIC? The Perspective from the BRAHMS experiment,” Nucl. Phys. A 757, 1 (2005).
- Adler et al. (2003) S. S. Adler et al. (PHENIX Collaboration), “Elliptic flow of identified hadrons in Au+Au collisions at = 200 GeV,” Phys. Rev. Lett. 91, 182301 (2003).
- Bleicher and Stoecker (2002) M. Bleicher and H. Stoecker, “Anisotropic flow in ultrarelativistic heavy ion collisions,” Phys. Lett. B 526, 309 (2002).
- Adare et al. (2007) A. Adare et al. (PHENIX Collaboration), “Scaling properties of azimuthal anisotropy in Au+Au and Cu+Cu collisions at = 200 GeV,” Phys. Rev. Lett. 98, 162301 (2007).
- Adare et al. (2012) A. Adare et al. (PHENIX Collaboration), “Deviation from quark-number scaling of the anisotropy parameter of pions, kaons, and protons in Au+Au collisions at =200 GeV,” Phys. Rev. C 85, 064914 (2012).
- Heinz and Snellings (2013) U. Heinz and R. Snellings, “Collective flow and viscosity in relativistic heavy-ion collisions,” Ann. Rev. Nucl. Part. Sci. 63, 123 (2013).
- Ollitrault (1992) J.-Y. Ollitrault, “Anisotropy as a signature of transverse collective flow,” Phys. Rev. D 46, 229 (1992).
- Niemi et al. (2012) H. Niemi, G.S. Denicol, P. Huovinen, E. Molnar, and D.H. Rischke, “Influence of a temperature-dependent shear viscosity on the azimuthal asymmetries of transverse momentum spectra in ultrarelativistic heavy-ion collisions,” Phys. Rev. C 86, 014909 (2012).
- (12) H. Song, S. A. Bass, U. Heinz, T. Hirano, and C. Shen, “Hadron spectra and elliptic flow for 200 A GeV Au+Au collisions from viscous hydrodynamics coupled to a Boltzmann cascade,” Phys. Rev. C 83, 054910 (2011); Erratum: ibid 86, 059903E (2012)].
- Soltz et al. (2013) R. A. Soltz, I. Garishvili, M. Cheng, B. Abelev, A. Glenn, J. J. Newby, L. A. LindenL̃evy, and S. Pratt, “Constraining the initial temperature and shear viscosity in a hybrid hydrodynamic model of =200 GeV Au+Au collisions using pion spectra, elliptic flow, and femtoscopic radii,” Phys. Rev. C 87, 044901 (2013).
- Aamodt et al. (2010) K Aamodt et al. (ALICE Collaboration), “Charged-particle multiplicity density at mid-rapidity in central Pb-Pb collisions at =2.76 TeV,” Phys. Rev. Lett. 105, 252301 (2010).
- Aad et al. (2012) G. Aad et al. (ATLAS Collaboration), “Measurement of the azimuthal anisotropy for charged particle production in =2.76 TeV lead-lead collisions with the ATLAS detector,” Phys. Rev. C 86, 014907 (2012).
- Chatrchyan et al. (2013a) S. Chatrchyan et al. (CMS Collaboration), “Measurement of the elliptic anisotropy of charged particles produced in PbPb collisions at =2.76 TeV,” Phys. Rev. C 87, 014902 (2013a).
- Abelev et al. (2013) B. Abelev et al. (ALICE Collaboration), “Anisotropic flow of charged hadrons, pions and (anti-)protons measured at high transverse momentum in Pb-Pb collisions at =2.76 TeV,” Phys. Lett. B 719, 18 (2013).
- (18) B. B. Abelev et al. (ALICE Collaboration), “Elliptic flow of identified hadrons in Pb-Pb collisions at = 2.76 TeV,” ArXiv:1405.4632.
- Adamczyk et al. (2013) L. Adamczyk et al. (STAR Collaboration), “Elliptic flow of identified hadrons in Au+Au collisions at 7.7-62.4 GeV,” Phys. Rev. C 88, 014902 (2013).
- Abelev et al. (2010) B. I. Abelev et al. (STAR Collaboration), “Charged and strange hadron elliptic flow in Cu+Cu collisions at = 62.4 and 200 GeV,” Phys. Rev. C 81, 044902 (2010).
- Adare et al. (2013) A. Adare et al. (PHENIX Collaboration), “Quadrupole Anisotropy in Dihadron Azimuthal Correlations in Central Au Collisions at =200 GeV,” Phys. Rev. Lett. 111, 212301 (2013).
- Khachatryan et al. (2010) V. Khachatryan et al. (CMS Collaboration), “Observation of Long-Range Near-Side Angular Correlations in Proton-Proton Collisions at the LHC,” J. High Energy Phys. 1009, 091 (2010).
- Chatrchyan et al. (2013b) S. Chatrchyan et al. (CMS Collaboration), “Observation of long-range near-side angular correlations in proton-lead collisions at the LHC,” Phys. Lett. B 718, 795 (2013b).
- Afanasiev et al. (2009a) S. Afanasiev et al. (PHENIX Collaboration), “Systematic Studies of Elliptic Flow Measurements in Au+Au Collisions at = 200 GeV,” Phys. Rev. C 80, 024909 (2009a).
- Adcox et al. (2003a) K. Adcox et al. (PHENIX Collaboration), “PHENIX detector overview,” Nucl. Instrum. Methods Phys. Res., Sec. A 499, 469 (2003a).
- Aizawa et al. (2003) M. Aizawa et al. (PHENIX Collaboration), “PHENIX central arm particle ID detectors,” Nucl. Instrum. Methods Phys. Res., Sec. A 499, 508 (2003).
- Adcox et al. (2003b) K. Adcox et al. (PHENIX Collaboration), “Construction and performance of the PHENIX pad chambers,” Nucl. Instrum. Methods Phys. Res., Sec. A 497, 263 (2003b).
- Aphecetche et al. (2003) L. Aphecetche et al. (PHENIX Collaboration), “PHENIX calorimeter,” Nucl. Instrum. Methods Phys. Res., Sec. A 499, 521 (2003).
- Adler et al. (2005) S. S. Adler et al. (PHENIX Collaboration), “Systematic studies of the centrality and dependence of the d E(T) / d eta and d (N(ch) / d eta in heavy ion collisions at mid-rapidity,” Phys. Rev. C 71, 034908 (2005).
- Alver et al. (2007) B. Alver et al. (PHOBOS Collaboration), “System size, energy, pseudorapidity, and centrality dependence of elliptic flow,” Phys. Rev. Lett. 98, 242302 (2007).
- Miller et al. (2007) M. L. Miller, K. Reygers, Stephen J. Sanders, and Peter Steinberg, “Glauber modeling in high energy nuclear collisions,” Ann. Rev. Nucl. Part. Sci. 57, 205 (2007).
- Mitchell et al. (2002) J. T. Mitchell et al. (PHENIX Collaboration), “Event reconstruction in the PHENIX central arm spectrometers,” Nucl. Instrum. Methods Phys. Res., Sec. A 482, 491 (2002).
- Adler et al. (2004) S. S. Adler et al. (PHENIX Collaboration), “High charged hadron suppression in Au + Au collisions at GeV,” Phys. Rev. C 69, 034910 (2004).
- Adler et al. (2006) S. S. Adler et al. (PHENIX Collaboration), “Jet structure from dihadron correlations in d+Au collisions at = 200 GeV,” Phys. Rev. C 73, 054903 (2006).
- Poskanzer and Voloshin (1998) A. M. Poskanzer and S. A. Voloshin, “Methods for analyzing anisotropic flow in relativistic nuclear collisions,” Phys. Rev. C 58, 1671 (1998).
- Adare et al. (2010) A. Adare et al. (PHENIX Collaboration), “Elliptic and hexadecapole flow of charged hadrons in Au+Au collisions at =200 GeV,” Phys. Rev. Lett. 105, 062301 (2010).
- Afanasiev et al. (2009b) S. Afanasiev et al. (PHENIX Collaboration), “Kaon interferometric probes of space-time evolution in Au+Au collisions at = 200 GeV,” Phys. Rev. Lett. 103, 142301 (2009b).
- Adler et al. (2002) C. Adler et al. (STAR Collaboration), “Elliptic flow from two and four particle correlations in Au+Au collisions at = 130 GeV,” Phys. Rev. C 66, 034904 (2002).
- Abelev et al. (2007) B. I. Abelev et al. (STAR Collaboration), “Mass, quark-number, and dependence of the second and fourth flow harmonics in ultra-relativistic nucleus-nucleus collisions,” Phys. Rev. C 75, 054906 (2007).
- Voloshin et al. (2008) S. A. Voloshin, A. M. Poskanzer, and R. Snellings, “Collective phenomena in non-central nuclear collisions,” (2008), arXiv:0809.2949.
- Borghini (2006) N. Borghini, “Hints of incomplete thermalization in RHIC data,” Eur. Phys. J. A 29, 27 (2006).
- Uphoff et al. (2015) J. Uphoff, F. Senzel, O. Fochler, C. Wesp, Z. Xu, et al., “Elliptic flow and nuclear modification factor in ultrarelativistic heavy-ion collisions within a partonic transport model,” Phys. Rev. Lett. 114, 112301 (2015).
- (43) A. Adare et al. (PHENIX Collaboration), “Measurement of the higher-order anisotropic flow coefficients for identified hadrons in AuAu collisions at = 200 GeV,” ArXiv:1412.1038.