Investigating Broadband Variability of the TeV Blazar 1ES 1959+650
Abstract
We summarize broadband observations of the TeV-emitting blazar 1ES 1959+650, including optical R-band observations by the robotic telescopes Super-LOTIS and iTelescope, UV observations by Swift UVOT, X-ray observations by the Swift X-ray Telescope (XRT), high-energy gamma-ray observations with the Fermi Large Area Telescope (LAT) and very-high-energy (VHE) gamma-ray observations by VERITAS above 315 GeV, all taken between 17 April 2012 and 1 June 2012 (MJD 56034 and 56079). The contemporaneous variability of the broadband spectral energy distribution is explored in the context of a simple synchrotron self Compton (SSC) model. In the SSC emission scenario, we find that the parameters required to represent the high state are significantly different than those in the low state. Motivated by possible evidence of gas in the vicinity of the blazar, we also investigate a reflected-emission model to describe the observed variability pattern. This model assumes that the non-thermal emission from the jet is reflected by a nearby cloud of gas, allowing the reflected emission to re-enter the blob and produce an elevated gamma-ray state with no simultaneous elevated synchrotron flux. The model applied here, although not required to explain the observed variability pattern, represents one possible scenario which can describe the observations. As applied to an elevated VHE state of 66% of the Crab Nebula flux, observed on a single night during the observation period, the reflected-emission scenario does not support a purely leptonic non-thermal emission mechanism. The reflected emission model does, however, predict a reflected photon field with sufficient energy to enable elevated gamma-ray emission via pion production with protons of energies between 10 and 100 TeV.
1 Introduction
1ES 1959+650, a blazar at =0.047 (Scatcher et al., 1993), was among the first-detected extragalactic very-high-energy (VHE; 100 GeV) emitters (Holder et al., 2003). This blazar has recently been observed by VERITAS at approximately Crab Nebula flux111The Crab Nebula is a bright VHE source, roughly characterized with a power-law index of =2.5 in the VHE band, where . This source has an integral flux of approximately 1.2 ph cm-2s-1 above 315 GeV, according to the fit to the VHE data in Albert et al. (2008). above 1 TeV (Aliu et al., 2013). A blazar is a type of active galactic nucleus (AGN) having a relativistic jet that is oriented close to the line of sight of the observer. The non-thermal radiation from blazars, thought to originate from within the jet, produces a double-humped spectral energy distribution (SED).
The lower-energy component of the SED, referred to as the synchrotron component, results from the synchrotron radiation of relativistic leptons in the presence of a tangled magnetic field. The higher-energy component, hereafter referenced as the gamma-ray component, can be attributed to inverse-Compton up-scattering by the relativistic particles within the jet of either the synchrotron photons themselves (synchrotron self-Compton emission: SSC) or a photon field external to the jet (external-Compton emission: EC). The photon fields may arise from emission by the accretion disk, a broad line region or a dusty torus, as described in Dermer et al. (1992), Maraschi et al. (1992), Marscher & Protheroe (2000) and Sikora et al. (1994). Hadronic processes initiated by relativistic protons (such as pion production and the resulting cascade emission) can similarly produce a gamma-ray component (Aharonian et al., 2002; Bednarek, 1993; Dar et al., 1997; Mannheim, 2000; Mücke & Protheroe, 2000; Pohl & Schlickeiser, 2000).
The non-thermal emission resulting from these different processes can produce nearly indistinguishable time-averaged SEDs, as discussed in Tagliaferri et al. (2008), making emission-model discrimination based on non-simultaneous data uncertain. An effective means to investigate blazar emission mechanisms is through the observation and subsequent modeling of broadband spectral variability (Coppi et al., 1999; Böttcher, 2007; Krawczynski et al., 2002). There is some evidence that for many objects the low-energy and high-energy peaks vary in concert (e.g. Mrk 421: Fossati et al. (2008), Mrk 501: Krawczynski et al. (2000)). Correlated variability between the low and high-energy SED components can be well described by a simple SSC model, whereas less-common, uncorrelated variability patterns, similar to the “orphan” flaring event observed from 1ES 1959+650 (Krawczynski et al., 2004), require more complex emission scenarios. This type of non-correlated variability has been described using multiple-zone SSC emission, EC emission, a model including a magnetic field aligned along the jet axis, hadronic emission and reflected emission scenarios (Krawczynski et al., 2004; Graff et al., 2008; Kusunose & Takahara, 2006; Böttcher, 2005).
The central engines of AGNs have multiple components, possibly including various gas and dust tori and clouds. These clouds can scatter some of the continuum emission from the accretion disk and from the jet. As this process may be common to AGN, although at different scales, we include the evaluation of reflected-emission in the theoretical discussion of our results. A reflected-emission scenario requires the non-thermal emission region to be in close proximity to a dilute gas. In this paradigm, the gas reflects synchrotron emission via Thompson scattering back to the non-thermal emission region, providing an external photon field to be up-scattered. The broadband variability pattern resulting from such an emission geometry would be displayed as an elevated state of the gamma-ray component alone.
Evidence from millimeter (Fumagalli et al., 2012) and X-ray observations (Furniss et al., 2013) of 1ES 1959+650 support the existence of intervening gas within the blazar and, therefore, the application of a reflected-emission scenario to broadband variability of the source. More specifically, 1ES 1959+650 shows evidence for additional gas in the vicinity of the host galaxy from X-ray absorption in excess to that expected by the Galactic column, as well as a positive detection of molecular CO within the blazar.
In this work we summarize broadband variability of 1ES 1959+650 detected during multiwavelength observations between 17 April 2012 and 1 June 2012 (MJD 56034 and 56079). These observations include 0.7 ks of strictly simultaneous VERITAS and Swift observations on MJD 56067, occurring at the beginning of a VHE flare lasting approximately two hours. A simple SSC emission scenario is applied to the data to investigate which parameter changes are required to produce the observed variability. Motivated by the recent evidence for intervening gas within 1ES 1959+650, we also investigate a possible explanation of the broadband variability through the application of a reflected-emission scenario. We summarize the multiwavelength observations and analysis in Sections 2. The models are applied to the data in Section 3, and the implications of each model application are discussed in Section 4. Throughout this work, the term “flare“ is used to denote an elevated state of at least five times the average flux measured over the period of observations, with at least a deviation from the average (calculated without inclusion of any “flaring” state.)
2 Broadband Observations
2.1 VERITAS
VERITAS is an array of four imaging atmospheric Cherenkov telescopes in southern Arizona, each with a 3.5∘ field of view. The array is sensitive to photons with energies from 100 GeV to more than 10 TeV and can detect a 1% Crab-Nebula-flux source at 5 standard deviations () in less than 28 hours. The telescope array uses 12-meter reflectors to focus dim, blue/UV Cherenkov light from gamma-ray and cosmic-ray interactions in the atmosphere onto cameras composed of 499 photomultiplier tubes (PMTs). More details on the VERITAS instrument can be found in Holder et al. (2006) and Weekes et al. (2002).
A historically high optical state of 1ES 1959+650 (R-band of 13.8 magnitude, as measured by the Super-LOTIS robotic telescope; Williams et al. 2008), prompted near-nightly VERITAS exposures over two dark runs222A dark run is the period between two consecutive full moons. between 17 April 2012 and 1 June 2012 (MJD 56034-56079). Observations were carried out in wobble mode, with exposures taken at 0.5∘ offset in each of the four cardinal directions from 1ES 1959+650, in order to facilitate simultaneous background measurements (Fomin et al., 1994; Berge et al., 2007). The total exposure over the two dark runs resulted in 8.7 hours of quality-selected live time which was collected at an average zenith angle of 37∘.
Elliptical moments of the recorded images are calculated and used to discriminate background cosmic-ray events from gamma-ray events. The data are first cleaned with “quality cuts”, discarding any telescope images involving fewer than five PMTs or images with centroids at greater than 1.43∘ from the camera center. Additionally, each image is required to have a total “size” (a measure of total Cherenkov light collected by the camera) of more than 80 photoelectrons.
Single-telescope image widths and lengths are combined into mean-scaled-width (MSW) and mean-scaled-length (MSL) parameters for each array event, as described in Cogan (2008) and Daniel (2008). Only array events with 0.05 MSW 1.25, 0.05 MSL 1.1, a reconstructed height of shower maximum greater than 7 km above the array, and having a reconstruction direction within 0.1∘ of 1ES 1959+650 are kept as candidate signal (ON) events. The background (OFF) events are those which pass all aforementioned cuts and fall within 0.1∘-radius circular regions at the same radial distance as the source from the center of the camera. The source significance is calculated from the number of events falling in these ON and OFF regions according to Equation 17 of Li & Ma (1983). The analysis of the VHE source signal is confirmed with two independent analysis packages.
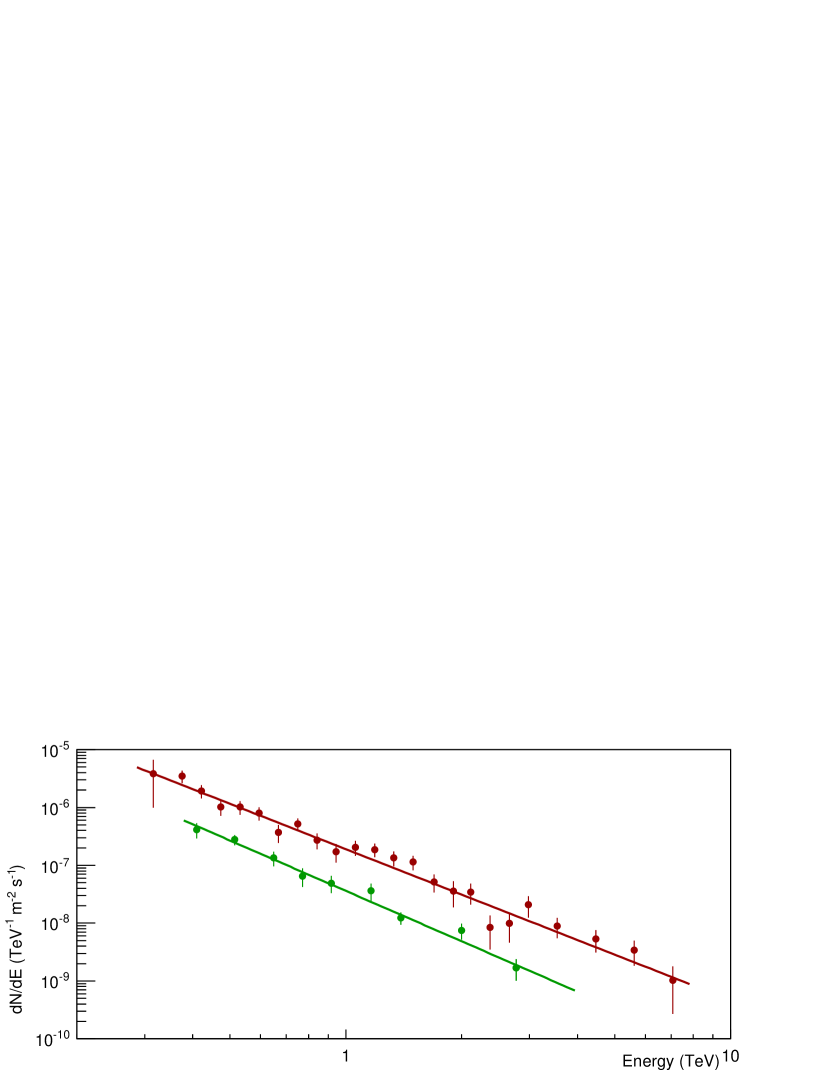
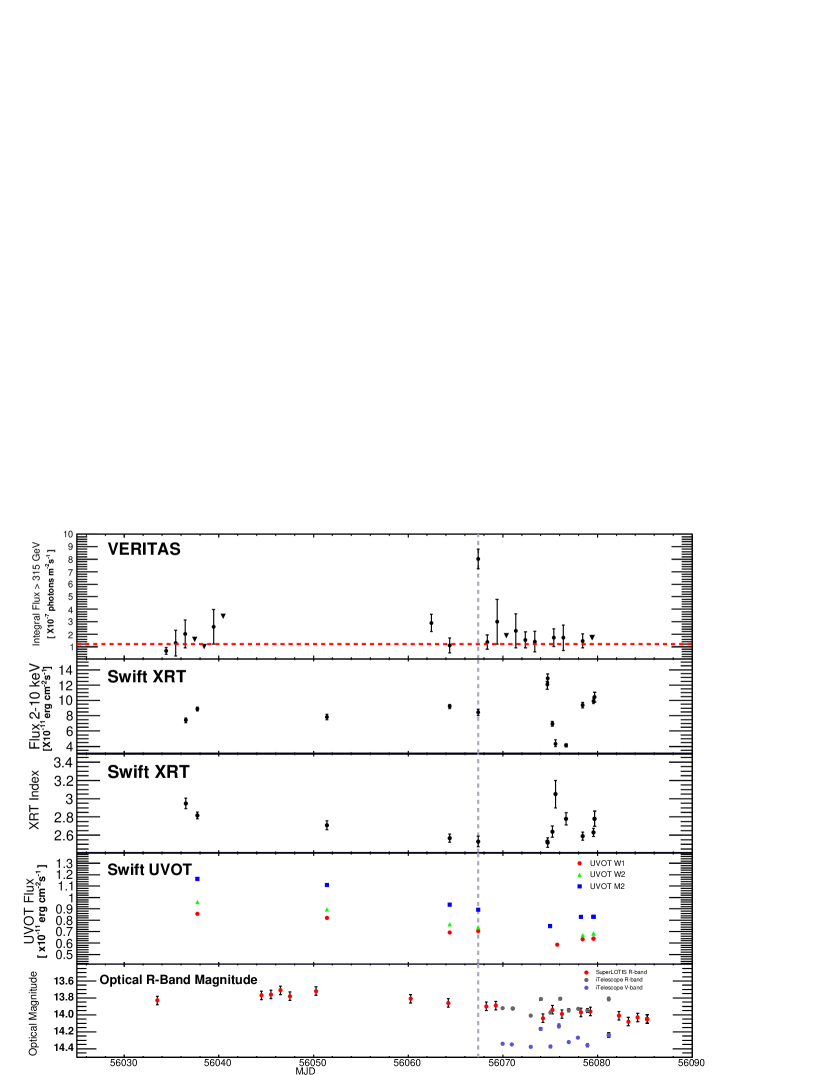
The total VERITAS exposure between 17 April 2012 and 1 June 2012 (MJD 56034 to 56079) resulted in 517 ON events and 1175 OFF events (corresponding to 410 excess events with an averaged background normalization parameter of 0.0909) and an overall detection significance of 31. The VERITAS spectral data are derived with systematically coarser binning with increasing energy and are fit with a differential power law of the form , where is fixed at 1 TeV and is the normalization parameter. Variability was detected during these observations, as can be seen by the source spectra in Figure 1 and in the top panel of the broadband light curve presented in Figure 2. The upper limits represent 95% confidence upper limits, calculated according to Rolke et al. (2005). A -squared test shows less than 6.4 probability of a steady VHE flux. Table 1 contains a summary of the VHE analysis and spectral states of 1ES 1959+650 during the two dark runs (MJD 56034-56040 and 56064-56079) as well as, separately, the night where an elevated VHE state was detected (MJD 56067). This flare is excluded from the dark run analysis results. The results are shown with statistical errors only in Table 1. The systematic error on the energy scale is estimated between 20 and 35%.
The hour-scale exposures during the first dark run show the blazar to be at an average flux of (8.63.6) ph m-2s-1 above the observational energy threshold of 315 GeV (approximately 8% of the Crab Nebula flux above this same threshold). The first dark-run observations are paired with two contemporaneous Swift exposures, described in Section 2.3.
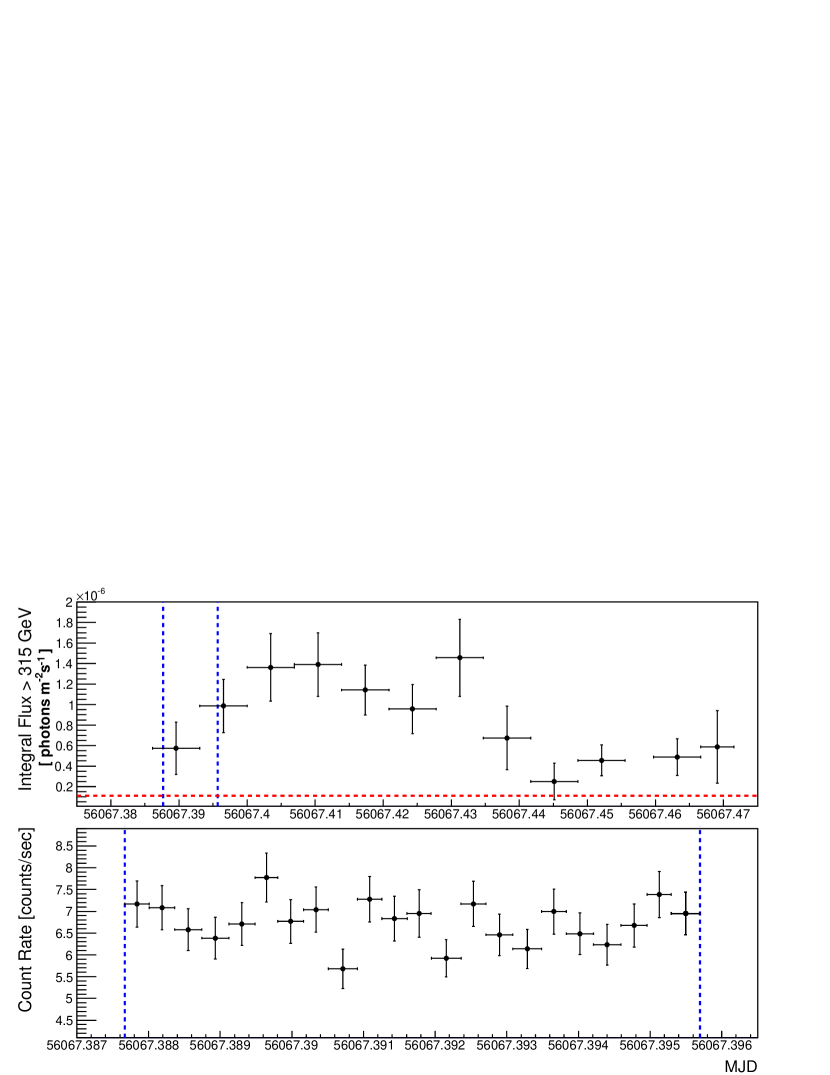
On MJD 56067, VERITAS detected a short-lived VHE flare of 1ES 1959+650. These observations show the blazar flux to rise from 50% to 120% of the Crab Nebula in less than 30 minutes (see top panel of Figure 3). The rise in flux was immediately followed by a decay, dropping back to of the Crab Nebula approximately 90 minutes after the start of the event. The probability that the blazar flux on MJD 56067 was constant is less than 0.2% (see Figure 3, with 11 degrees of freedom). The first 0.7 ks (12 minutes) of the VERITAS observations of the flaring event on MJD 56067 were matched with simultaneous Swift observations, described in Section 2.3. VERITAS continued to observe 1ES 1959+650 through 1 June 2012, detecting the source at an average of 12% Crab Nebula flux (1.50.2 ph m-2s-1 above 315 GeV).
2.2 Fermi Large Area Telescope
The Fermi Large Area Telescope (LAT) is a space-based telescope that typically monitors the entire high-energy gamma-ray sky from below 30 MeV to 300 GeV every three hours (Atwood et al., 2009). The instrument has better than 10% energy resolution, with an angular resolution of better than 0.15∘ for energies greater than 10 GeV.
Spectral analysis was completed for the period between (MJD 56054 to 56082) with the intention to search for an elevated gamma-ray state occurring contemporaneously with the elevated VHE states observed on MJD 56062 and MJD 56067. All analysis was completed with FermiTools v9r27p1. Events were extracted from a 30∘-radius region centered on the 1ES 1959+650 coordinates. “Diffuse class” events with zenith angle of and energy between 300 MeV and 300 GeV were selected. In order to reduce contamination from Earth-limb gamma rays, only data taken while the rocking angle of the satellite was less than 52∘ were used. The significance and spectral parameters were calculated using the unbinned maximum-likelihood method gtlike with the P7SOURCE_V6 instrument-response functions. The background model was constructed to include nearby ( away) gamma-ray sources from the second Fermi LAT catalog (2FGL, Nolan, P. et al. 2012) as well as diffuse emission.
As in the 2FGL catalog, a log-parabolic function was used for nearby sources with significant spectral curvature and a power law for those sources without spectral curvature. The spectral parameters of sources within 7∘ of 1ES 1959+650 were left free during fitting, while those outside of this range were held fixed to the 2FGL catalog values. The Galactic diffuse emission was modeled with the file gal_2yearp7v6_v0.fits and the isotropic emission component was modeled with the file iso_p7v6source.txt.333Available at http://fermi.gsfc.nasa.gov/ssc/data/analysis/software/aux.
The analysis of LAT data between MJD 56054 and 56082 results in a test statistic (TS; Mattox et al. 1996) of 97 above 100 MeV. The spectral fitting shows the source to be in a slightly elevated state as compared to the 2FGL value (less than double the 2FGL integral flux of F ph cm-2s-1), with an integral flux of (1.6 ph cm-2s-1 above 1 GeV and a spectral index of 1.9.
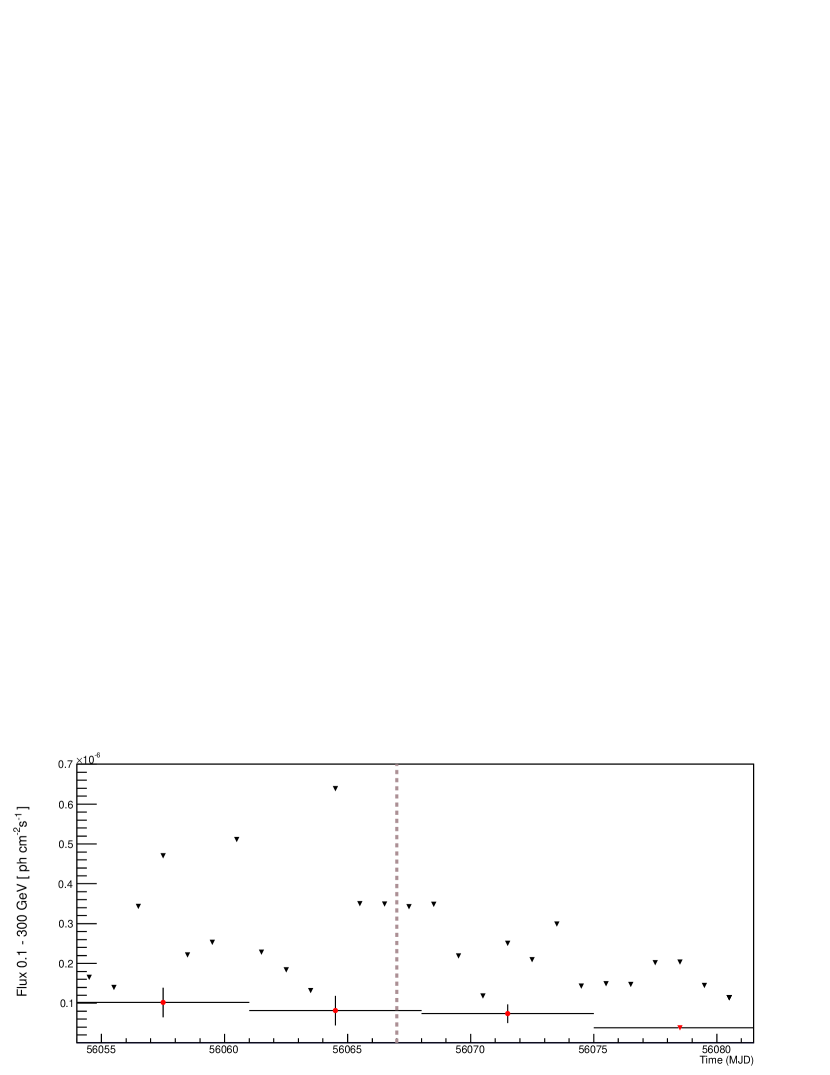
The data were binned in time to search for evidence of an elevated gamma-ray flux (see Figure 4). No evidence for variability on weekly timescales is found; the data are consistent with a steady flux at the 99.75% confidence level (=0.648 for 3 degrees of freedom). The LAT observations do not provide sufficient statistics for a more detailed investigation of variability, i.e. on daily timescales, which result in time-bin TS values of less than 9. Upper limits at 95% confidence are derived for daily LAT exposures of 1ES 1959+650 and are displayed in Figure 4 by downward pointing arrows.
2.3 Swift XRT
The Swift X-ray Telescope (XRT) is a space-based grazing-incidence Wolter-I telescope which focuses X-rays between 0.2 keV and 10 keV onto a 110 cm2 CCD (Gehrels et al., 2004). The Swift telescope took 16 windowed timing (WT) exposures of 1ES 1959+650 between 19 April 2012 and 1 June 2012 (MJD 56036 - 56079), each between 0.5 ks and 1.5 ks long. The exposure on MJD 56067 is strictly simultaneous with VERITAS observations.
The data were analyzed using the HEASoft package Version 6.12. Rectangular source regions of length and width 45 pixels and 8 pixels, respectively, were used. Similarly sized regions of nearby source-free sky were used to estimate the background. The exposures were grouped to ensure a minimum of 20 counts per bin and were fitted with an absorbed power-law model of the form keV, with a free neutral hydrogen column density parameter , as in Furniss et al. (2013), to allow for additional absorption of soft X-rays by intervening gas in the vicinity of the blazar or along the line of sight. The model also contains a fitted normalization parameter and the non-Thompson energy-dependent photoelectric cross section , as taken from Morrison & McCammon (1983).
The flux and indices derived from the Swift XRT observations of 1ES 1959+650 are shown in the second and third panels from the top in Figure 2 and are summarized in Table 2. The fitted was consistently 2 times higher than the Galactic value of 1cm-2, as measured by the LAB survey (Kalberla et al., 2005). The integral 2-10 keV flux recorded by the XRT ranged between 4.2 erg cm-2s-1 and 12.9 erg cm-2s-1 with an average flux of 7.5 erg cm-2s-1, with photon indices ranging from to 3.1.
The X-ray emission displayed by 1ES 1959+650 is relatively steady in the first five exposures. The exposure on 20 May 2012 (MJD 56067) is the only strictly simultaneous Swift observation with VERITAS, overlapping with the first 0.7 ks ( minutes) of VERITAS observations during the VHE flare from 1ES 1959+650. The steady 0.3 - 10 keV count rate observed by XRT (as shown in the bottom panel of Figure 3) shows that at least the first 12 minutes of the VHE flaring episode is not matched with a simultaneous elevated X-ray state.
The Swift-XRT observations on MJD 56074 show the blazar to be in an elevated state with a flux level of erg cm-2s-1, nearly twice the average of 7.5 erg cm-2s-1. This high state is observed to drop to approximately half the average (4.0 erg cm-2s-1) in less than two days. No contemporaneous high state is observed in the VERITAS data, but no firm conclusions can be drawn due to the non-simultaneous nature of the exposures.
2.4 UV and Optical
Swift UVOT The Swift-XRT observations were supplemented with simultaneous UVOT exposures taken in the UVW1, UVM2, and UVW2 bands (Poole et al., 2008). The UVOT photometry is performed using the HEASoft program uvotsource. The source region consists of a single circle with radius, while the background region consists of several 15-radius circles of the nearby sky lacking visible sources. The results are corrected for reddening using E(B-V) coefficients from Schlegel et al. (1998), with the Galactic extinction coefficients applied according to Fitzpatrick (1999). The largest source of error derived for the intrinsic flux points is due to the uncertainty in the reddening coefficients E(B-V). The UVOT W1, W2 and M2 flux values derived from the observations are shown in Figure 2 (fourth panel from the top), and summarized in detail in Table 3. These exposures show relatively steady flux values, with a small decrease of up to MJD 56074, the day where an elevated X-ray state was observed with XRT.
Super-LOTIS The Super-LOTIS robotic 0.6-meter telescope located on Kitt Peak in Arizona took R-band exposures of 1ES 1959+650 between MJD 56034 and MJD 56080. During each night, three individual frames were acquired with the standard Johnson-Cousins R-band filter. Each image was reduced using an analysis pipeline that, after subtracting the bias and the dark current, combines the flat-fielded frames in a single image for each night. Aperture photometry with a circular aperture of 15 was performed for both the blazar and each of the seven reference stars detailed in the Landessternwarte Heidelberg-Königstuhl catalogue444http://www.lsw.uni-heidelberg.de/projects/extragalactic/charts/ with a circular aperture of 15. This aperture is large enough to encompass all the light enclosed in the irregular PSF. The local sky level is computed in a circular annulus of inner/outer radius of 18/25. The final flux values for 1ES 1959+650 are calculated by applying the photometric zero-point derived for each night, comparing the instrumental magnitude of the reference stars to the known magnitudes in the R-band.
The R-band monitoring data from Super-LOTIS are shown in the bottom panel of Figure 2 and are summarized in Table 4. The observations show a relatively steady optical magnitude of between 13.8 and 14.0, with a conservative photometry error estimate of 0.1 optical magnitude.
iTelescope V-band and R-band exposures were taken by iTelescope between MJD 56028 and 56080. iTelescope is a robotic telescope system located in Nerpio, Spain 555http://www.itelescope.net/. The telescopes used are twins (T07 and T18), and are each of 431 mm (17-inch) aperture at /6.8. They employ an SBIG STL-1100M CCD camera. The V filter is a standard Johnson-Cousins set. The R filter is not standard and requires a color correction, where the addition of approximately 0.040 optical magnitude transfers the non-standard filter magnitudes to the standard Johnson-Cousins R. The data were reduced with MIRA Pro Version 7.0. The reduction is with standard aperture (radius of 5) photometry, using the same standard stars as were used for the Super-LOTIS data reduction.
The V-band and R-band data are shown in the bottom panel of Figure 2 and summarized in Table 4. These observations show elevated luminosity in both the V and R bands (by approximately 0.2 optical magnitude) on two of the days where Super-LOTIS also provides R-band measurements approximately 7.5 hours after the iTelescope exposures were taken (shown in bold in Table 4). Comparison with the contemporaneous Super-LOTIS R-band measurements suggests that the blazar exhibits a small level of intranight variability. This fast variability occurs on the same night as the X-ray flux is observed to be high.
2.5 Summary of Observations
The broadband observations summarized above show a VHE flare on MJD 56067, where no elevated X-ray state is observed simultaneously for the first 12 minutes of the VHE flaring event. Additional variability is observed over the full window of observation, including an X-ray flux increase and intranight X-ray variability on MJD 56075. The X-ray flux was observed to drop over the next two days, with no corresponding (non-simultaneous) change in VHE flux observed.
3 Modeling
3.1 Time Independent Description (SSC)
We apply a time-independent SSC model to the relatively low and elevated flux states of 1ES 1959+650 observed on MJD 56064 and 56067. Both of these days have sufficient multiwavelength coverage to provide a full view of the broadband spectral energy distribution. Since the VHE flux of 1ES 1959+650 observed on MJD 56064 is consistent with the average flux from the two dark runs (excluding the VHE state on MJD 56067), the VHE spectrum is represented by the spectrum averaged over the two dark runs. Moreover, the average LAT spectrum is used to represent both the low and high state since no significant variability was detected within the LAT energy band.
The SSC model applied to the data is described in detail in Böttcher et al. (2013). This model is an equilibrium SSC model with emission originating from a spherical region of relativistic electrons with radius . This region moves down the jet with a Lorentz factor . The jet is oriented such that the angle with respect to the line of sight is . In order to minimize the number of free parameters, the modeling is completed with , for which , where represents the Doppler boosting factor.
Electrons are injected into the spherical region with a power-law distribution of between the low- and high-energy cut-offs, . The electron distribution spectral indices used for 1ES 1959+650 are , which can be produced under acceleration in relativistic oblique shocks (Summerlin & Baring, 2012). In order to reach an equilibrium state, the model evaluates the steady state produced when considering particle injection, radiative cooling and particle escape. The particle escape is characterized with an efficiency factor , such that the escape timescale , with for this work, setting up an equilibrium scenario with a relatively long escape timescale for the relativistic particles. The variability timescale is determined by the light crossing timescale of the emitting region (). According to this SSC model, the particle distribution streams along the jet with a kinetic power . Synchrotron emission results from the presence of a tangled magnetic field , with a Poynting flux luminosity of . The parameters and allow the calculation of the equipartition parameter .
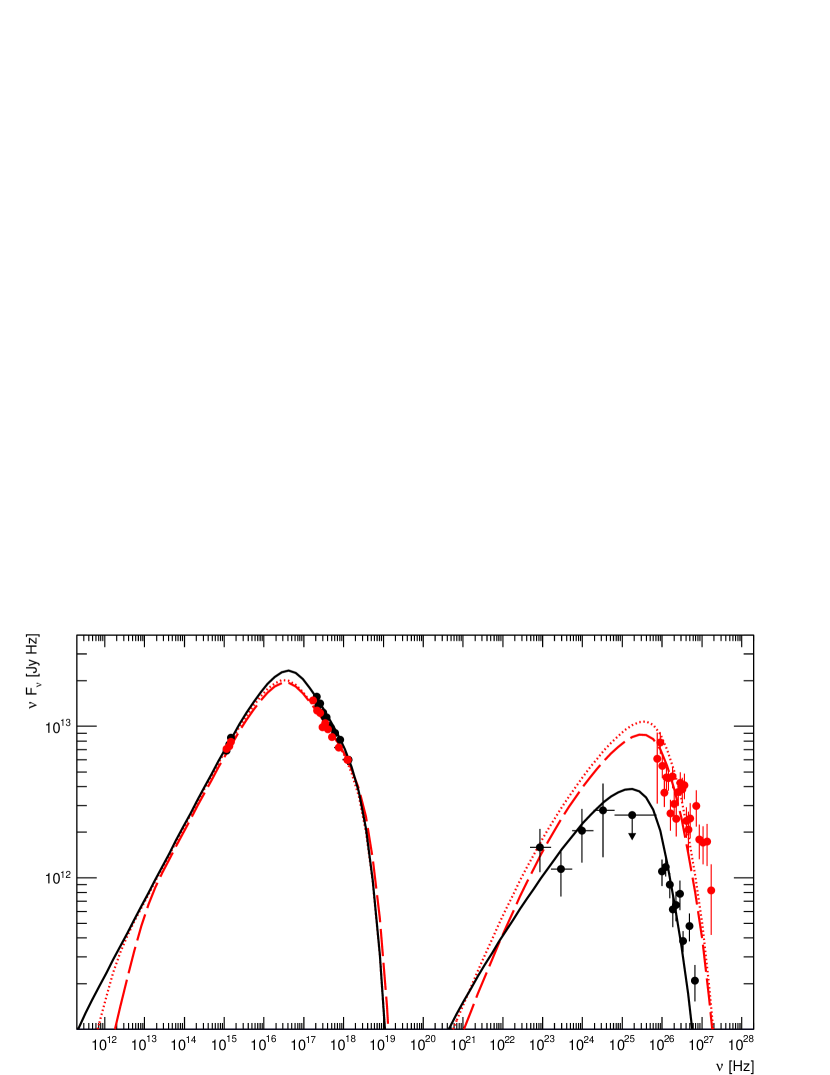
A reasonable description to the low state (MJD 56064) is achieved with the parameters summarized in Table 5, and displayed by the solid line in Figure 5. Starting from this low state representation, two possible scenarios are explored to describe the elevated VHE state observed on MJD 56067. In the first realization (Scenario I, dotted line in Figure 5), the gamma-ray peak was shifted to a slightly higher energy by increasing the low-energy cut-off (). In order to keep the synchrotron peak at the same energy, the magnetic field is lowered. The lower magnetic field results in a lower synchrotron power, requiring an increase in overall jet power () to achieve the same synchrotron luminosity. This emission scenario, however, over-shoots the gamma-ray flux unless the radius of the emission region is increased, lowering the compactness of the emission zone. The result of these parameter changes are shown by the dotted line in Figure 5, and summarized in the second column for Table 5. Under this representation, the variability timescale changes from 8.2 hours in the low state to 31 hours in Scenario I. This timescale is longer than the observed variability timescale on MJD 56067, where the VHE flux was observed to increase from 0.6 ph cm-2s-1 to 1.4 ph cm-2s-1 above 315 GeV in less than one hour.
The eight parameters (including ) which describe the SSC emission scenario are known to be degenerate. As a result, the parameter changes described in Scenario I are not the only changes which will account for the difference between the SEDs observed on MJD 56064 and MJD 56067. Alternatively, in addition to the changes to the and magnetic field, an increase of the Doppler factor instead of a change to the emission region size can provide a similar result (Scenario II, dashed line in Figure 5, third column of Table 5). With this scenario, the variability timescale is still left to be relatively short (5.1 hr), in agreement with the fast flux variability observed in the VHE band on MJD 56067.
As seen in Figure 5, both of the elevated state SSC scenarios predict an approximate doubling of the high-energy gamma-ray flux. This type of variability is impossible to rule out without detection of 1ES 1959+650 by the Fermi LAT on day timescales. The daily 95% confidence level upper limit on MJD 56067 (Figure 4) is more than double the LAT flux for the entire period (also used to derive the spectrum shown in the SED), indicating that the SSC-inferred LAT flux in an elevated state is still consistent with the observations. Therefore, the broadband SEDs of 1ES 1959+650 on MJD 56064 and MJD 56067 can be represented by a SSC emission model, necessitating multiple parameter changes from high states relative to low states in order to produce an elevated VHE state with no change to the synchrotron peak.
3.2 Time Dependent Description (Reflected-Emission)
In this section we present a possible scenario to describe the VHE variability detected during the contemporaneous multiwavelength observations of 1ES 1959+650. The main emphasis of our discussion is to show that the scenario can explain the data. Our choice in model is motivated, in part, by the evidence for intervening gas within the blazar. We apply a similar reflected-emission model to that which was used to describe the “orphan” flaring activity of 1ES 1959+650 (Böttcher, 2005). This model follows X-ray emission from a newly ejected component (blob) in the jet as it is reflected off dilute gas and/or dust in the vicinity of the jet. The reflected emission then re-enters the jet before the blob, which is moving down the jet, reaches the location of the reflector. The application of this model is notably distinct from that applied in Böttcher (2005), where for this application the incident flux on the cloud is integrated over the time it takes the blob to pass the reflecting cloud instead of taken from a single short-lived X-ray flaring period. This integration over the blob’s travel is necessary due to the assumed parsec-scale proximity of the blob to the reflecting cloud.
We assume that at a distance pc from the central engine, moderately dense clouds of gas and dust (hereafter referred to as the “mirror”) intercept the synchrotron emission from portions of the jet located inside , and reprocess part of this flux back into the jet trajectory. Following Böttcher (2005), the distance can be related to the observed time delay between the emergence of a new jet component from the core, and the (observer’s frame) time at which the new component intercepts the mirror. For a characteristic bulk Lorentz factor of the new component of , and a time delay of, for example, s:
| (1) |
according to which the new component would have emerged around MJD 56062 for and pc.
The accumulated and reprocessed jet-synchrotron flux will be intercepted by the blob within the time interval between emitting the first photons at the time of emergence of the new component, and intercepting the location of the cloud. This time is also characteristic of the time during which the cloud receives this flux, and can be estimated as is done in Böttcher (2005)
| (2) |
With this time scale, we can calculate an average flux received by the cloud as
| (3) |
where we have used an estimate of the quiescent synchrotron X-ray flux from 1ES 1959+650 of erg cm-2 s-1 (similar to the average found from the Swift XRT observations), and cm is the radius of the newly emerged jet component (the “blob”). For a characteristic density of the clouds of cm-3, this leads to an ionization parameter of
| (4) |
This implies that any dust is expected to be destroyed, and all gas to be highly ionized by the impinging X-ray emission. If the cloud is thermally reprocessing this flux, this would require an equilibrium temperature K, which also requires the gas to be highly ionized. We therefore conclude that the most likely mode of reprocessing the accumulated jet synchrotron emission is Compton reflection off free electrons in the highly ionized cloud. It is not necessary that this is the only cloud within the vicinity of the blazar, maintaining the possibility that there is additional neutral absorbing gas surrounding the blazar, as found in Furniss et al. (2013). We only assume that a blob moving relativistically down the jet passes sufficiently close to a cloud that radiation from the blob can temporarily ionize the cloud, so that for a short time the blob emission is reprocessed via Compton reflection off free electrons in the cloud. This ionized gas might also act as a shield to molecular gas such as CO, as predicted in photodissociation region models (e.g., Tielenn & Hollenbach 1985; Krumholz et al. 2009; Glover & Clark 2012).
The characteristic photon frequency of jet synchrotron photons from 1ES 1959+650 is Hz (see Figure 5), corresponding to a normalized photon energy of . Upon Compton reflection by the cloud, this will be boosted in the jet rest frame to . Therefore, any relativistic electrons (with ) will interact with these reflected photons in the Klein-Nishina regime, resulting in strongly suppressed Compton scattering, making the production of a gamma-ray flare after the emergence of a new blob within the jet unlikely in a purely leptonic scenario.
It can be seen that the bulk Lorentz factor of the blob is a critical unknown parameter in this model, with key derived parameters strongly depending on it. The observed synchrotron peak frequency of 1ES 1959+650 is Hz. Therefore, even without any blue-shifting from bulk motion, Compton scattering in the Thomson regime happens up to , corresponding to MeV. Therefore, even for , a synchrotron mirror scenario would not efficiently produce VHE -rays via Compton scattering.
Relativistic protons with Lorentz factors of , on the other hand, can interact with the reflected photons through pion production processes. Following the analysis in Böttcher (2005) and using the average flux , we find that producing a VHE -ray flare with a luminosity of erg s-1 requires a total number density of relativistic protons
| (5) |
where is the fraction of incident flux reflected by the cloud. We have assumed that the protons have a power-law distribution in energy with a low-energy cutoff at . This corresponds to a total (co-moving frame) energy in relativistic protons in the blob of
| (6) |
and a kinetic power in the jet, carried by relativistic protons, of
| (7) |
where is the filling factor of the jet, i.e., the fraction of the jet length occupied by plasma containing relativistic protons.
The power requirement in Eq. 7 is quite moderate if one allows for a plausible filling factor . Also, note the extremely strong dependence of the estimates in Eqs. 5 – 7 on the Lorentz factor. A value of just slightly above 10 will reduce all energy requirements to very reasonable values, corresponding to a population of relativistic protons with energies between 10 and 100 TeV.
4 Discussion and Conclusions
We report contemporaneous broadband observations of the VHE-emitting blazar 1ES 1959+650, including 0.7 ks of strictly simultaneous Swift and VERITAS observations occurring during a period of elevated VHE flux. This blazar has shown extreme flaring episodes with uncorrelated variation in the synchrotron and gamma-ray SED components in the past (Krawczynski et al., 2004), which could be described in a reflected non-thermal emission environment, with a blob of relativistic particles moving toward a dilute reflector made of gas or dust intrinsic to the blazar (Böttcher, 2005).
The application of an equilibrium SSC model to the relatively low and high states of 1ES 1959+650 on MJD 56064 and MJD 56067 is possible, with multiple parameter changes required for the synchrotron peak to remain unchanged during the elevated gamma-ray state. Two scenarios provide a reasonable representation of the observed VHE elevated state. One realization utilizes an increase in both the emission region size and low-energy cutoff while at the same time a decrease in the magnetic field. The second scenario is derived from increasing the Doppler factor instead of changing the emission region size. Both of these scenarios also predict an increase in the high-energy gamma-ray flux, which is not ruled out by the Fermi LAT daily upper limits. The second scenario (Scenario II) is preferred due to the hour-scale flux variability that is maintained with the parameter changes.
Motivated by the possibility of uncorrelated variability as well as compelling evidence for the existence of dilute gas in the vicinity of the blazar, we investigate these broadband observations using the reflected-emission paradigm. We find that the resulting ionization of the cloud and dust makes Compton reflection on free electrons the most likely mode of reprocessing the jet synchrotron emission. The emission from the ionized reflector re-enters the blob in the Klein-Nishina regime, suppressing leptonic Compton upscattering that might be responsible for an elevated gamma-ray state with no corresponding increase in X-ray state.
The production of an elevated gamma-ray component, however, is still possible if there are hadrons within the blob with energies greater than 10 TeV. This hadronic synchrotron reflection model, in which relativistic protons interact with the reflected emission to produce charged and neutral pions, provides a possible explanation of the uncorrelated gamma-ray variability as inferred from the broadband observations.
Evidence for hadrons as the source of the highest-energy emission from blazars would highlight these galaxies as possible progenitors of cosmic rays. However, the energy of the hadrons predicted by this model peak around 10 TeV, which is insufficient as an explanation for the source of the ultra-high-energy cosmic rays. Detection of a neutrino flux in the direction of 1ES 1959+650 would provide compelling evidence that the observed non-thermal emission is derived from hadronic interactions. However, the expected neutrino number flux for the outlined scenario would be within a factor of two of the VHE-photon number flux and is too low to be detected by current-generation neutrino detectors such as IceCube (Reimer et al., 2005). Stronger conclusions regarding the non-thermal emission mechanism at work within the jet of 1ES 1959+650 and a more reliable application of time-dependent model such as a reflected emission model would be possible with a more comprehensive broadband dataset including high-cadence simultaneous observations.
References
- Acciari et al. (2009) Acciari, V. A., Aliu, E., Arlen, T. et al. 2009, ApJ, 695, 1370
- Acciari et al. (2010) Acciari, V. A., Aliu, E., Arlen, T. et al. 2010, ApJL, 715, 49
- Albert et al. (2008) Albert, J., Aliu, E., Anderhub, H. et al. 2008, ApJ, 674, 1037
- Aliu et al. (2013) Aliu, E., Arlen, T., Aune, T. et al. 2013, ApJ, 775, 3
- Aharonian et al. (2002) Aharonian, F., Belyanin, A., Derishev, E., Kocharovsky, V., & Kocharovsky, V. 2002, PhysRevD, 66, 023005
- Atwood et al. (2009) Atwood, W., Abdo, A., Ackermann, M. et al. 2009, ApJ, 697, 1071
- Bednarek (1993) Bednarek, W. 1993, ApJL, 402, 29
- Berge et al. (2007) Berge, D., Funk, S., & Hinton, J. 2007, A&A, 466, 1219
- Böttcher & Dermer (2002) Böttcher, M., & Dermer, C. D. 2002, ApJ, 564, 86
- Böttcher et al. (2013) Böttcher, M. et al. 2013, ApJ, 768, 54
- Böttcher (2005) Böttcher, M., 2005, ApJ, 621, 175 (Erratum: ApJ, 641, 1233 [2006])
- Böttcher (2007) Böttcher, M. 2007, AP&SS, 309, 95
- Cogan (2008) Cogan, P. 2008, Proc. 30th Int. Cosmic Ray Conf., Vol 3, The VERITAS Gamma-ray Analysis Suite, ed. R. Caballero, J. C. D’Olivo, G.Medina-Tanco, L. Nellen, F. A. Sánchez & J. F. Valdeé-Galicia (Mexico City, Mexico: Universidad Nacional Autónoma de México), 1385
- Coppi et al. (1999) Coppi, P., Aharonian, F. & Felix, A. 1999, ApJ, 521, 33
- Daniel (2008) Daniel, M. 2008, Proc. 30th Int. Cosmic Ray Conf., Vol 3, The VERITAS Standard Data Analysis, ed. R. Caballero, J. C. D’Olivo, G.Medina-Tanco, L. Nellen, F. A. Sánchez & J. F. Valdeé-Galicia (Mexico City, Mexico: Universidad Nacional Autónoma de México), 1325
- Dar et al. (1997) Dar, A. & Laor, A. 1997, ApJL, 478, 5
- Dermer et al. (1992) Dermer, C. et al. 1992, A&A, 256, L27
- Fitzpatrick (1999) Fitzpatrick, E. 1999, PASP, 111, 63
- Fomin et al. (1994) Fomin, V., Stepanian, A., Lamb, R. et al. 1994, Astropart. Phys., 2, 137
- Fossati et al. (2008) Fossati, G. et al. 2008, ApJ, 677, 906
- Fumagalli et al. (2012) Fumagalli, M. et al. 2012, MNRAS, 424, 227
- Furniss et al. (2013) Furniss, A., Fumagalli, M., Falcone, A. & Williams, D. A. 2013, ApJ, 770, 109
- Gehrels et al. (2004) Gehrels, N., Chincarini, G., Giommi, P. et al. 2004, ApJ, 611, 1005
- Ghisellini et al. (1998) Ghisellini, G. et al. 1998, MNRAS, 301, 451
- Glover & Clark (2012) Glover, S. & Clark, P. C. 2012, MNRAS, 421, 9
- Graff et al. (2008) Graff, P. et al. 2008, ApJ, 689, 68
- Ho (2008) Ho, L. C. 2008, ARA&A, 46, 475
- Holder et al. (2003) Holder, J., Bond, I. H., Boyle, P. J. et al. 2003, ApJL, 583, 9
- Holder et al. (2006) Holder, J., Atkins, R., Badran, H. et al. 2006, Astropart. Phys., 25, 391
- Kalberla et al. (2005) Kalberla, P., Burton, W., Hartmann, D. et al. 2005, A&A, 440, 775
- Kirsch et al. (2005) Kirsch, M. G., Briel, U. G., Burrows, D. et al. 2005, SPIE, 5898, 22
- Krawczynski et al. (2000) Krawczynski, H. et al. 2000, A&A, 353, 97
- Krawczynski et al. (2002) Krawczynski, H., Coppi, P., & Aharonian, F. 2002, MNRAS, 336, 721
- Krawczynski et al. (2004) Krawczynski, H. et al. 2004, ApJ, 601, 151
- Krumholz et al. (2009) Krumholz, M. McKee, C. F., & Tumlinson, J. 2009, ApJ, 693, 216
- Kusunose & Takahara (2006) Kusunose, M. & F. Takahara 2006, ApJ, 651, 113
- Li & Ma (1983) Li, T. & Ma, Y. 1983, ApJ, 272, 317
- Mannheim (2000) Mannheim, K. 2000, A&A, 269, 67
- Maraschi et al. (1992) Maraschi, L. et al. 1992, ApJL, 397, 5
- Marscher & Protheroe (2000) Marscher, A. & Protheroe, R. 2000, AIPC, 515, 149
- Mattox et al. (1996) Mattox, J., Bertsch, D., Chiang, J. et al. 1996, ApJ, 461, 396
- Matsuoka, et al. (2009) Matsuoka, M. et al. 2009, PASJ, 61, 999
- Morrison & McCammon (1983) Morrison, R. & McCammon, D. 1983, ApJ, 270, 119
- Mücke & Protheroe (2000) Mücke, A. & Protheroe, R. 2000, AIPC, 515, 149
- Nolan, P. et al. (2012) Nolan, P. et al. 2012, APJS, 199, 31
- Padovani et al. (2007) Padovani, P., Giommi, P., Landt, H. & Perlman, E. 2007, ApJ, 662, 182
- Pohl & Schlickeiser (2000) Pohl, M. & Schlickeiser, R. 2000, A&A, 354, 395
- Poole et al. (2008) Poole, T., Breeveld, A., Page, M. J et al. 2008, MNRAS, 383, 627
- Reimer et al. (2005) Reimer, A. Böttcher, M. & Postnikov, S. 2005, ApJ, 630, 186
- Rolke et al. (2005) Rolke, A., Wolfgang, A., López & A. Conrad, J. 2005, Nucl. Instrum. Meth, A551, 493
- Scatcher et al. (1993) Scatcher, J. et al. 1993, ApJ, 412, 541
- Sikora et al. (1994) Sikora, M. et al. 1994, ApJ, 421, 153
- Schlegel et al. (1998) Shlegel, D., Finkbeiner, D. & Davis, M. 1998, ApJS, 500, 525
- Summerlin & Baring (2012) Summerlin & Baring 2012, ApJ 745, 63
- Tagliaferri et al. (2008) Tagliaferri, G. et al. 2008, ApJ, 679, 1029
- Tielenn & Hollenbach (1985) Tielenn, H. & Hollenbach, D. 1985, ApJ, 291, 722
- Trump et al. (2011) Trump, J. R. et al. 2011, ApJ, 733, 60
- Weekes et al. (2002) Weekes, T. C. Badran, H., Biller, S. et al. 2002, Astropart. Phys., 17, 221
- Williams et al. (2008) Williams, G. G., Milne, P. A., Park, H. S., Barthelmy, S. D., Hartmann, D. H., Updike, A. & Hurley, K. 2008, AIP Conf. Proc. 1000:535 (arXiv:0803.0021)
| Exposure | Exposure | Detection | Number | Number | Number | Power law | Average Integral | Integral Flux | Power-Law | |
|---|---|---|---|---|---|---|---|---|---|---|
| Date | Livetime | Significance | ON | OFF | Excess | Index | Flux 315 GeV | Percent Crab | Fit | |
| MJD | [minutes] | Events | Events | Events | [ph m-2s-1] | [%] | /DOF | |||
| April Dark Run | 56034-56040 | 186 | 6.6 | 90 | 425 | 51 | 2.50.4 | 0.90.4 | 8 | 1.1/5 |
| Flare | 56067 | 106 | 26.3 | 276 | 249 | 253 | 2.60.1 | 8.00.8 | 66 | 19.4/22 |
| May Dark Run | 56064-56079 | 231 | 10.3 | 151 | 501 | 106 | 3.20.3 | 1.50.2 | 12 | 4.3/6 |
| Combined Dark Runs | 56034-56079 | 417 | 12.1 | 241 | 926 | 157 | 3.00.2 | 1.40.2 | 11 | 3.8/7 |
| Swift XRT | Observation | Exposure | Power-law | NHI | Integral Flux | ††Refers to the of the power-law fit. | Degrees |
|---|---|---|---|---|---|---|---|
| Observation | Date | Time | Index | Density | 2-10 keV | of | |
| ID**For observations consisting of two time separated exposures, we denote the first with (a) and the second with (b). The MJD is given for the start of each exposure, respectively. | [MJD] | [ks] | [cm-2] | [ erg cm-2s-1] | Freedom | ||
| 00035025075 | 56036.51 | 1.0 | 2.950.06 | 2.20.1 | 7.40.3 | 191.1 | 180 |
| 00035025076 | 56037.72 | 1.5 | 2.820.04 | 2.160.08 | 8.90.3 | 299.5 | 245 |
| 00035025077 | 56051.41 | 1.0 | 2.710.05 | 1.890.09 | 7.80.3 | 206.9 | 195 |
| 00035025078 | 56064.38 | 1.1 | 2.570.05 | 2.00.1 | 9.30.3 | 225.5 | 207 |
| 00035025079 | 56067.39 | 0.7 | 2.530.06 | 1.90.1 | 8.40.3 | 124.2 | 156 |
| 00035025080 (a) | 56074.69 | 0.6 | 2.530.02 | 2.30.1 | 12.00.1 | 150.0 | 170 |
| 00035025080 (b) | 56074.75 | 0.6 | 2.520.05 | 2.20.1 | 12.90.1 | 154.3 | 178 |
| 00035025081 (a) | 56075.23 | 0.9 | 2.640.06 | 2.10.1 | 7.00.3 | 140.9 | 153 |
| 00035025081 (b) | 56075.57 | 0.3 | 3.10.1 | 2.70.3 | 4.30.3 | 46.4 | 46 |
| 00035025082 | 56076.69 | 0.9 | 2.780.07 | 2.00.1 | 4.20.3 | 131.1 | 124 |
| 00035025083 | 56078.43 | 1.0 | 2.590.04 | 2.10.1 | 9.40.3 | 187.8 | 204 |
| 00035025084 (a) | 56079.57 | 1.5 | 2.520.05 | 1.90.1 | 9.30.3 | 188.4 | 171 |
| 00035025084 (b) | 56079.70 | 0.5 | 2.780.08 | 2.50.2 | 10.40.2 | 101.2 | 98 |
| Date | UVW1 | UVW2 | UVM2 |
|---|---|---|---|
| [MJD] | [ erg cm-2s-1] | [ erg cm-2s-1] | [ erg cm-2s-1] |
| 56037 | 8.60.2 | 9.60.2 | 11.6 0.3 |
| 56051 | 8.20.2 | 8.90.2 | 11.1 0.3 |
| 56064 | 6.90.2 | 7.60.2 | 9.4 0.3 |
| 56067 | 7.10.2 | 7.40.2 | 8.90.3 |
| 56075 | 5.90.1 | – | 7.50.2 |
| 56078 | 6.30.2 | 6.70.2 | 8.30.2 |
| 56079 | 6.40.2 | 6.80.2 | 8.30.2 |
| Exposure | Super-LOTIS | iTelescope | iTelescope |
|---|---|---|---|
| Date | R-band | R-band | V-band |
| [MJD] | Magnitude | Magnitude | Magnitude |
| 56034.0 | 13.80.1 | ||
| 56045.0 | 13.80.1 | ||
| 56046.0 | 13.80.1 | ||
| 56047.0 | 13.70.1 | ||
| 56048.0 | 13.80.1 | ||
| 56050.3 | 13.70.1 | ||
| 56060.3 | 13.80.1 | ||
| 56064.3 | 13.90.1 | ||
| 56068.3 | 13.90.1 | ||
| 56069.3 | 13.90.1 | ||
| 56070.0 | – | 13.9200.007 | 14.3400.006 |
| 56071.0 | – | 13.9260.003 | 14.3490.005 |
| 56073.0 | – | 14.0090.006 | 14.3780.007 |
| 56074.0 | – | 13.8140.014 | 14.1640.015 |
| 56074.3 | 14.00.1 | ||
| 56075.3 | 13.90.1 | ||
| 56075.0 | – | 13.9710.014 | 14.3750.016 |
| 56076.0 | – | 13.8100.015 | 14.1310.021 |
| 56076.3 | 14.00.1 | ||
| 56077.0 | – | 13.9440.019 | 14.3200.010 |
| 56078.3 | 14.00.1 | ||
| 56078.0 | – | 13.9280.007 | 14.2700.005 |
| 56079.3 | 14.00.1 | ||
| 56079.0 | – | 13.9480.024 | 14.3580.019 |
| 56081.2 | – | 13.8140.020 | 14.2390.027 |
| 56082.3 | 14.00.1 | ||
| 56083.3 | 14.10.1 | ||
| 56084.3 | 14.00.1 | ||
| 56085.3 | 14.00.1 |
| SSC | Low State | High State | High State |
|---|---|---|---|
| Parameter | Scenario I | Scenario II | |
| [units] | MJD 56064 | MJD 56067 | MJD 56067 |
| 6 | 1.5 | 9 | |
| 5 | 1.5 | 1 | |
| 2.8 | 2.7 | 2.7 | |
| B [G] | 0.1 | 0.012 | 0.022 |
| 25 | 25 | 40 | |
| R [cm] | 2.1e16 | 8e16 | 2.1e16 |
| [degrees] | 2.3 | 2.3 | 1.4 |
| [erg s-1] | 4.6 | 2.3 | 1.4 |
| [erg s-1] | 1.0 | 2.2 | 1.3 |
| 0.22 | 9.4 | 9.3 | |
| [hr] | 8.2 | 31 | 5.1 |