Characteristics of Spiral Arms in Late-type Galaxies
Abstract
We have measured the positions of large numbers of H II regions in four nearly face-on, late-type, spiral galaxies: NGC 628 (M 74), NGC 1232, NGC 3184 and NGC 5194 (M 51). Fitting log-periodic spiral models to segments of each arm yields local estimates of spiral pitch angle and arm width. While pitch angles vary considerably along individual arms, among arms within a galaxy, and among galaxies, we find no systematic trend with galactocentric distance. We estimate the widths of the arm segments from the scatter in the distances of the H II regions from the spiral model. All major arms in these galaxies show spiral arm width increasing with distance from the galactic center, similar to the trend seen in the Milky Way. However, in the outer-most parts of the galaxies, where massive star formation declines, some arms reverse this trend and narrow. We find that spiral arms often appear to be composed of segments of kpc length, which join to form kinks and abrupt changes in pitch angle and arm width; these characteristics are consistent with properties seen in the large -body simulations of D’Onghia, Vogelsberger & Hernquist (2013) and others.
1 Introduction
Spiral structures in galaxies have been extensively studied, including the nature and number of arms and values for pitch angles, which measure how tightly wound are the spirals. One characteristic of spirals that has received little attention is the width of arms. For the Milky Way, recent measurements of parallax of molecular masers associated with newly formed massive stars have indicated that the widths of spiral arms, estimated from the scatter of these sources about a segment of a spiral arm, increases with Galactocentric distance (Reid et al., 2014).
Assuming that the Milky Way is not atypical among spiral galaxies, one might expect a similar increase in arm widths with radius in other late-type spirals. Whereas the measurement of arm width for the Milky Way is difficult, owing to our location within the Galactic disk and the difficulty of obtaining accurate distance measurements at characteristic distances from the Sun of kpc, it should be straight-forward in external galaxies. Thus, we undertook a detailed study of the patterns of giant H II regions in four nearby, nearly face-on, late-type galaxies that display clear spiral structure.
We use the locations of giant H II regions as tracers of spiral structure. The galaxy images used for measurement of the locations of H II regions are documented in Section 2, along with the methods used to determine positions. Our approach to fitting segments of spiral patterns to these data is presented in Section 3. The results for each galaxy are given in Section 4. Finally, in Section 5, we discuss the characteristics of the spiral arms and compare these characteristics to those of the Milky Way.
2 Measured Positions of H II Regions
Table 1 lists information about the images of the four galaxies studied in this paper. All of the images are publicly available on the internet, and we selected high resolution images in H or blue-filtered emission to maximize the contrast of H II regions with respect to the background continuum emission from the galaxy. Images were either downloaded in the Flexible Image Transport System (FITS) format or were converted to that format using the ImageMagick program “convert” available at http://www.imagemagick.org. We also used this software to prepare images for display in our figures.
| Galaxy | Alias | Type | Distance | Telescope | Filter | Pixel Scale | Reference/ |
|---|---|---|---|---|---|---|---|
| (Mpc) | (arcsec) | Source | |||||
| NGC 628 | M 74 | SA(s)c | 10.0 | HST | H | 0.150 | 1 |
| NGC 1232 | SAB(rs)c | 21.0 | VLT | Blue | 0.041 | 2 | |
| NGC 3184 | SAB(rs)cd | 8.2 | JKT | H | 0.243 | 3 | |
| NGC 5194 | M 51 | SA(s)bc | 9.4 | HST | H | 0.050 | 4 |
Note. — Assumed distances used to convert pixel to linear scales. References: 1: http://heritage.stsci.edu/2007/41/fast_facts.html; 2: https://www.eso.org/public/usa/images/eso9845d; 3: http://cdsarc.u-strasbg.fr/viz-bin/qcat?J/A+A/426/1135, Knapen et al. (2004); 4: http://archive.stsci.edu/prepds/m51/datalist.html. Telescopes: HST: Hubble Space Telescope; VLT: Very Large Telescope; JKT: Jacobus Kapteyn Telescope.
FITS format images were loaded into the National Radio Astronomy Observatory’s 111The National Radio Astronomy Observatory is a facility of the National Science Foundation operated under cooperative agreement by Associated Universities, Inc. Astronomical Image Processing System (AIPS). We used the task JMFIT to estimate positions by fitting two-dimensional elliptical Gaussian brightness distributions to individual sub-regions within an image that each contained one H II region. Foreground stars in the Milky Way were easily recognized as point-like objects, usually with diffraction spikes, and excluded. Contamination of our H II region sample by other objects (e.g., supernova remnants or planetary nebulae) should not be significant for these H or blue-filtered images.
Fitted positions were obtained in pixel units, and we used the pixel scale and assumed galaxy distance to translate these to physical scales in kiloparsec units. Note that we often adjusted the image display transfer functions when preparing sub-regions of a galaxy for measurement, and that many H II regions are not visible on the low dynamic-range figures published in this paper. We also measured the position of the bright center of each galaxy and subtracted this position from each H II region position in order to translate to galactocentric coordinates. We made no attempt to deproject the H II region positions for these galaxies, which are within about from a face-on orientation. The galactic positions for all H II regions are available as on-line material.
3 Fitting Spiral Arm Segments
We fit segments of spiral arms to the positions of H II regions using a Bayesian Markov chain Monte Carlo technique. The adopted model is a log-periodic spiral given by
where is galactocentric azimuth defined as zero toward the north and increasing east of north, is the galactocentric radius at azimuth , and is the spiral pitch angle. The parameter was assigned the average of the measured H II region azimuths, leaving two parameters to be solved for: and .
Since, the precision in measuring an H II region position ( pc) is significantly better than the intrinsic scatter in their positions about a best-fit spiral segment ( pc), we also solved for an arm-width parameter () to characterize the scatter and to allow for this source of astrophysical noise when fitting a spiral. (While there can be many definitions of arm width, throughout this paper we adopt a Gaussian () approximation to the distribution of the minimum distances of H II regions from the model arm segment.) We calculated likelihood functions from the weighted residuals, , where is the minimum distance of the H II region from the model spiral (evaluated numerically) and is its “uncertainty” owing to intrinsic scatter within the arm.
We randomly generated trials (Markov chains) of the two parameters characterizing the spiral arm segment ( and ) and the parameter characterizing the width of the spiral arm () and accepted/rejected these trials with the Metropolis-Hastings algorithm. We employed two likelihood functions in our analysis: an “error-tolerant” likelihood function (see “a conservative formulation” by Sivia & Skilling, 2006) given by
and a least-squares likelihood function given by
where is the number of measured H II regions. Note the factor in the likelihoods, often a constant and ignored, is retained here since we vary its value in order to estimate arm width.
The error-tolerant likelihood function is relatively insensitive to outlying data points and was used to find and then remove interarm H II regions from the sample in an unbiased fashion. We accomplished this by fitting with the Eq. (2) likelihood and discarding H II regions with deviations. After this preliminary editing, we fitted the spiral with the least-squares likelihood (Eq. 3). Usually, at this stage, all residuals were , but occasionally one or two H II regions with residuals just above were encountered. In these cases, the outliers were removed from the sample and the spiral re-fitted.
We first fitted a single log-periodic spiral to all H II regions in a given arm. Such “global” fits usually revealed systematic departures from a constant pitch angle model. Since we would like to investigate the possible increase in arm width along the arm, we re-fit each arm with spiral segments of length roughly 5 to 10 kpc. The boundaries for the arm segments were chosen based on three criteria: 1) breaks in the density or scatter of H II regions, 2) apparent changes in the local pitch angles among segments, and 3) to keep comparably sized samples of H II regions among the segments in one arm. Fitting short arm segments also has the advantage of minimizing systematic error in the width estimates, owing to the simplification of the assumed spiral model.
Marginalized posteriori probability density functions (PDFs) were obtained from binned histograms of the individual parameter values for all trials. Since the PDFs were approximately Gaussian in shape, we adopted the center and half-width of the 68% confidence intervals as best estimates of the parameter values and uncertainties.
4 Results
4.1 NGC 628 (M 74)
The image of NGC 628 (M 74) is displayed in the left panel of Figure 1. This galaxy has two prominent spiral arms that wind counterclockwise with increasing distance from the galactic center. We could trace 223 H II regions in the arm labeled “A” in the figure and in Table 2 from a distance of about 2 to 8 kpc from the center. Fitting the log-periodic spiral form of Eq. (1) to all H II region positions gives a global pitch angle of , although it is clear that a single pitch angle is not a good fit over the entire arm. In the second arm, labeled “B”, we located 427 H II regions between distances of about 4 to 13 kpc and find a global pitch angle of . This global fit is better than for arm A, but still shows some small systematic deviations from a constant pitch angle form.
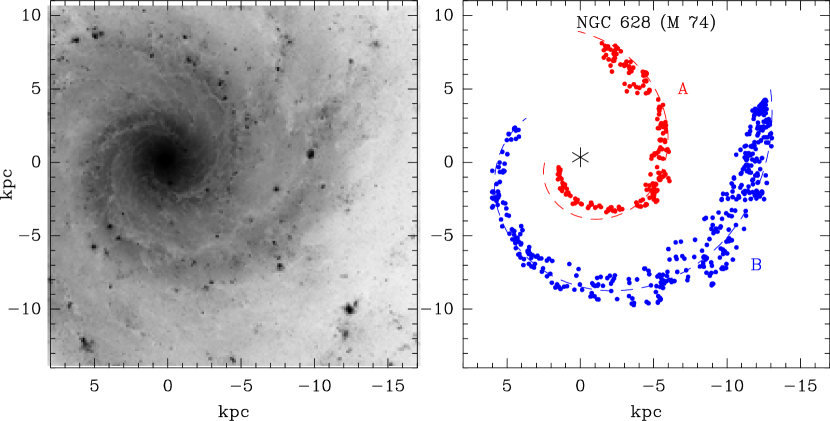
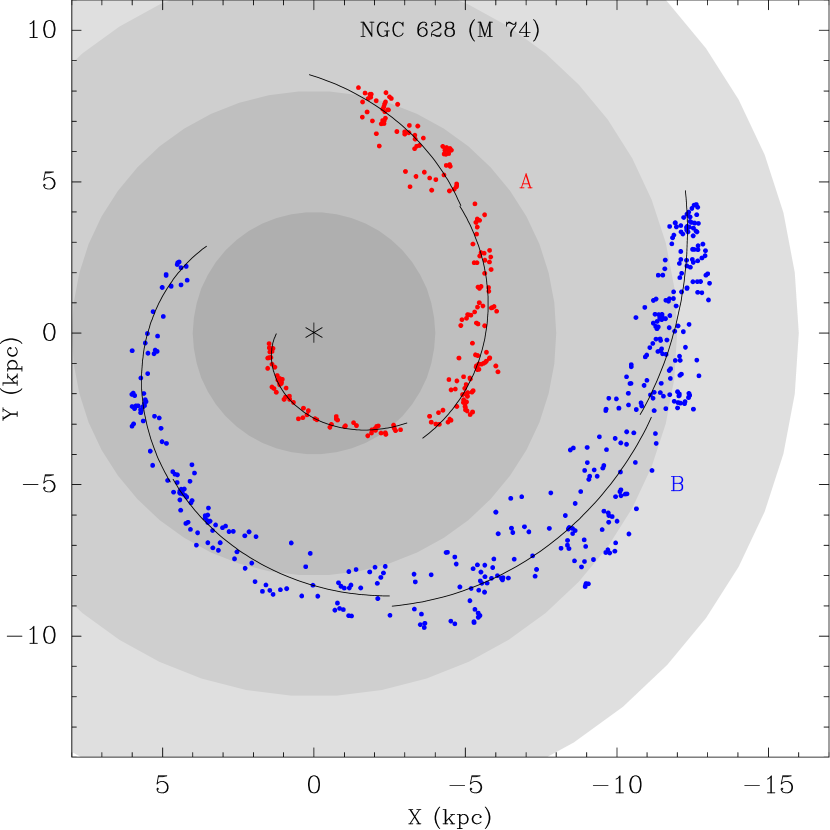
We divided arm A into three segments and arm B into four segments, as indicated in Table 2. Spiral fits revealed significant changes in pitch angle among the segments in arm A, but only small changes among segments in arm B. For both arms, the estimated arm widths increase with increasing radius, with the exception of the last segment of arm B, where some narrowing occurs. These characteristics are evident from an inspection of Figure 2 where individual arm segment fits are displayed.
4.2 NGC 1232
The left panel of Figure 3 shows the image of NGC 1232, which displays several spiral arms starting from near the galactic center and winding counterclockwise with increasing radial distance. Some of these arms branch and/or connect with arm segments at large distances. We traced 105, 165, and 73 H II regions in arms labeled “A” through “C”, respectively, and 25, 50, and 48 H II regions in arm segments “D” through “F”, as labeled in the figure and in Table 3. Arm segments E and F may connect to spiral arms A and C, although other possibilities exist. Fitting a spiral form to all H II regions in each arm (segment) gave global pitch angles of , , , , , and for arms or segments A through F, respectively. Not only is a single pitch angle inappropriate for all arms, the longer arms clearly show systematic deviations from a constant pitch angle along their length.
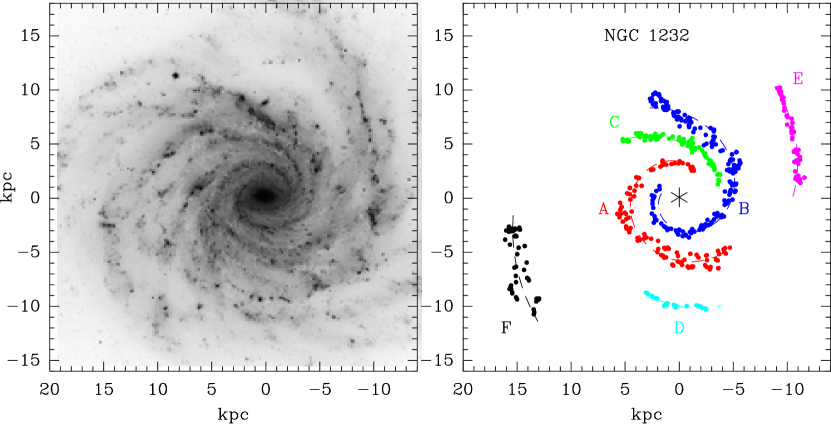
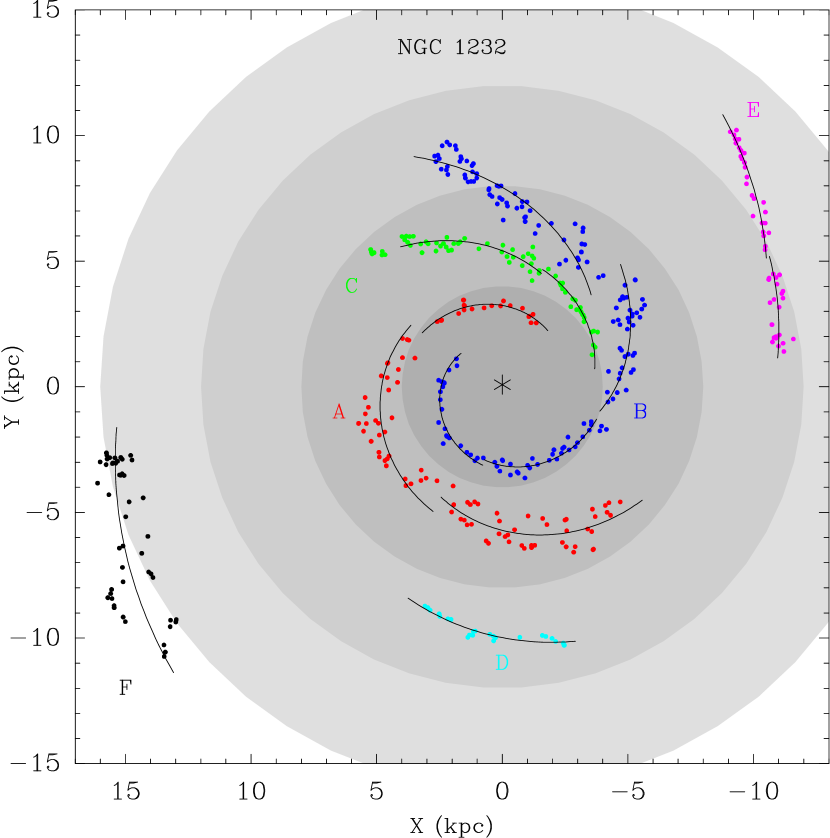
We divided arms A, B, and C into two or more segments in order to estimate arm widths as a function of distance from the galactic center, as indicated in Table 3. The outer galaxy arm fragments D and F were fit with one segment and E with two segments. The spiral fits revealed significant changes in pitch angle among segments within arms. The widths for arms A, B, and C increase with distance from the galaxy center, as is evident in Figure 4. Only the outer galaxy arm segment E shows evidence arm narrowing.
| Arm | Azimuth Range | Mean Radius | Pitch Angle | Width |
|---|---|---|---|---|
| (deg) | (kpc) | (deg) | (kpc) | |
| A | ||||
| … | ||||
| … | ||||
| B | ||||
| … | ||||
| … | ||||
| … | ||||
| C | ||||
| … | ||||
| D | ||||
| E | ||||
| … | ||||
| F |
Note. — Arm segments are labeled with letters A through F and are defined by the indicated azimuth range. Azimuth is measured east of north (counter clockwise from vertical in Figs. 3 and 4. Mean radius is the fitted galactocentric distance at the average azimuth of the H II regions in the arm segment.
4.3 NGC 3184
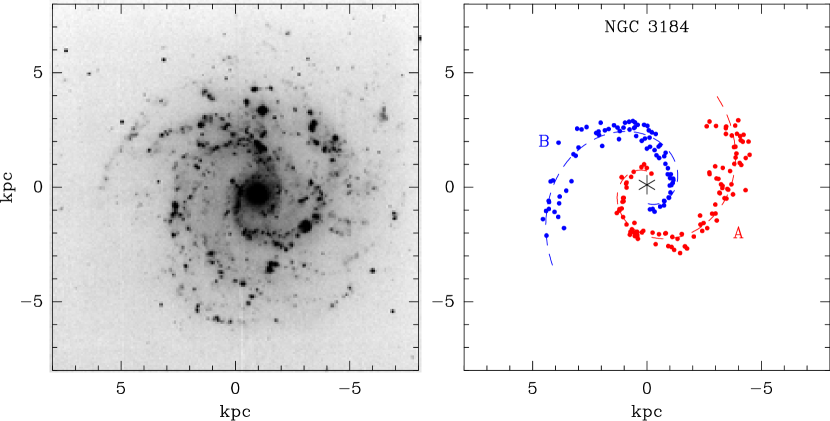
An image of NGC 3184 is displayed in the left panel of Figure 5. This galaxy has two prominent and symmetrical spiral arms that wind counterclockwise with increasing distance from the galactic center. We could trace 100 and 80 H II regions in arms labeled “A” and “B”, respectively, in the figure and in Table 4, with distances of about 1 to 5 kpc from the center. Fitting spirals to all H II region positions for arms A and B separately gives global pitch angles of and . These values are consistent with each other.
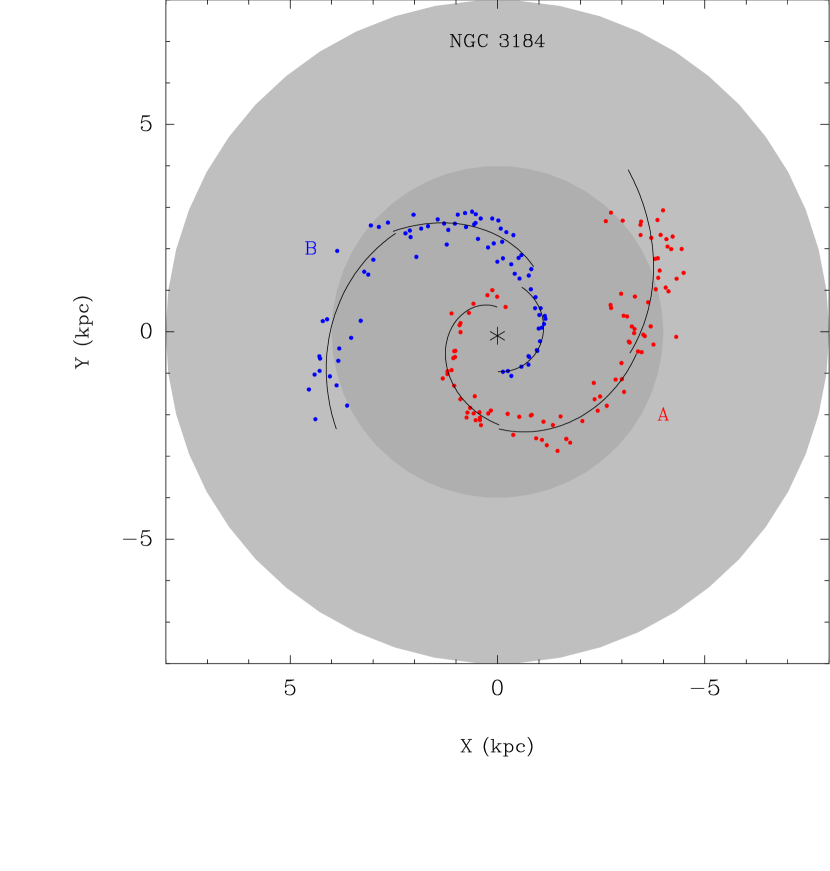
We divided arms A and B into three segments each, as indicated in Table 4. The spiral fits revealed significant changes in pitch angle among segments within each arm. The widths for both arms increase smoothly with distance from the galaxy center, as is evident in Figure 6.
4.4 NGC 5194 (M 51)
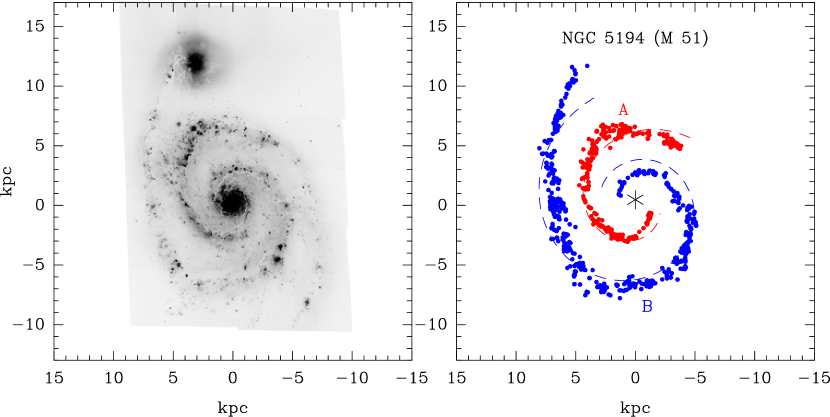
The image of NGC 5194 is displayed in the left panel of Figure 7. This galaxy has two prominent spiral arms that wind clockwise with increasing distance from the galactic center. We could trace 283 and 527 H II regions in arms labeled “A” and “B”, respectively, in the figure and in Table 5, with distances of about to kpc from the center for arm B. Fitting spirals to all H II region positions for arms A and B separately gives global pitch angles of and which are significantly different. While systematic deviations from the global model for arm A are modest, those for arm B are large.
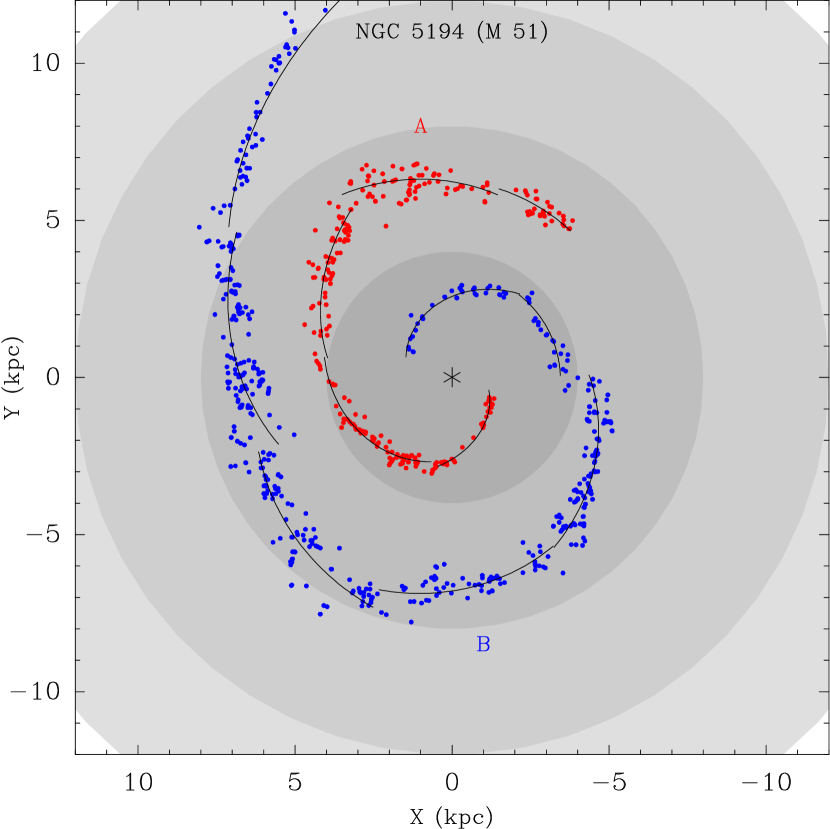
We divided arms A and B into five and six segments, respectively, as indicated in Table 5. The spiral fits revealed significant changes in pitch angle among segments with each arm. Overall, the widths for both arms increase smoothly with distance from the galaxy center, as is evident in Figure 8. However, both show a narrowing in their last segment.
5 Characteristics of Spiral Arms
Many studies present the properties of spiral arm pitch angles averaged over an entire galaxy (e.g., Kennicutt, 1981; Savchenko & Reshetnikov, 2013; Davis & Hayes, 2014). Often these use Fourier or other automated techniques that can efficiently analyze large samples of galaxies using integrated light. Our work differs by directly fitted spirals to the locations of H II regions, which allows a detailed and robust evaluation of the characteristics of spiral arms without assuming uniform properties over an entire arm or galaxy.
5.1 Pitch Angles
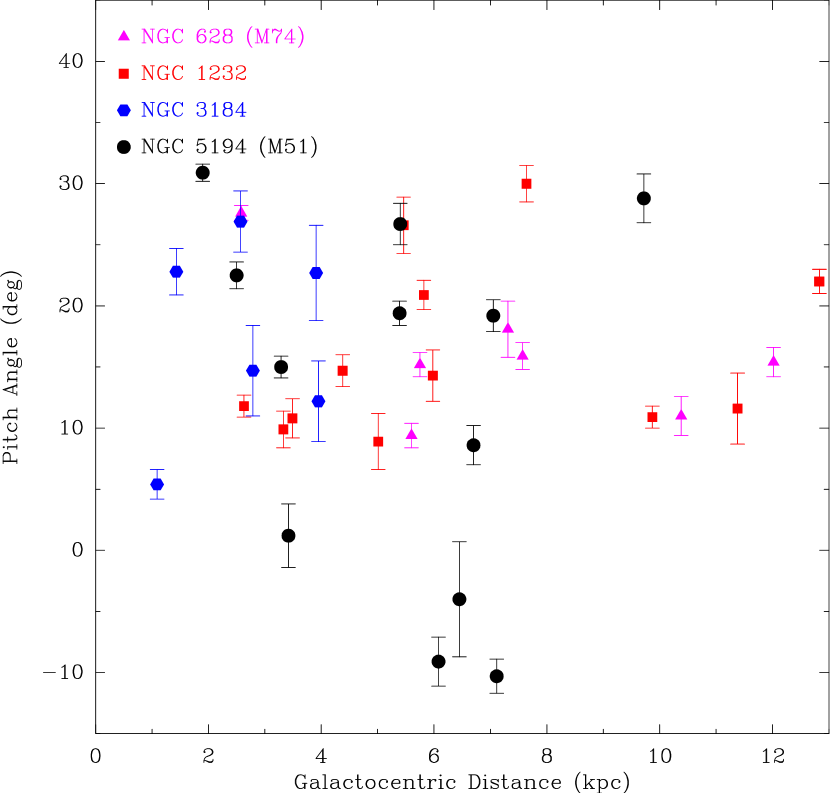
Figure 9 shows the measured pitch angles of the segments of spiral arms in our sample of galaxies. Most pitch angles for these galaxies are between about 10∘ and 30∘, comparable to the range found by Kennicutt (1981) for Sc-type galaxies. Note that we also find large variations of pitch angles among arms within a spiral galaxy, as well as along individual arms, confirming previous studies (e.g., Russell & Roberts, 1992; Ma, 2001; Savchenko & Reshetnikov, 2013; Davis & Hayes, 2014).
Interestingly, we find no evidence for a general change in pitch angle with galactocentric distance. The -body simulations of Grand, Kawata & Cropper (2013) suggest that the pitch angle of an arm segment decreases with the local rate of shear in a galaxy’s rotation, and that shear rate generally increases with radius. Thus, one might expect a small trend of pitch angle decreasing with galactocentric radius. However, they also find that arm segments are short-lived and change pitch angles by over time scales of Gyr. This may explain the apparent random variation in pitch angles within each galaxy in our sample, since different arm segments would likely be observed at different ages.
The characteristics of pitch angles of Milky Way spiral arms are now being revealed by trigonometric parallax measurements of high-mass star forming regions from observations with the Very Long Baseline Array, the Japanese VERA project, and the European VLBI Network. Using parallax results from these arrays yielded pitch angle estimates for sections of the following Milky Way arms: Scutum arm: (Sato et al., 2014), Sagittarius arm: (Wu et al., 2014), Local arm: (Xu et al., 2013), Perseus arm: (Zhang et al., 2013; Choi et al., 2014), and Outer arm: (Hachisuka et al., 2014). The variation of pitch angle among segments of Milky Way spiral arms is qualitatively similar to those of the four late-type spirals in this study. Currently the parallax data for the Milky Way typically trace only arm segments to kpc in length, which corresponds to the scale over which we find relatively constant pitch angles in the external galaxies. However, as larger regions of the Milky Way are mapped, one might expect to see pitch angle variations along its spiral arms.
5.2 Arm Widths
Figure 10 shows the widths of arm segments (defined as the scatter perpendicular to the arm of their H II regions) for the four galaxies in our sample. Only arms with two or more segments are plotted. Except for the three outliers in the lower-right portion of the figure, which indicate narrowing at the ends of some arms (to be discussed below), both individually and as a group these data indicate that spiral arms increase in width with distance from the center of their galaxy. Clear examples of this phenomenon are seen in Figure 2 for arm B of NGC 628 (M 74) and in Figure 6 for arm A of NGC 3184. Lynds (1970) reported a similar result for the widths of primary dust lanes associated with spiral arms.
Unlike spiral pitch angles that vary significantly and randomly across a galaxy, the widths of arm segments display a systematic variation with radius. Thus, the observed arm-width versus radius trends should provide a clear observable to test and better understand -body simulations. At present we are unaware of arm width estimates from simulations.
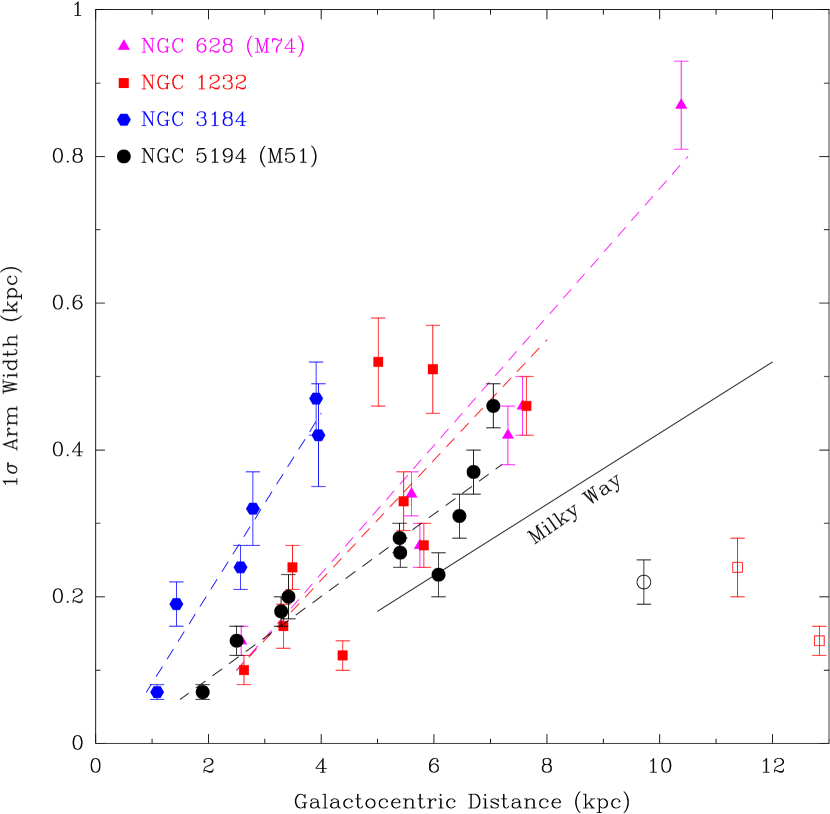
A similar analysis by Reid et al. (2014) for Milky Way spiral arms noted that the scatter in H II regions, based on trigonometric parallax distances, increased with distance from the Galactic center. This result motivated us to examine external spiral galaxies to determine if the Milky Way is typical or unusual in this respect. Although based on this relatively small sample of external galaxies, we conclude that spiral arms widths in the Milky Way are qualitatively similar to those in other spiral galaxies.
Interestingly, in NGC 628 (M 74) arm B, NGC 1232 arm E, and NGC 5194 (M 51) arms A and B, we find that the trend of arm width increasing with distance reverses near the outer tips of these arms. These last arm segments are all significantly narrower than their immediately interior arm segment. This narrowing appears related to massive star formation dying out at large galactocentric radii. In classical spiral density-wave theory, this narrowing could be attributed to reaching the radius of co-rotation of a spiral pattern with orbiting material. If so, M 51’s arm A co-rotates at a radius of kpc while arm B co-rotates at a radius of kpc. The existence of (at least) two co-rotation radii in M 51 would argue against a single (global) pattern speed, consistent with the findings of Meidt et al. (2008).
5.3 Spiral Arm Formation
The trend of spiral arm width increasing with galactocentric distance demonstrated in this paper may provide a diagnostic characteristic for constraining models of the origin of spiral arms. The swing amplification mechanism (Goldreich & Lynden-Bell, 1965) may lead to such a trend, as swinging inherently fans material outwards (Toomre, 1981). Whether or not global spiral density-wave theories naturally lead to the observed growth of arm width has not been addressed.
In the galaxies we studied, a small number of spiral arms display nearly continuous arms with modest changes in pitch angle. However, more commonly, we find the arms are much less regular. Examination of Figures 2, 4, 6, and 8 reveals that individual arms often break up into segments of kpc length, and different segments join to form bends, kinks, and quasi-linear sections and abrupt changes in pitch angle. Similar conclusions have been reached based on a variety of other observables (e.g., Russell & Roberts 1992; Waller et al. 1997; Chernin 1999). To these characteristics we now add variation in arm width. These observations suggest that spiral arms are not purely global structures.
Numerical simulations of galactic disks also show spiral characteristics that indicate non-global origin (e.g., Foyle et al. 2011; Grand, Kawata & Cropper 2012). In particular, the high-resolution -body simulations by D’Onghia, Vogelsberger & Hernquist (2013) show that spiral structures can form in response to perturbations from giant molecular clouds in the disk, which then swing amplify to form arm segments, grow non-linearly, and then connect to produce long spiral-like patterns. Given the arm morphologies we have noted in late-type galaxies, such an origin for spiral arms seems an attractive mechanism.
We thank the referee and E. D’Onghia for suggestions to improve the paper.
References
- Chernin (1999) Chernin, A. D. 1999, MNRAS, 308, 321
- Choi et al. (2014) Choi, Y. K., Hachisuka, K., Reid, M. J., Xu, Y., Brunthaler, A. et al. 2014, ApJ, 790, 99
- Davis & Hayes (2014) Davis, D. R. & Hayes, W. B. 2014, ApJ, 790, 87
- D’Onghia, Vogelsberger & Hernquist (2013) D’Onghia, E., Vogelsberger, M. & Hernquist, L. 2013, ApJ, 766, 34
- Foyle et al. (2011) Foyle, K., Rix, H.-W., Dobbs, C. L., Leroy, A. K. & Walter, F. 2011, ApJ, 735, 101
- Goldreich & Lynden-Bell (1965) Goldreich, P. & Lynden-Bell, D. 1965, MNRAS, 130, 125
- Grand, Kawata & Cropper (2012) Grand, R. J. J., Kawata, D & Cropper, M. 2012, MNRAS, 421, 1529
- Grand, Kawata & Cropper (2013) Grand, R. J. J., Kawata, D & Cropper, M. 2012, A&A, 553, A77
- Hachisuka et al. (2014) Hachisuka, K., Choi, Y. K., Reid, M. J., Brunthaler, A., Menten, K. M. et al. 2014, submitted to ApJ
- Kennicutt (1981) Kennicutt, R. C. Jr. 1981, AJ, 86(12), 1847
- Knapen et al. (2004) Knapen, J. H., Stedman, S., Bramich, D. M., Folkes, S. L. & Bradley, T. R. 2004, A&A, 426, 1135
- Lynds (1970) Lynds, B. T. 1970, IAUS, 38, 26
- Ma (2001) Ma, J. 2001, ChJAA, 1, 395
- Meidt et al. (2008) Meidt, S. E., Rand, R. J., Merrifield, M. R., Shetty, R. & Vogel, S. N. 2008, ApJ, 688, 224
- Reid et al. (2014) Reid, M. H., Menten, K. M., Brunthaler, A., Zheng, X. W., Dame, T. M. et al. 2014, ApJ, 783, 130
- Russell & Roberts (1992) Russell, W. S. & Roberts, W. W. Jr. 1992, ApJ, 398, 94
- Sato et al. (2014) Sato, M., Wu, Y. W., Immer, K. Zhang, B. Sanna, A. et al. 2014, ApJ, 793, 72
- Savchenko & Reshetnikov (2013) Savchenko, S. S. & Reshetnikov, V. P. 2013, MNRAS, 436, 1074
- Sivia & Skilling (2006) Sivia, D. & Skilling, J. 2006, Data Analysis: A Bayesian Tutorial (2nd ed.; New York, Oxford Univ. Press), 168
- Toomre (1981) Toomre, A. 1981, in Structure and Evolution of Normal Galaxies, Eds. S. M. Fall & D. Lynden-Bell (Cambridge: Cambridge Univ. Press), 111
- Waller et al. (1997) Waller, W. H., Bohlin, R. C., Cornett, R. H., Fanelli, M. N., Freedman, W. L. et al. 1997, ApJ, 481, 169
- Wu et al. (2014) Wu, Y. W., Sato, M., Reid, M. J., Moscadelli, L., Zhang, B. et al. 2014, A&A, 566, 17
- Xu et al. (2013) Xu, Y., Li, J. J., Reid, M. J., Menten, K. M., Zheng, X. W. et al. 2013, ApJ, 769,15
- Zhang et al. (2013) Zhang, B., Reid, M. J., Menten, K. M., Zheng, X. W., Brunthaler, A. et al. 2013, ApJ, 775, 79