Stochastic analysis of bistability in coherent mixed feedback loops combining transcriptional and post-transcriptional regulations
Abstract
Mixed feedback loops combining transcriptional and post-transcriptional regulations are common in cellular regulatory networks. They consist of two genes, encoding a transcription factor and a small non-coding RNA (sRNA), which mutually regulate each other’s expression. We present a theoretical and numerical study of coherent mixed feedback loops of this type, in which both regulations are negative. Under suitable conditions, these feedback loops are expected to exhibit bistability, namely two stable states, one dominated by the transcriptional repressor and the other dominated by the sRNA. We use deterministic methods based on rate equation models, in order to identify the range of parameters in which bistability takes place. However, the deterministic models do not account for the finite lifetimes of the bistable states and the spontaneous, fluctuation-driven transitions between them. Therefore, we use stochastic methods to calculate the average lifetimes of the two states. It is found that these lifetimes strongly depend on rate coefficients such as the transcription rates of the transcriptional repressor and the sRNA. In particular, we show that the fraction of time the system spends in the sRNA dominated state follows a monotonically decreasing sigmoid function of the transcriptional repressor transcription rate. The biological relevance of these results is discussed in the context of such mixed feedback loops in Escherichia coli.
pacs:
87.10.Mn,87.10.Rt,87.16.A-,87.16.djI Introduction
Recent studies of the interactions between molecules in living cells revealed a complex interplay between regulatory interactions. The regulatory mechanism that was most thoroughly investigated is transcriptional regulation, in which transcription factor (TF) proteins bind to specific promoter sites on the DNA and regulate the transcription of downstream genes. Recently, the significance of post-transcriptional regulation by small non-coding RNA (sRNA) molecules has been recognized, and is now known to play a major role in cellular processes Storz2005 ; Gottesman2005 ; Hershberg2003 ; Levine2007 ; Altuvia2000 ; Gottesman2011 . It was suggested that this regulation mechanism would be energetically efficient, since the sRNA molecules are relatively short and are not translated into proteins Altuvia2000 . More recently, a quantitative analysis has shown that post-transcriptional regulation by sRNAs provides fine tuning of the regulation strength Baker2012 and is advantageous when fast responses to external stimuli are needed Levine2007 ; Shimoni2007 ; Mehta2008 .
Regulatory interactions (such as the ones presented above) can be described by a network in which genes and their products are represented by nodes, while the interactions between them are represented by edges. Analysis of such networks revealed structural modules or motifs, such as the auto-regulator and the feed-forward loop, which occur significantly more than randomly expected, and are expected to be of functional importance Milo2002 ; Shenorr2002 ; Yeger-Lotem2003 ; Yeger-Lotem2004 . Some of these motifs include only transcriptional regulation, while others combine different layers of regulation Shimoni2007 ; Yeger-Lotem2003 ; Yeger-Lotem2004 ; Zhang2005 ; Mandin2013 .
An important class of modules is the feedback loop, consisting of two genes, and , that regulate each other’s expression. A well studied example of such module, in which both regulations are at the transcriptional level, is the switch in E. coli Ptashne1992 . Such transcriptional feedback loop, referred to as the genetic toggle switch, was constructed using methods of synthetic biology and was shown to exhibit bistability Gardner2000 . Subsequent theoretical and numerical studies established the conditions under which bistability takes place in such systems Cherry2000 ; Kepler2001 ; Warren2004 ; Warren2005 ; Walczak2005 ; Lipshtat2006 ; Loinger2007 .
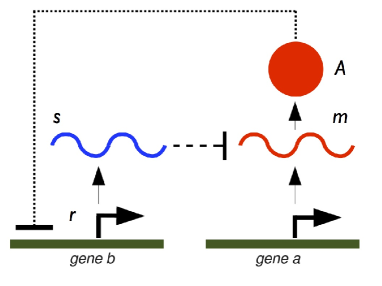
In mixed feedback loops (MFLs), the two genes regulate each other using two different regulation mechanisms. A common form of MFLs involves a gene a that expresses a TF and regulates gene b via transcriptional regulation, while gene b transcribes a sRNA and regulates gene a via post-transcriptional regulation by sRNA-mRNA interaction. In general, both the transcriptional regulator and the post-transcriptional regulator can act to either inhibit or activate their target. MFLs in which both regulations are negative (double-negative MFLs) belong to the class of coherent feedback loops in which the number of negative regulations is even. The positive-negative MFLs belong to the class of incoherent feedback loops. In general, coherent feedback loops tend to exhibit bistability while incoherent feedback loops tend to exhibit oscillations, under appropriate parameter settings. Schematic representation of the coherent MFL is shown in Fig. 1.
Integration of the transcriptional regulation network and the network of sRNA-mRNA interactions in E. coli has revealed that MFLs play important roles in various cellular contexts Shimoni2007 . A textbook example of such a module is the coherent MFL that consists of the TF Fur and the sRNA RyhB, involved in iron metabolism Masse2005 ; Masse2007 ; Vecercek2007 . Another example of a coherent MFL in E. coli consists of the TF Lrp and the sRNA MicF, involved in cellular response to variation in nutrient availability Holmqvist2012 .
Other examples of MFLs involving noncoding RNAs (microRNAs) were found in the human regulatory network, playing a role in human granulopoiesis Fazi2005 , various cancers Fujita2008 and monocytic differentiation and maturation Fontanta2007 . Further examples of MFLs were also found in Drosophila melanogaster Varghese2008 , in Vibrio harveyi Tu2008 , and in Caenorhabditis elegans Johnston2005 . The identification of feedback loops and mixed-feedback loops in the regulatory networks of various organisms hints to their important regulatory functions Bela2008 .
The dynamic behavior of MFLs involving protein-protein interaction was analyzed theoretically using deterministic analysis in the framework of rate equation models Francois2005 . It was shown that within suitable ranges of parameters, the double-negative (coherent) MFL exhibits bistability, while the positive-negative (incoherent) MFL exhibits oscillations. Similar results were recently obtained for MFLs involving sRNAs Liu2011 and microRNAs Zhou2012 .
Gene regulation processes are affected by fluctuations due to the stochastic nature of biochemical reactions and the fact that some of the molecules involved appear in low copy numbers. Therefore, in order to obtain a more complete understanding of the dynamic behavior of coherent MFLs and the emergence of bistability it is important to analyze these systems using stochastic methods which take into account the discrete nature of the interacting RNAs and proteins as well as the effects of fluctuations. Fluctuations in MFLs were previously characterized using stochastic methods Wang2011 ; Lloyd2013 . However, the lifetimes of the two bistable states and their dependence on the model parameters have not been studied.
In this paper we present a comprehensive analysis of the dynamics of a mixed coherent MFL involving transcriptional regulation and sRNA-mRNA interaction. The analysis is done using a combination of deterministic and stochastic methods, enabling us to identify the stable states of this system as well as the spontaneous, fluctuation-driven transitions between them. We calculate the average lifetimes of the two bistable states vs. parameters such as the transcription rates. As expected, we show that as the transcription rate of the mRNA, , is increased, the average lifetime of the state dominated by the transcriptional repressor, , increases, while the average lifetime of the state dominated by the sRNA, , decreases. Thus, for small values of the system spends most of its time in the sRNA dominated state, while for large values of it spends most of the time in the state dominated by the transcriptional repressor. This means that in the two limits the domination times of the two regulators are biased towards one of the two bistable states. The biological relevance of these observations is discussed in the context of such MFLs apparent in E. coli.
The paper is organized as follows. In Sec. II we present a deterministic analysis of the MFL and the results for the range of parameters in which bistability appears. In Sec. III we present a stochastic analysis, calculating the average lifetimes of the two bistable states vs. suitable parameters. The results are summarized and their biological relevance is discussed in Sec. IV. In Appendix A we present a detailed account of the experimental data we have used and the considerations we have made in order to determine the biologically relevant values of the rate coefficients used in our model. In Appendix B we extend the analysis of the bifurcation diagrams to a broader family of parameter variations and to the case in which the transcriptional repressor exhibits cooperative binding.
II Deterministic analysis
Consider an MFL in which gene a encodes a transcription factor and gene b encodes a small RNA. Gene a negatively regulates gene b by transcriptional regulation, while gene b negatively regulates gene a post-transcriptionally via sRNA-mRNA interaction. In this system gene a is transcribed into mRNA molecules, denoted by , which are translated into transcriptional repressor proteins, denoted by . Gene b is transcribed into sRNA molecules, denoted by . The transcriptional repressors negatively regulate gene b by binding to its promoter site, while the sRNAs negatively regulate gene a by binding to mRNA molecules, destabilizing them and inhibiting their translation.
Here we describe the dynamics of a single MFL, namely one TF gene and one sRNA gene, using rate equations. We denote the levels or copy numbers of the sRNA and mRNA molecules in the cell by and , respectively. The level of the sRNA-mRNA complex is denoted by . The number of free proteins is denoted by . The number of proteins that are bound to the promoter site of gene b is denoted by . For simplicity, we consider the case in which the regulation is performed by a single copy of the bound repressor. In this case, takes values in the range .
The rate coefficients and denote the transcription rates of genes a and b, respectively. The translation rate of gene a, namely the generation rate of proteins per copy of the mRNA molecule is denoted by . The degradation rates of the sRNAs, mRNAs and the proteins are denoted by , and , respectively. The binding rate of proteins to the promoter site of gene b is denoted by and their dissociation rate from the promoter is denoted by . The binding rate of sRNA and mRNA molecules to form a complex is denoted by . The sRNA-mRNA complex degrades at rate , or dissociates into its sRNA and mRNA components at rate . The processes taking place in the MFL and their rates are listed in Table I.
| Process | Rate | |
|---|---|---|
| 1 | ||
| 2 | ||
| 3 | ||
| 4 | ||
| 5 | ||
| 6 | ||
| 7 | ||
| 8 | ||
| 9 | ||
| 10 | ||
| 11 |
In Appendix A we consider the biologically relevant range of values of each of the rate coefficients used in the analysis of the MFL. These values are determined on the basis of experimental results and related considerations and interpretation. For the calculations and simulations presented below we chose a default value for each parameter, within the biologically relevant range. These default parameter values, =0.007, =0.43, =0.05, =0.003, =0.0008, =0.001, =0.02, =0.08 and =0.01, are used in all the Figures presented in this paper (unless stated otherwise). All the parameters are in units of sec-1.
The rate equations that describe this system take the form
| (1a) | ||||
| (1b) | ||||
| (1c) | ||||
| (1d) | ||||
| (1e) | ||||
where Eqs. (IIa) and (IIb) account for the time dependent levels of the mRNAs and sRNAs, respectively. Each of these equations includes a transcription term and a degradation term. They also include binding terms, which describe the formation rate of the sRNA-mRNA complex, and a term which represents the dissociation of the complex. The transcription term of includes the factor , which accounts for the fact that transcription takes place only when there is no repressor bound to the promoter. Eq. (IIc) accounts for the time dependent level of the protein, and includes translation and degradation terms as well as terms describing the binding/unbinding to/from the promoter. Eq. (IId) accounts for the level of proteins which are bound to the b promoter. Eq. (IIe) accounts for the level of the sRNA-mRNA complex.
The rate equations can be solved by direct numerical integration. For fixed values of the parameters and for a given choice of the initial conditions, the system tends to converge to a steady state. Coherent feedback loops such as the MFL tend to exhibit bistabily within a suitable range of parameters. In such cases, the steady state to which the rate equations converge depends on the initial conditions. Within the rate equation model, once the system converges to one of the bistable states, it remains there and does not switch to the other state.
Under steady state conditions (or in the limit in which the formation and dissociation processes of the sRNA-mRNA complex are fast) the effect of the dissociation process on the RNA and protein levels can be accounted for by a suitable adjustment of the binding rate coefficient . Therefore, the dissociation process is expected to be of secondary importance and does not affect the essential properties of the MFL.
In the analysis presented below it is assumed, for simplicity, that the dissociation rate , namely, once an sRNA-mRNA complex is formed, it goes to degradation rather than dissociate into its sRNA and mRNA components. Under this assumption, the level of the sRNA-mRNA complex, , has no effect on the levels of other components in the MFL. Therefore, the set of four equations (IIa)-(IId) can be integrated numerically or solved separately from Eq. (IIe).
Under steady state conditions, the time derivatives on the left hand side of Eqs. (II) vanish, and the rate equations are reduced to a set of coupled algebraic equations. These equations can be transformed into a single cubic equation of the form
| (2) |
For convenience we define the following dimensionless parameters: , , , and . The parameter represents the average number of mRNA molecules in the cell in the case that they are not regulated by sRNAs. The parameter is the ratio between the probabilites that a single sRNA will degrade or bind to a single mRNA target. Therefore, tends to decrease as the strength of the regulation by sRNAs increases. The parameter is inversely proportional to the level of proteins (when unregulated) and to their binding affinity to the promoter. Therefore, decreases as the transcriptional regulation of gene becomes stronger. The parameter represents the number of sRNA molecules which are transcribed during the average lifetime of an mRNA molecule. Using these parameters, we obtain a cubic equation for of the form
| (3) |
where , and . Depending on the values of the parameters, this equation may have either one or three real and positive solutions. In the first case, the system exhibits a single steady state. In the second case, it exhibits bistability, namely two stable steady states, while the third solution is unstable.
To analyze the existence and stability of the steady states of the MFL, it is useful to consider the bifurcation diagrams, presenting the steady state levels of and as a function of different parameters of the model. The stability of the solutions can be determined from the Jacobian of the set of rate equations and its eigenvalues.
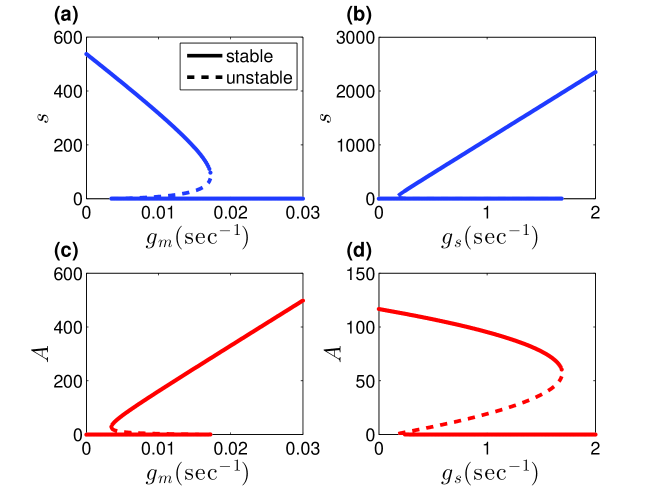
In Figs. 2(a) and 2(c) we present the levels of the sRNA and the protein under steady state conditions as a function of , obtained analytically from the rate equations. For small values of , a single steady state is observed, which is dominated by the sRNA. As increases, a bifurcation takes place and a second steady state, dominated by proteins, appears. A second bifurcation occurs at larger value, beyond which only a single stable steady state remains, which is dominated by the proteins. Similar results are presented in Figs. 2(b) and 2(d) as a function of .
In order to extend and exemplify the robustness of the results presented above, in Appendix B we present the bifurcation diagrams of the MFL obtained for different binding and unbinding kinetics of the TF to the sRNA promoter, a range of dissociation kinetics of the sRNA-mRNA complex, and different values of cooperativity of the TF to the sRNA promoter. In all cases, we observe a range of parameters in which bistability takes place.
III Stochastic analysis
In order to account for the effects of fluctuations in the MFL we analyze its dynamics using the master equation. Here the levels of the RNAs and protein take integer values, namely , while the level of the bound repressor, . The master equation accounts for the temporal variation of the probability distribution . It takes the form
| (4) | |||||
where for and 0 otherwise.
The first (second) term in this equation describes the transcription of mRNA (sRNA) molecules. The third term accounts for the translation of mRNAs into proteins. The term involving describes the binding of sRNA and mRNA molecules, to form an sRNA-mRNA complex. The terms involving and , describe the binding and dissociation of proteins to/from the promoter site of gene b, respectively. The last three terms correspond to the degradation of mRNAs, proteins and sRNA molecules, respectively.
In order to examine the properties of the steady state solution of the master equation, it is useful to consider the marginal probability distribution
| (5) |
In the formulation based on the master equation, the criterion for bistability is that the steady state solution exhibits two distinct peaks, separated by a gap in which the probabilities are low. The locations of these peaks on the plane correspond to the two bistable solutions of the rate equations.
In order to obtain the switching times between the two bistable states and estimate the probability distributions of the different possible discrete states of the system, we perform Monte Carlo (MC) simulations using the Gillespie algorithm Gillespie1977 . This is a kinetic MC approach, namely, an algorithm that generates ’paths’ of the stochastic process. At each time step the next move is drawn from all possible processes that may take place at that point, where each step is endowed with a suitable weight. After each move, the elapsed time is properly advanced, the list of available processes is updated and their new rates are evaluated.
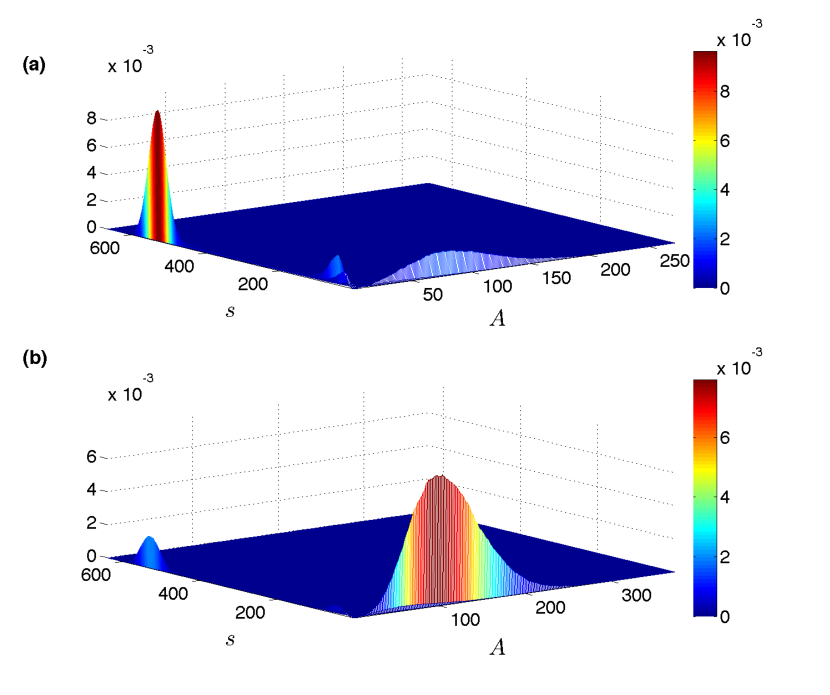
In Fig. 3 we present the probability distribution , generated by performing MC simulations ( sec each), and quantifying the relative fraction of time in which the system is found in each discrete state, averaged over initiations of the system at both the sRNA and TF dominated states. The probability distribution is presented for conditions under which the system is dominated by the sRNA regulator [Fig. 3(a)] and for conditions under which it is dominated by the transcriptional repressor [Fig. 3(b)]. In both cases the distribution exhibits two peaks representing the two bistable states. In the former case the peak dominated by sRNAs is large and the peak dominated by transcriptional repressors is small, while in the latter case the situation is reversed. The peak dominated by sRNAs is sharp and narrow while the peak dominated by the transcriptional repressors is broad. The volume of each peak represents the cumulative probability of microscopic states associated with the corresponding state of the system. It also represents the fraction of the time in which the system is expected to reside in that state.
We denote the mean lifetimes of the bistable states dominated by the sRNA and by the transcriptional repressor by and , respectively. To obtain the values of () we initialize the system in the state dominated by the sRNA (transcriptional repressor) and evaluate the average time elapsed until a transition to the () dominated state has occurred. The transition between states is defined as the point in which the level of the previous minority species exceeds that of the dominant species.
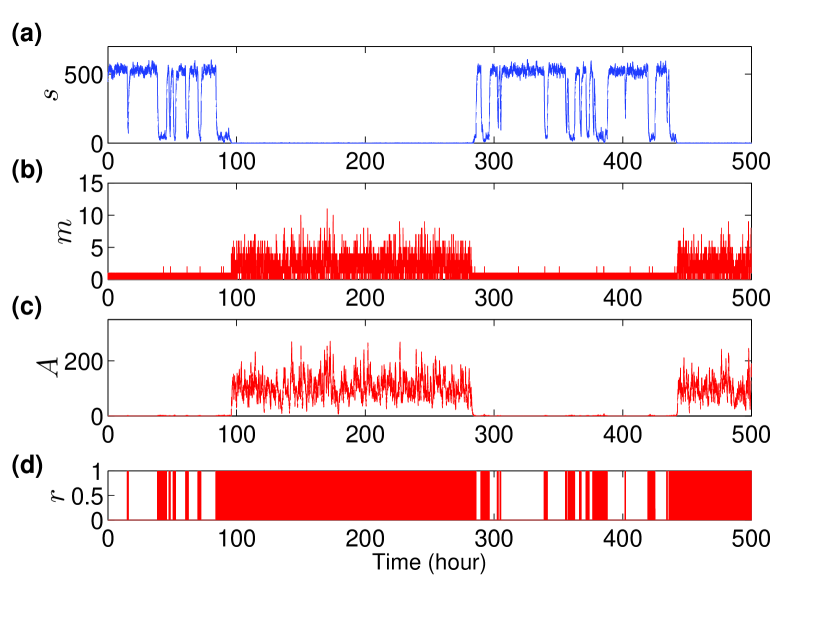
In Fig. 4 we present a typical result of an MC simulation of the MFL. The system is clearly bistable, with spontanous fluctuation-driven switching transitions. In the sRNA dominated state there are failed switching attempts, corresponding to the third, unstable steady state, in which the sRNA level is reduced, but is then recovered. In the dominated state, both the mRNA and protein levels exhibit large fluctuations, accompanied by fast binding/unbinding of proteins to/from the b promoter.
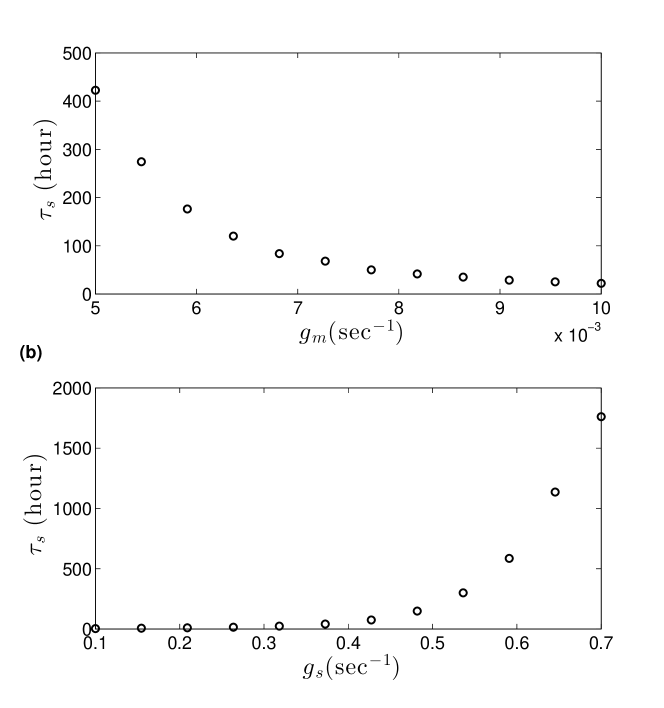
To examine the dependence of the lifetimes of the two bistable states on parameters, we present in Fig. 5 the lifetime of the sRNA dominated state, , as a function of the transcription rates of the mRNA and sRNA. As the transcription rate , is increased, the switching rate from the state dominated by the sRNA to the state dominated by the transcriptional repressor increases and the lifetime, , of the sRNA dominated state decreases [Fig. 5(a)]. On the other hand, when the transcription rate of the sRNA, , is increased, the lifetime of the sRNA dominated state, , increases [Fig. 5(b)].
Further insight into the balance between the two bistable states can be obtained by evaluating the fraction of the time in which the system resides in each state. The fraction of time in which the sRNA is dominant is given by
| (6) |
while the fraction of time the transcriptional repressor is dominant is .
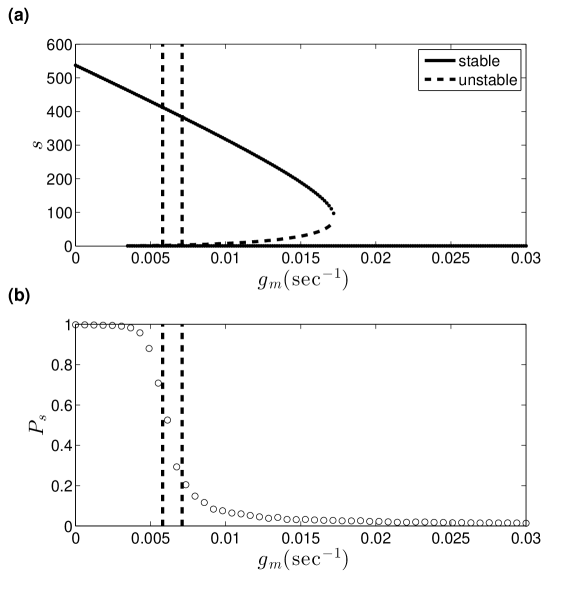
In Fig. 6(a) we present the bifurcation diagram for the sRNA level vs. , obtained from the rate equations, showing the range of values in which bistability takes place. In Fig. 6(b) we present the fraction of time, , in which the system resides in the sRNA dominated state vs. , obtained from MC simulations. follows a decreasing sigmoid function vs. . In the limit in which is small the system spends most of its time in the sRNA dominated state, while in the large limit it spends most of the time in the state dominated by the transcriptional repressor. It is found that in both limits, the MFL is biased towards one of the steady states.
IV Summary and Discussion
We have performed deterministic and stochastic analyses of the double-negative mixed feedback loop involving transcriptional regulation and post-transcriptional regulation via sRNA-mRNA interaction. Using deterministic methods, we identified the range of parameters in which these systems exhibit bistability. We have shown that within this range, the relative lifetimes of the two stable states ( and ) follow complementary sigmoid functions as parameters such as the transcription rates are varied. Different values may be beneficial for MFLs, or other bistable systems, under different biological contexts, yielding, at the population level, a bimodal distribution. Indeed, the relative lifetimes of biological bistable systems were extensively studied and were shown (both theoretically and experimentally) to exhibit a wide range of values acar2005 ; mirouze2012 ; santillan2008 ; Warren2004 ; Warren2005 ; maamar2007 ; isaacs2003 .
An important example of a double-negative MFL appears in E. coli, consisting of the genes fur (encoding a transcriptional repressor) and ryhB (encoding an sRNA). In presence of iron, the Fur repressor is active, repressing the transcription of the RyhB sRNA, as well as other genes involved in iron metabolism Masse2005 ; Masse2007 ; Vecercek2007 . Thus, fur plays the role of gene a in Fig. 1. When iron supply is limited, Fur becomes inactive and RyhB is transcribed. Fur synthesis is translationally coupled to that of an upstream open reading frame, whose translation is downregulated by RyhB Vecercek2007 . Therefore, ryhB plays the role of gene b in Fig. 1. When the iron level increases and the stress condition is removed, the level of Fur is restored and overrides the RyhB sRNA Masse2007 . Another relevant example of a double-negative MFL in E. coli consists of the global transcriptional regulator Lrp and the sRNA MicF Holmqvist2012 . Lrp activates genes that need to be expressed under nutrient-poor conditions while repressing genes that need to be expressed under nutrient-rich conditions. Accordingly, it was shown that Lrp is highly expressed under nutrient-poor conditions, while MicF is highly expressed under nutrient rich conditions. The results presented in this paper shed further light on the sensitivity of the dynamics of such MFLs to changes in effective parameters by external conditions, determining which of the two regulators dominates under given conditions, and to what extent.
V acknowledgements
This work was supported by grants from Israel Science Foundation and the Israel Ministry of Science and Technology granted to HM. MN is grateful to the Azrieli Foundation for the award of an Azrieli Fellowship.
Appendix A Rate coefficients
The equations that describe the MFL include a large number of rate coefficients for the rates of the transcription, translation, binding, unbinding and degradation processes. To obtain results and predictions that are biologically meaningful, one should use rate coefficients that are in the biologically relevant range. While the analysis performed in this paper is quantitative, the conclusions are of a qualitative nature and describe the generic behavior of the MFL. Below we discuss in more detail the considerations we have made in order to identify the biologically relevant range of each parameter.
A.1 Transcription and degradation rates of mRNAs
Previous analyses have revealed that the rate limiting step in the transcription is usually the delay between the binding of RNA polymerase to the promoter site and the beginning of the elongation process Mcclure1980 . Measurements have shown that this time lag exhibits great variation between different genes and under different conditions, and takes values between 20 seconds and 10 minutes. The delay time can be represented by the transcription initiation rate, taking values in the range molecules per second. Recent measurements of mRNAs in single cells showed that for the gene that was studied, an mRNA molecule is produced every 7 minutes, which amounts to a transcription rate of (sec-1) Golding2005 . The half life of mRNA is typically in the range between 30 and 300 (sec). This yields mRNA degradation rates in the range ().
A.2 Transcription and degradation rates of sRNAs
An example of a small RNA in E. coli, on which extensive experimental measurements were performed is OxyS. This sRNA appears in high copy numbers Altuvia1997 . In the absence of target mRNAs, it was found to have a half-life of 12-15 minutes, which is longer than most mRNAs (with typical half-life of 2-4 min). In order to allow for variations between different sRNAs, we choose a broader range of half life values, translating to sRNA degradation rates in the range ().
Values reported for generation rates of various sRNAs were in the range (). The lower limit was reported in Levine2007 . The upper Limit was obtained by assuming that the steady state level of oxyS was due to synthesis and degradation processes, Altuvia1997 .
A.3 Protein synthesis and degradation rates
Measurements of protein synthesis rates are reported in Ref. Kennell1977 . It was shown that a protein can be translated from each mRNA molecule every 3-4 seconds. To cover a broad range of biologically relevant translation rates, we take the range of 2-20 seconds. This corresponds to translation rate coefficients in the range (sec-1).
Transcription factors are usually short lived, with half life of a few minutes. Thus, we consider degradation rates in the range (sec-1).
A.4 Binding rates of sRNAs to their mRNA targets
Measurements of the binding of the sRNA OxyS to its mRNA target fhlA, performed in vitro, are reported in Ref. Altuvia1997 . In these experiments 2nM of the OxyS sRNA were mixed with different concentrations of the fhlA mRNA. After 5 minutes the concentration of free OxyS was measured. It was found that when the concentration of the fhlA mRNA was 25nM, half of the OxyS molecules were bound after 5 minutes. This was done in vitro, where the synthesis of new sRNA and mRNA molecules as well as their degradation were suppressed. Denoting the level of OxyS by and of the fhla mRNA by , the dynamics can be described by
| (7) |
This means that under these conditions the difference between the levels of and remains constant. Assuming that the initial levels at time satisfy , we can solve this equation and obtain
| (8) |
Setting the initial conditions and fitting the binding rate coefficient such that after 5 minutes the sRNA concentration goes down to a half of the initial concentration , we obtain that . Taking the E. coli cell volume as liters, we obtain 1nM=0.6 molecules per cell, giving (sec-1). Since this experiment was carried out without Hfq, which is a catalyst of the reaction, it is reasonable to take a range of values which express faster binding. This would most likely also account for variations in the binding rates of other sRNA molecules to other mRNAs. We therefore take the range (sec-1).
A.5 Transcription factor binding/unbinding rates
The binding and unbinding rates of two transcription factors in two E. coli strains to/from their specific promoter sites on the DNA were measured in Ref. Henriksson2007 . Using surface plasmon resonance, which can monitor the time dependent changes in concentrations, they found binding rates of (sec-1). This means that a transcription factor would bind to the DNA within 7-11 seconds. Measuring the ratio between bound and free DNA yields the ratio between the binding and dissociation rates. The values that were obtained for the dissociation rate are in the range of (sec-1). This in turn means that a transcription factor stays bound to the promoter site for 1000 to 2000 seconds. To make the range more dynamic and account for weaker transcriptional repression we choose the ranges (sec-1), and (sec-1).
Appendix B Extended stability analysis
Here we investigate how the MFL bifurcation diagram is affected by a broad family of parameter variations and modifications of the network. In Fig. 2 we showed the bifurcation diagrams for the parameters and , representing the transcription rates of the TF and sRNA, respectively. Here we further present the bifurcation diagrams for the binding and unbinding rates of the TF to the sRNA promoter, denoted by and , respectively, and the dissociation rate of the sRNA-mRNA complex, denoted by . In addition, we examine the effect of cooperativity of the binding of the TF, , to the sRNA promoter which is characterised by the Hill coefficient . The rate equations describing the MFL with cooperative binding take the form
| (9a) | ||||
| (9b) | ||||
| (9c) | ||||
| (9d) | ||||
| (9e) | ||||
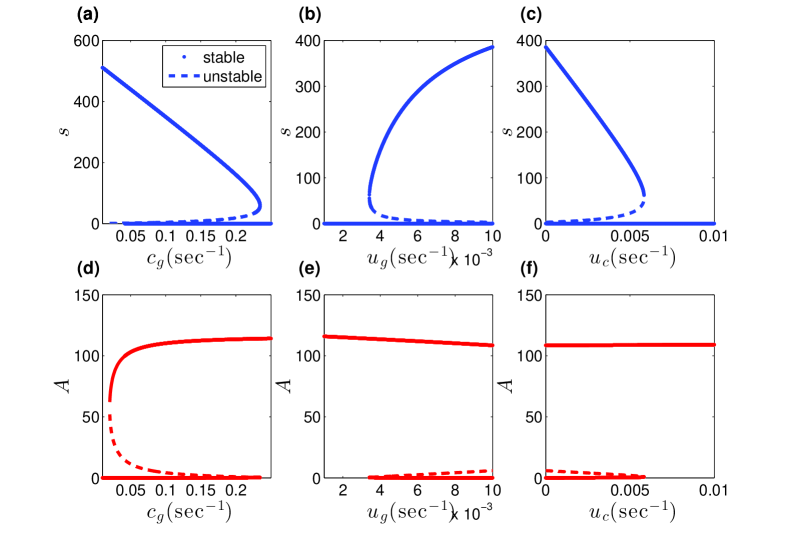
For the results presented below, we take the following default parameter values: =0.007, =0.43, =0.05, =0.003, =0.0008, =0.001, =0.02, =0.08, =0.01, =0.003, =1. All the parameters are in units of sec-1, except for which is dimensionless. In Figs. 7(a,b) and 7(d,e) we present the levels of the sRNA and the protein under steady state conditions as a function of and , respectively, obtained analytically from the rate equations. The ranges of and agree with those presented in Appendix A. As expected, the effect of (binding of the TF to the sRNA promoter) opposes that of (unbinding); as increases or decreases, the TF strengthens its repressive role over the sRNA. More specifically, for small values of , a single steady state, dominated by the sRNA, is observed. As increases, a bifurcation takes place and a second steady state, dominated by proteins, appears. A second bifurcation occurs at larger value, beyond which only a single stable steady state remains, which is dominated by the proteins. For small values of , a single steady state, dominated by the TF, is observed, As increases, a bifurcation takes place and a second steady state, dominated by the sRNA, appears. In Figs. 7(c) and 7(f) we present the levels of the sRNA and the protein as a function of . Here, increasing ’weakens’ the sRNA state, yielding, following a bifurcation, a single steady state, dominated by .
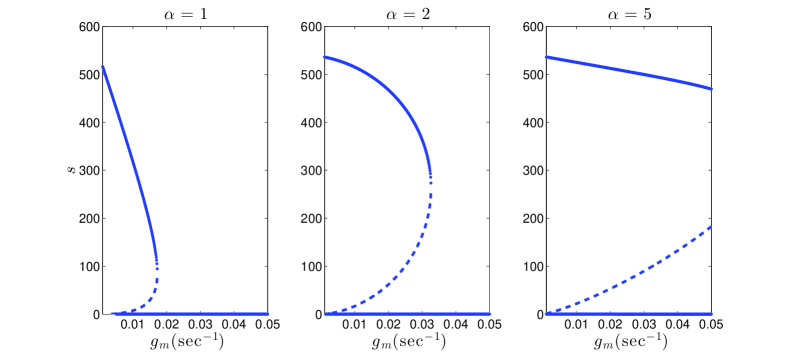
Next, we consider the effect of the cooperativity, as expressed by the Hill coefficient in Eq. 9, of the binding of the TF protein to the sRNA promoter on the stability. In Fig. 8 we present the bifurcation diagram showing the level of as a function of , for different values of (). The range of agrees with that presented in Appendix A. As expected, as cooperativity increases, the repression by weakens and the state strengthens. This is expressed as a higher-level steady state and delayed bifurcation (in terms of ) for higher , as can be seen in Fig. 8. Note that for , is simply the binding rate of the transcriptional repressor to the sRNA promoter. For , it represents the overall rate of a more complicated process, which includes the assembly of a repressor complex of repressors, and its binding to the promoter site.
References
- (1) G. Storz, S. Altuvia, and K. M. Wasserman, Annu. Rev. Biochem. 74, 199 (2005).
- (2) S. Gottesman, Trends Genet. 21, 399 (2005).
- (3) R. Hershberg, S. Altuvia, and H. Margalit, Nucleic Acids Res. 31, 1813 (2003).
- (4) T. K. E. Levine, Z. Zhang and T. Hwa, PLoS Biol 5, e229 (2007).
- (5) E. G. S. Altuvia and H. Wagner, Proc. Natl. Acad. Sci. US 97, 9824 (2000).
- (6) S. Gottesman and G. Storz, Cold Spring Harb Perspect Biol. 3, 1 (2011).
- (7) C. Baker, T. Jia, and R.V. Kulkarni, Phys. Rev. E 85, 061915 (2012).
- (8) Y. Shimoni, G. Friedlander, G. Hetzroni, G. Niv, S. Altuvia, O. Biham, and H. Margalit, Mol. Sys. Biol. 3:138, 5 (2007).
- (9) P. Mehta, S. Goyal and N.S. Wingreen, Mol. Sys. Biol. 4, 221 (2008).
- (10) R. Milo, S. Shen-Orr, S. Itzkovitz, N. Kashtan, D. Chklovskii, and U. Alon, Science 298, 824 (2002).
- (11) S. S. Shen-Orr, R. Milo, S. Mangan, and U. Alon, Nature Genetics 31, 64 (2002).
- (12) E. Yeger-Lotem and H. Margalit, Nucleic Acids Res. 31, 6053 (2003).
- (13) E. Yeger-Lotem, S. Sattath, N. Kashtan, S. Itzkovitz, R. Milo, R. Y. Pinter, U. Alon, and H. Margalit, Proc. Natl. Acad. Sci. US 101, 5934 (2004).
- (14) L. V. Zhang, O. D. King, S. L. Wong, D. S. Goldberg, A. H. Tong, G. Lesage, B. Andrews, H. Bussey, C. Boone, and F. P. Roth, J. biol. 4, 6 (2005).
- (15) P. Mandin and M. Guillier, Current Opinion Microbiol. 16, 125 (2013).
- (16) M. Ptashne, A Genetic Switch: Phage and Higher Organisms, 2nd edition. (Cell Press and Blackwell Scientific Publications, Cambridge, MA, 1992).
- (17) T. S. Gardner, C. R. Cantor, and J. J. Collins, Nature 403, 339 (2000).
- (18) J.L. Cherry and F.R. Adler, J. Theor. Biol. 203, 117 (2000).
- (19) T. B. Kepler and T. C. Elston, Biophys. J. 81, 3116 (2001).
- (20) P. B. Warren and P. R. ten Wolde, Phys. Rev. Lett. 92, 128101 (2004).
- (21) P. B. Warren and P. R. ten Wolde, J. Phys. Chem. B 109, 6812 (2005).
- (22) A. M. Walczak, M. Sasai, and P. Wolynes, Biophys. J. 88, 828 (2005).
- (23) A. Lipshtat, A. Loinger, N. Q. Balaban, and O. Biham, Phys. Rev. Lett. 96, 188101 (2006).
- (24) A. Loinger, A. Lipshtat, N. Q. Balaban, and O. Biham, Phys. Rev. E 75, 021904 (2007).
- (25) E. Massé, C. K. Vanderpool, and S. Gottesman, J. Bacteriol. 187, 6962 (2005).
- (26) E. Massé, H. Salvail, G. Desnoyers, and M. Arguin, Current Opinion Microbiol. 10, 140 (2007).
- (27) B. Vecerek, I. Moll, and U. Blasi, EMBO J. 26, 965 (2007).
- (28) E. Holmqvist, C. Unoson, J. Reimegard and E.G.H. Wagner, Mol. Microbiol. 84, 414 (2012).
- (29) F. Fazi, A. Rosa, A. Fatica, V. Gelmetti, M. L. D. Marchis, C. Nervi, and I. Bozzoni, Cell 123, 819 (2005).
- (30) S. Fujita, T. Ito, T. Mizutani, S. Minoguchi, N. Yamamichi, K. Sakurai, and H. Iba, J. Mol. Biol. 378, 492 (2008).
- (31) L. Fontana, E. Pelosi, P. Greco, S. Racanicchi, U. Testa, F. Liuzzi, C. M. Croce, E. Brunetti, F. Grignani, and C. Peschle, Nat. Cell Biol. 9, 775 (2007).
- (32) J. Varhese and S. M. Cohen, Genes & Dev. 21, 2277 (2008).
- (33) K. C. Tu, C. M. Waters, S. L. Svenningsen, and B. L. Bassler, Mol. Microbiol. 70, 896 (2008).
- (34) R. J. Johnston, S. Chang, J. F. Etchberger, C. O. Ortiz, and O. Hobert, Proc. Natl. Acad. Sci. US 102, 12449 (2005).
- (35) B. Novak and J. J. Tyson, Nat Rev Mol Cell Biol 9, 981 (2008).
- (36) P. François and V. Hakim, Phys. Rev. E 72, 031908 (2005).
- (37) D. Liu, X. Chang, Z. Liu, L. Chen and R. Wang, Plos One 6, e17029 (2011).
- (38) P. Zhou, S. Cai, Z. Liu and R. Wang, Phys. Rev. E 85, 041916 (2012).
- (39) S. Wang and S. Raghavachari, Phys. Biol. 8, 055002 (2011).
- (40) J. Lloyd-Price and A. S. Ribeiro, Phys. Rev. E 88, 032714 (2013).
- (41) D. T. Gillespie, J. Phys. Chem. 81, 2340 (1977).
- (42) M. Acar, A. Becskei, and A. van Oudenaarden, Nature 435, 228 (2005).
- (43) N. Mirouze, Y. Desai, A. Raj, and D. Dubnau, PLoS genetics 8, e1002586 (2012).
- (44) M. Santilln, Biophys. J. 94, 2065 (2008).
- (45) H. Maamar, A. Raj, and D. Dubnau, Science 317, 526 (2007).
- (46) F. J. Isaacs, J. Hasty, C. R. Cantor, and J. J. Collins, Proc. Natl. Acad. Sci. US 100, 7714 (2003).
- (47) W. R. McClure, Proc. Natl. Acad. Sci. US 77, 5634 (1980).
- (48) I. Golding, J. Paulsson, S. M. Zawilski, and E. C. Cox, Cell 123, 1025 (2005).
- (49) S. Altuvia, D. WeinsteinFischer, A. Zhang, L. Postow, and G. Storz, Cell 90, 43 (1997).
- (50) D. Kennell and H. Riezmak, J. Mol. Biol. 114, 1 (1977).
- (51) P. Henriksson-Peltola, W. Sehlén, and E. Haggård-Ljungquist, Nucleic Acids Res. 35, 3181– (2007).