Smoothing Rotation Curves and Mass Profiles
Abstract
We show that spiral activity can erase pronounced features in disk galaxy rotation curves. We present simulations of growing disks, in which the added material has a physically motivated distribution, as well as other examples of physically less realistic accretion. In all cases, attempts to create unrealistic rotation curves were unsuccessful because spiral activity rapidly smoothed away features in the disk mass profile. The added material was redistributed radially by the spiral activity, which was itself provoked by the density feature. In the case of a ridge-like feature in the surface density profile, we show that two unstable spiral modes develop, and the associated angular momentum changes in horseshoe orbits remove particles from the ridge and spread them both inwards and outwards. This process rapidly erases the density feature from the disk. We also find that the lack of a feature when transitioning from disk to halo dominance in the rotation curves of disk galaxies, the so called “disk-halo conspiracy”, could also be accounted for by this mechanism. We do not create perfectly exponential mass profiles in the disk, but suggest that this mechanism contributes to their creation.
Subject headings:
galaxies: kinematics and dynamics – galaxies: spiral – galaxies: structure1. Introduction
Galaxies at high redshift (e.g. Conselice et al., 2011; Newman et al., 2013) appear far from smooth, and theory (see §1.1) suggests tumultuous evolution during their early stages of formation. Yet present-day galaxy disks have remarkably regular properties and obey quite tight scaling relations (e.g. Tully & Fisher, 1977). In particular, since they are built from baryonic material that seems most unlikely to arrive with a smooth distribution of angular momentum, we require an explanation as to why they have near-exponential light profiles (Freeman, 1970) and smooth rotation curves.
Deep photometry (e.g. van der Kruit, 2007; Erwin et al., 2008; Martín-Navarro et al., 2014) has revealed that minor departures from the exponential light profile are common (see van der Kruit & Freeman, 2011, for a review), but most gradient changes in the light profile are gentle, and there are no abrupt discontinuities.
The rotation curves, or radial variation of the circular speed, of spiral galaxies today also have well-defined regularities (e.g. Sofue & Rubin, 2001, for a review). The overall shape of the rotation curve correlates with the luminosity and circular speed in the galaxy (Persic et al., 1996): slow rises that are almost continuous to the last measured point characterize low-luminosity galaxies, a generally flat behavior is found in galaxies, while a peak at small radii followed by a modest decline before flattening out is often found in very bright galaxies (e.g. Spekkens & Giovanelli, 2006; de Blok et al., 2008; Salucci et al., 2007; Yegorova et al., 2012).
However, our present interest is less the overall shape, and more the general lack of pronounced features in most rotation curves (see also §1.2). Bahcall & Casertano (1985) not only highlighted this point, and coined the phrase “disk-halo conspiracy” to describe the featureless transition from baryon dominated inner rotation curve (see §1.3) to the DM dominated outer parts, where that can be traced by the 21cm emission line of H I.
It should be noted that rotation curves are not completely featureless. In particular, Sancisi (2004) stresses that where a feature is present in the rotation curve it corresponds to a feature in the observed light profile, or vice-versa; a phenomenon that has become known as “Renzo’s rule”. He discusses six example galaxies to illustrate the rule. A further case is the dwarf spiral galaxy NGC 1560 (e.g. Broeils, 1992; Gentile et al., 2010). However, pronounced features such as this are rare, and most cases discussed by Sancisi required high quality data to be convincing.
In this paper, we suggest a possible explanation for the general smoothness and lack of pronounced features in the light profiles and rotation curves of disk galaxies. We show that any pronounced features that are introduced into the disk mass profile are quickly smoothed away by spiral activity, leaving at most mild, and correlated, variations in both the surface density and circular speed curve.
1.1. Galaxy formation
The disks of galaxies are believed to grow in dark matter (DM) halos through the settling of gas into a rotationally-supported disk, which subsequently forms stars on near-circular orbits. The original picture, sketched by White & Rees (1978), Fall & Efstathiou (1980), Gunn (1982) and others, was that hot gas would cool in the dense halos, but it has been extended to include cold flows (e.g. Kereš et al., 2005; Dekel & Birnboim, 2006). The current idea is of “inside out” disk growth (e.g. Matteucci & Francois, 1989; Bird et al., 2013) since the later accreted material is expected to have greater angular momentum about the halo center.
The CDM paradigm (e.g. Springel et al., 2006), suggests galaxy growth is more a story of continuous mass assembly both of the dark and baryonic matter, punctuated by merger events with a range of masses, which are believed to have been frequent in the early stages and to have tailed off towards the present epoch (e.g. Zepf & Koo, 1989; Carlberg et al., 1994; Patton et al., 1997, 2002; Conselice et al., 2003; Lotz et al., 2006, 2008; Jogee et al., 2008; Bertone & Conselice, 2009; Lotz et al., 2011). The principal plane of the disk is determined by the net angular momentum vector of the baryons, which probably slews over time, as does the DM halo shape and mass profile (Katz & Gunn, 1991; Kazantzidis et al., 2004; Schneider et al., 2012; Aumer & White, 2013, e.g.). Furthermore, current galaxy formation models (Silk, 2003) favor rapid star-formation for massive galaxies, especially in the early stages, that preferentially depletes low-angular momentum gas (e.g. Brook et al., 2011; Kauffmann, 2014; Übler et al., 2014), with wind material being recycled (Oppenheimer & Davé, 2008; Oppenheimer et al., 2010). The removal of low-angular momentum material has the advantage of reducing the expected mass of the inner disk and bulge, which would otherwise be hard to reconcile with galaxy mass distributions (van den Bosch, 2001; Sharma & Steinmetz, 2005; Dutton, 2009; Sharma et al., 2012).
The steep density profile that the DM halo acquires (e.g. Navarro et al., 1996) as subhalos merge hierarchically is further compressed by the increasing central attraction from the gas that cools, settles and forms stars near their centers. This halo compression (e.g. Blumenthal et al., 1986; Gnedin et al., 2004; Sellwood & McGaugh, 2005) has been suggested as a means to explain the disk-halo conspiracy (e.g. Burstein & Rubin, 1985), although they suppose that the baryons nowhere dominate the central attraction.
1.2. Rotation curve from the disk
The connection between the circular speed and the surface density in a disk is more complicated than for spherical masses (Toomre, 1963; Casertano, 1983), because Newton’s first theorem (e.g. Binney & Tremaine, 2008) does not hold for flattened mass distributions. In particular, the central attraction in the plane of a massive, axisymmetric, flat ring is radially outwards over a short radial range just interior to the ring, and it greatly exceeds the inwards Newtonian attraction of an equal central mass immediately exterior to the ring. This behavior is particularly pronounced in the case of razor-thin rings, and is only gradually weakened as the ring is thickened vertically. Thus ring-like features in the mass distribution of an otherwise smooth, thin disk can readily give rise to local features in the rotation curve. Naturally, the sensitivity of the rotation curve to local variations in disk surface density becomes less pronounced when the disk contributes only a fraction of the central attraction, with the remainder coming from a near-spherical bulge and/or halo.
Features such as “bumps and wiggles” have also been noted in some studies of long-slit rotation curves (e.g. Kalnajs, 1983; Kent, 1986) and of Fabry-Perot velocity maps (e.g. Palunas & Williams, 2000). These variations in the circular velocity profile can often be related to features in the spiral structure of the disk galaxy being observed. Streaming motion along the spiral arms of the galaxy provide a reasonable explanation for the existence of these features in the rotation curves.
1.3. Disk mass
A well-observed 1D rotation curve gives an excellent measure of the total central attraction in the disk mid-plane, but does not contain enough information to determine the separate contributions of the baryons and DM (e.g. van Albada et al., 1985). The concept of the maximum disk was introduced by van Albada & Sancisi (1986) in order to place a lower bound on the DM content of galaxy, by giving the greatest possible mass to the visible matter, limited only by the requirements that the combined rotation curve nowhere exceeds that observed and the halo mass distribution should not be hollow. This was later refined by Sackett (1997), who defined a maximum disk model of a galaxy to be one in which % of the circular speed is due to the stellar disk and bulge, if present, components at disk scale lengths. This choice of radius is where the circular speed of an exponential disk reaches its peak value. Similarly a model has a submaximal disk if the baryon fraction contributes less at that same radius.
While there is general agreement that the baryons contribute only a small fraction of the central attraction at most radii in low-luminosity galaxies (e.g. Carignan & Freeman, 1985) and in low-surface brightness galaxies (e.g. de Blok & McGaugh, 1997), there is no consensus as yet on whether large disk galaxies are, or are not, close to maximal. For example, Weiner et al. (2001) and Bershady et al. (2011) reach diametrically opposing conclusions from different dynamical methods to estimate the stellar mass. The above-noted “Renzo’s rule” is a weak example of a number of indirect arguments that strongly suggest that disks are more nearly maximal. Other arguments are as follows:
Debattista & Sellwood (2000) showed that the rotation rates of bars in submaximal disks are slowed to an extent that is inconsistent with those observed. Despite a number of critical papers, no counter-example has been substantiated to weaken this constraint (see Sellwood, 2014; Sellwood & Debattista, 2014, for a full discussion).
The linear scale for dynamical instabilities in a rotationally supported disk is (Toomre, 1964)
| (1) |
For a fixed rotation curve, i.e. with no change to the radial variation of the epicycle frequency , this scale varies with the disk surface density . Swing amplification (Goldreich & Lynden-Bell, 1965; Julian & Toomre, 1966; Toomre, 1981; Binney & Tremaine, 2008; Sellwood, 2013) is strongest where the wavelength of an -armed disturbance around its corotation circle
| (2) |
Thus higher disk mass, , favors lower multiplicity patterns (Sellwood & Carlberg, 1984; Athanassoula et al., 1987). It should be noted that the patterns in many galaxies are dominated by 2- and 3-fold symmetry (e.g. Davis et al., 2014), indicating heavy disks.
Furthermore, if disk galaxies were indeed submaximal, lower mass to light ratio, , for the stellar component would require an increased DM fraction within the optical radius, which would increase the expected scatter in the Tully-Fisher relation between velocity and luminosity (e.g. Zwaan et al., 1995; McGaugh et al., 2000).
Thus if galaxy disks are massive, the general smoothness of rotation curves requires the disk to have a smooth density profile, even though galaxy formation models (reviewed above) suggest that the infalling matter is most unlikely to arrive with a smooth distribution of angular momentum. It also strengthens the significance of the “disk-halo conspiracy”, for which no convincing explanation has yet been proposed.
1.4. Smoothing mechanism
If all material that settles into the disk conserves its detailed angular momentum, then galaxy formation models would need to be finely tuned to create the smooth mass profiles that we observe in disks today. We noted in §1.1 that galaxy formation models already require outflow of preferentially low material. Material having higher , possibly in the form of cold flows (e.g. Kereš et al., 2005; Dekel & Birnboim, 2006; Stewart et al., 2013), will settle into centrifugal balance at some radius in the disk determined by its .
Past ideas for angular momentum rearrangement to create exponential profiles include bar formation (Hohl, 1971; Debattista et al., 2006; Minchev et al., 2012), a simple analogy with accretion disks (Lin & Pringle, 1987; Ferguson & Clarke, 2001), and scattering off massive clumps in the disk (Elmegreen & Struck, 2013).
Lovelace & Hohlfeld (1978) first argued that spiral instabilities could be responsible for featureless rotation curves. Sellwood & Moore (1999) noticed, while conducting an unrelated study, that as a galactic disk grew in their models with a dense central mass and a rigid halo, the distribution of mass in the disk was rearranged such that the resulting rotation curve was surprisingly featureless. Here, we explore this topic in greater depth using a set of simulations similar to those used in Sellwood & Moore (1999) in order to determine the effectiveness of spiral-driven evolution to smooth out even quite unrealistically non-smooth accreted mass.
| Run | Initial | Final | Mass | Mean | Annulus | Time | Step | Grid | Size | Disk | Disk | Bulge | halo |
|---|---|---|---|---|---|---|---|---|---|---|---|---|---|
| particles | particles | added/ | Radius | Width | run | size | type | mass | mass | ||||
| A | kt | isot(0.5) | |||||||||||
| B | kt | isot(0.7) | |||||||||||
| C | kt | isot(0.7) | |||||||||||
| C | |||||||||||||
| C | |||||||||||||
| C | |||||||||||||
| D | kt | isot(0.7) | |||||||||||
| D | |||||||||||||
| D | |||||||||||||
| D | |||||||||||||
| E | kt | isot(0.7) | |||||||||||
| E | |||||||||||||
| E | |||||||||||||
| E | |||||||||||||
| F | kt | isot(0.7) | |||||||||||
| G | exp | hern(36)) | |||||||||||
| M | mtz | ||||||||||||
| N | mtz |
Note. — Column 1: Identification for the simulation. Column 2: Log of initial number of particles. Column 3: Log of final number of particles. Column 4: Log of fraction of unit mass added per dynamical time . Column 5: Location of annulus of added particles in system units . Column 6: Width of the annulus in . Column 7: Duration of the simulation in . Column 8: Time step in . Column 9: Numbers of grid rings, spokes, and planes; , . Column 10: Truncation radius of the initial disk in . Column 11: Type of initial disk; “kt” is the Kuzmin-Toomre disk, and “mtz” is the Mestel disk. Column 12: Initial disk mass fraction. Column 13: Initial bulge mass fraction. A repeated line indicates that the mean radius of annulus was changed during the simulation. Column 14: Halo type and parameter; “isot” is a cored isothermal halo which asymptotes to the value of the circular velocity provided in the parentheses, “hern” is a Hernquist profile with a mass times that of the disk and a scale radius of , and the halo are rigid potentials of the same form as the Mestel disk, with of the total mass.
2. Methods
We use -body simulations of a growing disk in order to examine the effects of spiral activity on the distribution of matter within a disk and consequently the shape of the rotation curve. Our models have both central bulges and extensive halos, and we represent these spheroidal components as rigid, unresponsive matter that contributes only to the central attraction experienced by the disk particles. This approximation has not only reduced the computational effort by a substantial factor, but it has also enabled us to study the effects of spiral activity in the disk, which is the major science goal of this paper, without the complications of changes to the halo density. We defer to a subsequent paper a study of the effects of adiabatic contraction and angular momentum exchange between the disk and live spheroidal components.
2.1. Initial disk, bulge and halo
Most of the models we present start with a Kuzmin-Toomre disk (Toomre, 1963, model 1) that has the surface density
| (3) |
where is the cylindrical radius, a notional mass, the disk mass fraction, and a length scale. We truncated the disk at . The rigid bulge has the Hernquist (1990) density profile
| (4) |
where is the spherical radius, is the bulge mass, and is a length scale. The halo component has a cored isothermal density profile
| (5) |
where is the asymptotic circular speed, and is the core radius. For model A (Table 1), the disk mass , the Hernquist bulge has and , while the cored isothermal halo has (defined in §2.2) and . The parameters of other models are given in Table 1.
The initial in-plane particle velocities were chosen such that Toomre’s , the particles were spread vertically about the mid-plane with a Gaussian density profile having a standard deviation of , and they were given vertical velocities derived from the 1D Jeans equation.
This near-equilibrium initial disk developed a bar in most cases. As we here wish to study the effects of spirals only, we allow the bar to form and settle, and then rearrange the particles by selecting a new azimuth for each, chosen at random from a uniform distribution, while preserving all the other phase space coordinates in cylindrical polar geometry. This “shuffling” procedure, which was also used by Hohl (1971), destroys the bar and, because the inner disk is now dynamically hot, helps to prevent future bar formation in the disk as the model is evolved.
Our accretion experiments begin with this hot disk, and it is therefore of no significance to this study what occurred to the disk prior to the addition of mass. We simply use this early part of the evolution to create an initial, axisymmetric, bar-stable disk as a suitable initial model.
2.2. Units
We adopt as our unit of mass and as our unit of length. Thus our unit of velocity is and time unit, or dynamical time, is . Henceforth, we use units such that . A suitable scaling to physical units for most of our models is to choose kpc and Myr, which yields M⊙ and km/s, but other scalings would be more appropriate for some of our models.
2.3. Accretion rules
We wish to mimic disk growth in a manner that enables us to control the distribution of accreted matter. We therefore add particles to the disk placing them on circular orbits at a chosen radius and randomly distributed in azimuth, which crudely mimics the settling of gas that subsequently forms stars. This technique captures the single most important dynamical consequence of gas dissipation, because it supplies dynamically cool particles that can participate in subsequent spiral activity, which would otherwise fade as random motion rises among the older particles.
We employ a wide variety of rules for the addition of fresh material in order to explore the extent to which spiral activity can rearrange matter within in the disk. Therefore, the rules are not always realistic, and were deliberately chosen to be quite unrealistic in some cases, in order to determine whether the outcome of disk growth is, or is not, sensitive to the distribution of angular momentum in the accreted matter. In all cases, we have added particles to the disk in one or more annuli, with various mean radii and widths, and have experimented with both uniform and Gaussian distributions for the particles in the annulus.
We have experimented with a variety of accretion rules, by varying the following parameters:
-
•
The radial extent of the annulus: it ranged from a delta function to one having a width , with being the most often used.
-
•
The mean radius of the annulus, was varied over a wide range: .
-
•
The rate of accretion of new particles, which ranged over to , in units of , the notional mass, per dynamical time. Larger values tended to cause the models to develop bars quickly, or for large numbers of particles to leak off the grid, or both.
-
•
The radial profile of the accretion annulus. All simulations in Table 1 used radii chosen from a uniform distribution. We also tried experiments with radii selected from a Gaussian in , for which the results were quite similar.
-
•
The mean radius of the annulus was changed over time, in some cases. We experimented both with stepping the mean outwards with time, to be consistent with “inside-out” growth, and we also tried “outside-in” growth in a few cases.
-
•
All the above rules were axisymmetric, but we also tried azimuthally localized accretion. Accretion onto a fixed azimuth as the disk rotates underneath, which is more what might be expected, leads over time to an almost axisymmetric ring. However, as an extreme example, we rotated the accreting patch at the local circular speed to ensure the build-up a strongly non-axisymmetric distribution. (Note that since we suppress the dipole term in the field determination, this is effectively adding matter in two patches 180∘ apart.)
2.4. Numerical details
We compute the gravitational field of the disk particles using a 3D polar grid (see Sellwood & Valluri, 1997); full details of the -body code are given in the on-line manual available at http://www.physics.rutgers.edu/sellwood/manual.pdf. For model A, the grid had 128 spokes, 128 rings, and 375 planes with vertical spacing ; the in-plane grid was refined to twice these values in a number of cases. We determined the gravitational forces using sectoral harmonics only, with also excluded to avoid unbalanced forces from the rigid mass components due to possible asymmetries in the distribution of particles.
We use a cubic-spline softening rule, with a softening length of , although we doubled this value when we used a grid with greater vertical spacing and fewer planes. We employed particles in the initial disk, but the number increased five-fold by the end. We adopted a basic time step of , which we increased by five factors of two in zones of ever larger radii (Sellwood, 1985). These parameters were for model A; values for other runs are given in Table 1.
3. Results
In this section we discuss the results of a few specific simulations, whose parameters are summarized in Table 1. We explored numerous other models besides those in Table 1, many of which were minor variants of this basic set with differing rates of accretion or the width or profile of the annulus. The behavior turned out to be insensitive to almost all accretion parameters, with few noteworthy differences from those reported here.
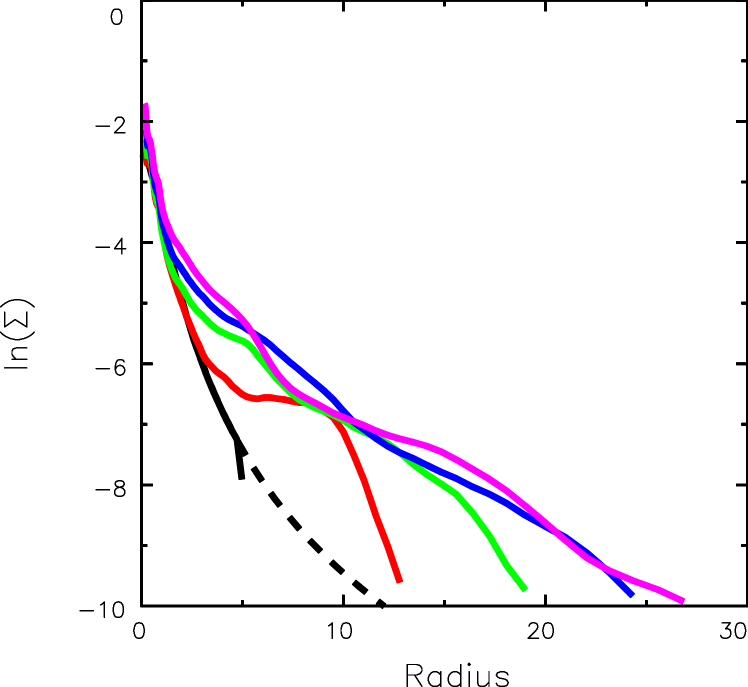
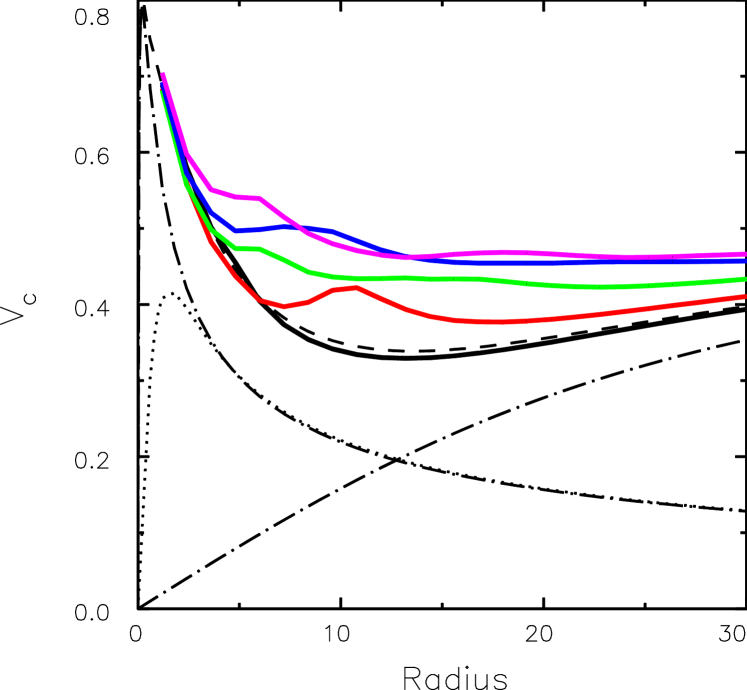
3.1. Model A
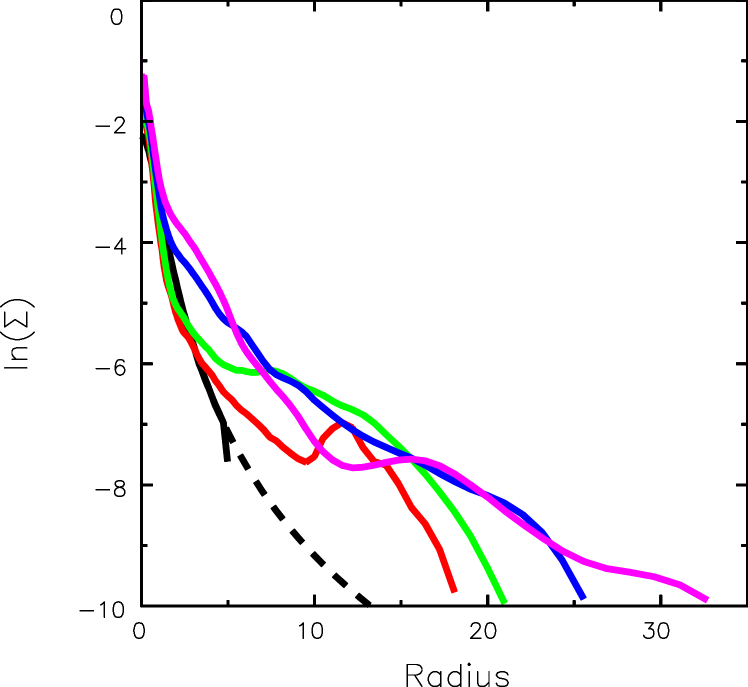
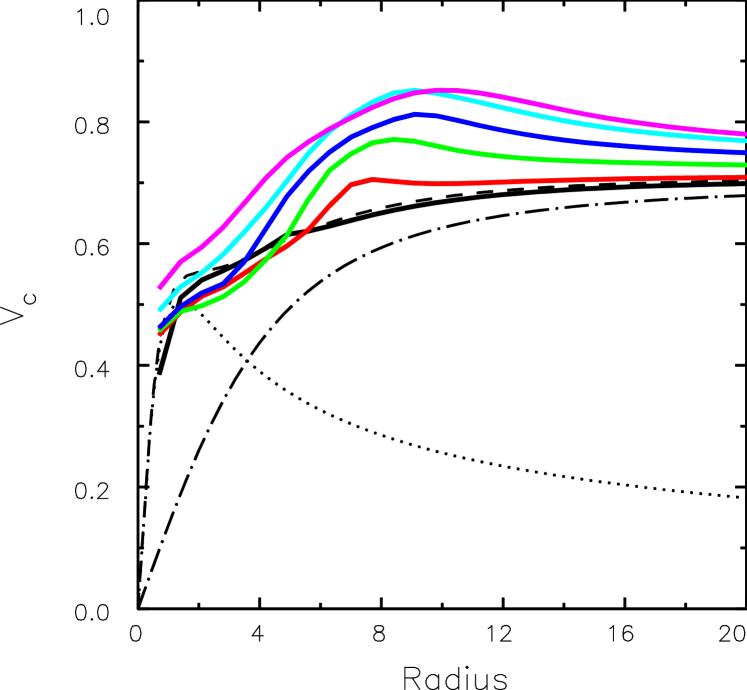
We first describe model A, for which the evolution of the surface density and rotation curve are illustrated in Figure 1. After the bar had formed and been erased, we began adding particles to the disk at a rate of particles per , or approximately % of the initial disk mass, continuously for a period of . We placed the particles over the radial range , which caused a local shoulder in the surface density at first, shown by the red line in the upper panel of Figure 1, that subsequently smoothed out as the disk mass rose, despite the fact that we continued to add mass over the same radial range. The disk spread significantly as its mass rose five-fold, to yield a quite smooth quasi-exponential surface density profile by the last time shown (magenta line).
The lower panel shows the evolution of the rotation curve, which began with a pronounced dip between the contributions of the dense bulge and the initial disk in the inner part and the cored halo farther out. While the dense bulge continued to maintain high circular speeds in the center, the broad initial dip is gradually erased. This is perhaps not too surprising, since we are increasing the disk surface density just interior to the middle of the dip, but the final rotation curve has hardly a feature at all as the substantial added mass has been spread radially. However, the bulge still dominated motion in the center of the model.

The evolution of the model was dominated by bi-symmetric spirals, while a small bar of semi-major axis appeared around , although it did not persist. A larger bar with semi-axis developed around , but the effect of the spirals on the initial disk had caused most of the evolution long before that bar became dominant.


3.2. Model B
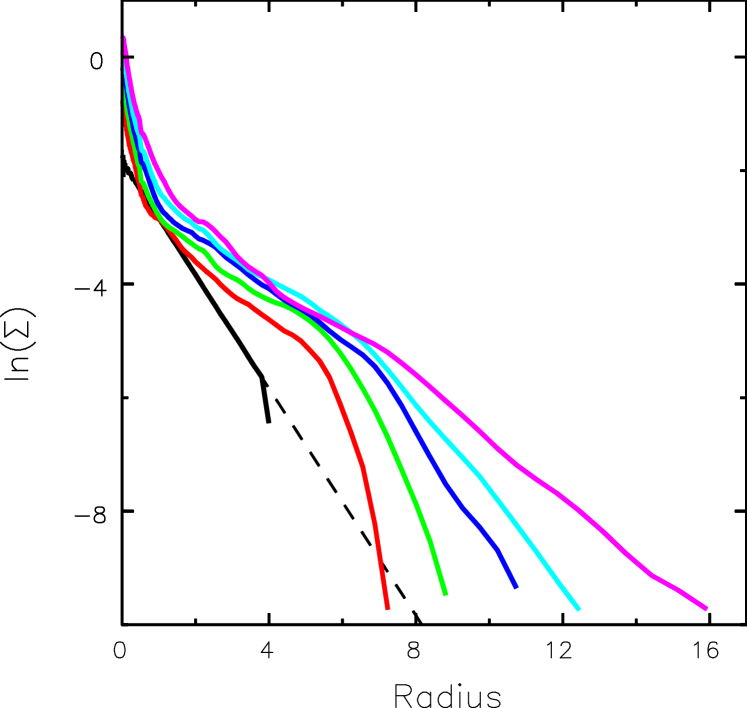
The evolution of the mass distribution in model B is illustrated in Figure 2. This model differs from model A in having a lower mass bulge, the added particles are placed farther out () at half the rate, and it was also run for a much longer time. The mass of the final disk had increased by more than ten-fold, and was represented by particles and the final rotation curve was smooth and nearly flat.
In this case, the initial evolution was dominated by more multi-arm spiral patterns, up to at first, but the multiplicity of arms dwindled to by about half-way through the simulation. Again, a substantial bar, with semi-major axis , formed by the end of this simulation, but spiral activity dominated for well over half of the duration.
Note that the annular range of mass addition was outside the initial disk, yet the final surface density profile has no gap, which requires there to have been substantial rearrangement of angular momentum among and between both the original and added particles. Figure 3 contours the density of particles as functions of and , where is the initial angular momentum at the start, or when the particle was added, and is the change in that value by the end of the simulation. The original particles are in the blob on the left, while the added particles have larger , and the densest concentrations lie close to the line of slope , suggesting that many particles have sunk far towards the center, but few have become retrograde. Obviously, losses of angular momentum must be balanced by gains, as there is no external torque, and some of the added particles have more than doubled their initial . The local maximum in the center of the panel forms much later in the simulation, around . This is the same time frame over which the bar seems to grow significantly.
3.3. Model C
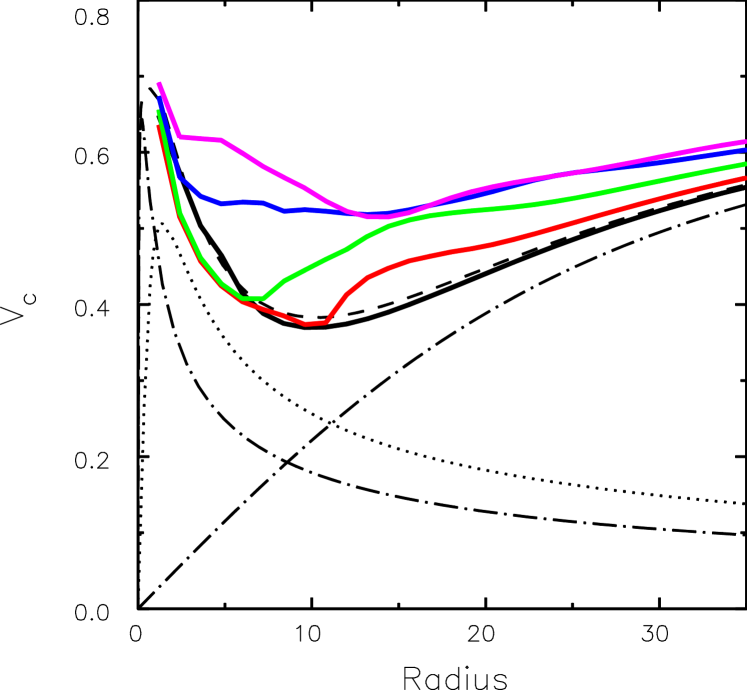
Figure 4 illustrates the initial and final surface density, upper panel, and circular velocity, lower panel, for model C. In this case the disk mass increased 100-fold as the mean radius of the accreted mass was increased. The rotation curve is still dominated by the dense bulge in the inner parts, but becomes essentially flat outside the bulge region. The final surface density shows a decrease around seven scale lengths, the same radius as the bar that forms.
3.4. Models D and E
The mean radius of added particles stayed constant in models A and B, while we increased it in three steps in model C in a crude effort to mimic inside-out disk growth. Here we experiment with outside-in growth, by shifting the mean radius of the accretion annulus inwards over time. The details of the accretion rates and annuli used are given in Table 1 and mean radius of the annulus is shifted inwards every .
Model D included, as in previous simulations, low-order non-axisymmetric terms () in the forces acting on the particles. The evolution is illustrated in the usual manner in Figure 5. Here we again found that the spirals redistributed matter, and the particles migrated radially, smoothing out the initial rotation curve. This model also developed a bar at later times that was rather larger that in other cases, perhaps due to the lower angular momentum material that was added later in the simulation. The final surface density profile, magenta line, has a feature at , which is the approximate semi-major axis of the bar.
The blue line shows that the density and rotation curve lacked this feature at a time before the final moment.
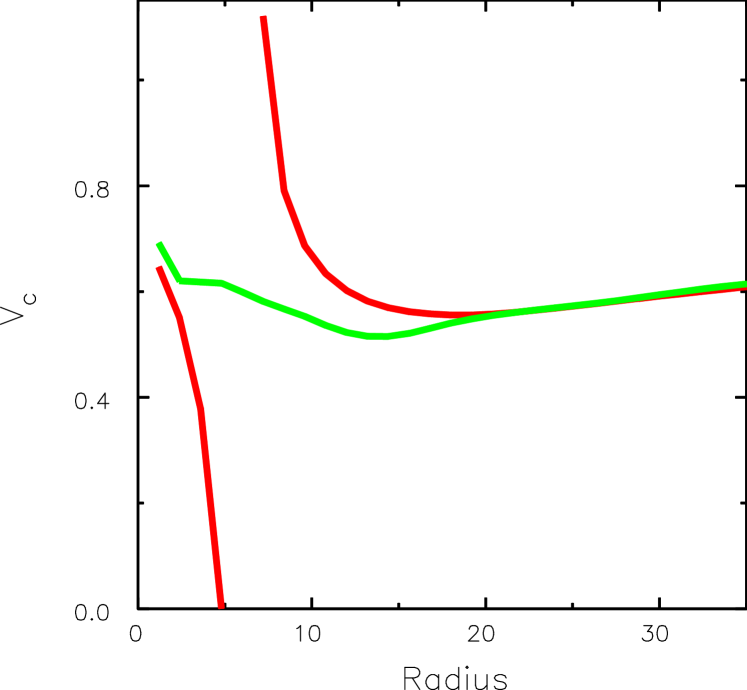
The initial disk and accretion rules in model E were identical to those in model D, except that the particles in model E experience radial forces only; all sectoral harmonic terms with were suppressed. Since smoothing is caused by angular momentum changes driven by collective non-axisymmetric disturbances, i.e. spirals, the annulus in model E cannot disperse because non-axisymmetric forces were suppressed. To emphasize the extent of mass rearrangement in model D, we compare the circular speeds in models E (red) and D (green) at in Figure 6. The circular speed in model E actually becomes imaginary, i.e. the radial attraction is outwards over a short radial range just interior to the massive annulus, for reasons explained in §1.2. Because of the unusual radial force law in model E, some particle orbits were unstable and they acquired large radial velocities, whereas accreted particles at other radii maintained near circular orbits.
3.5. A bulgeless disk
Thus far we have examined only cases with dense bulges that dominate the central attraction near the center. Model F has no bulge, but has a halo core radius of , smaller than in previous models. Details of the mass components and accretion rule used in this case are given in Table 1.
The results of adding material to the disk at large radius are illustrated in Figure 7. The feature in the rotation curve caused by the accreted matter is far from erased in this case, although matter has been redistributed somewhat.
Because of the dominant halo in the outer parts, the rotation curve rises to before beginning to decrease. In many of our simulations the dominant spiral modes are and , but in this case we see mostly in the outer parts where the halo dominates. Low-mass disks support more multi-arm patterns (§1.3) that are less effective at redistributing mass (see §6).
3.6. A submaximal disk
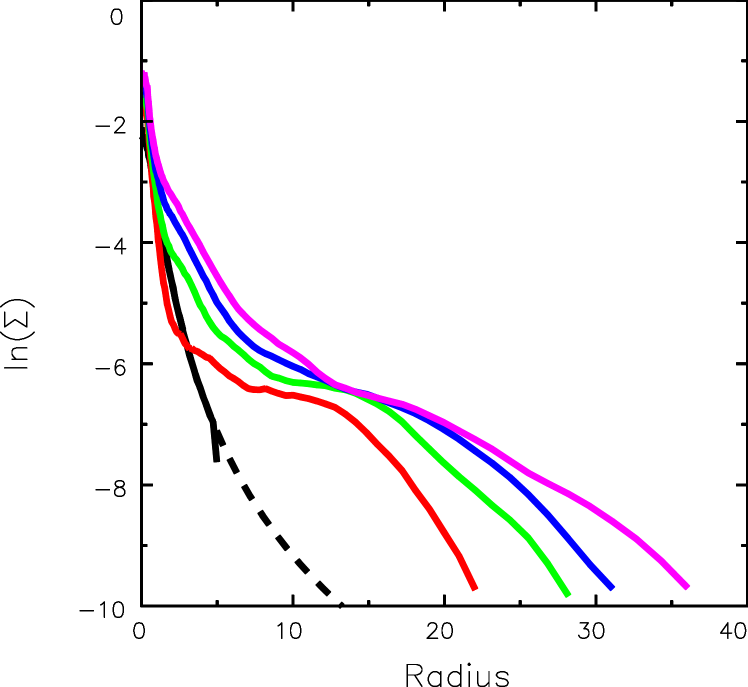
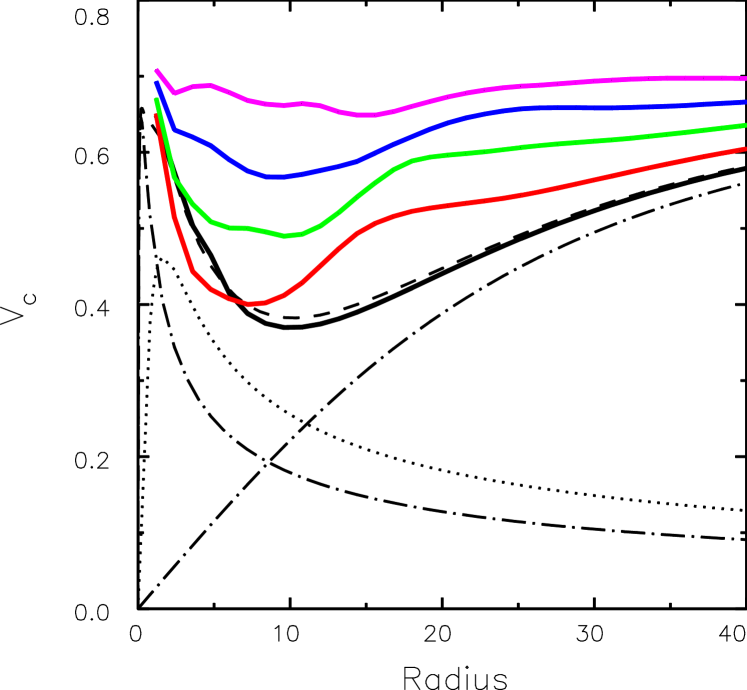
We turn now to examine a submaximal model, also with no bulge. Model G uses an exponential disk with a massive rigid Hernquist halo. Details of the mass components and accretion rule are provided in Table 1.
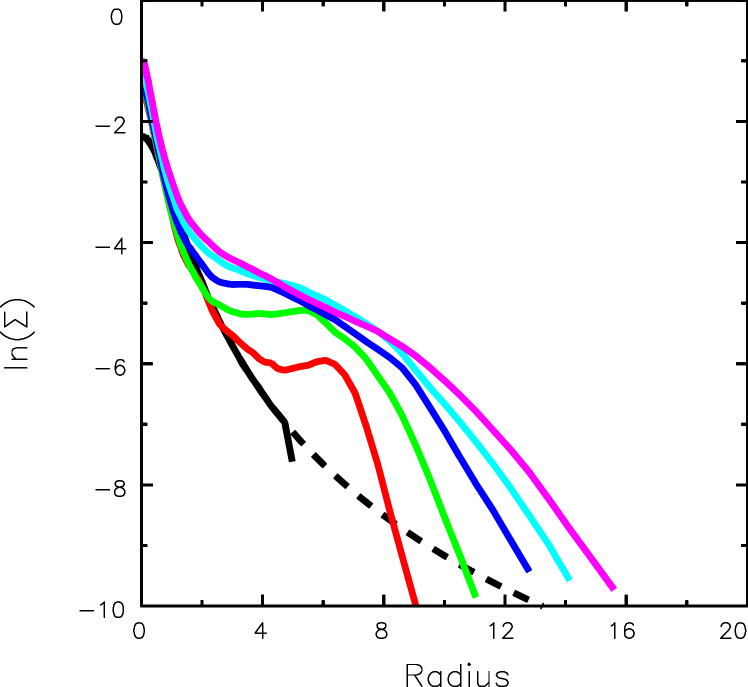
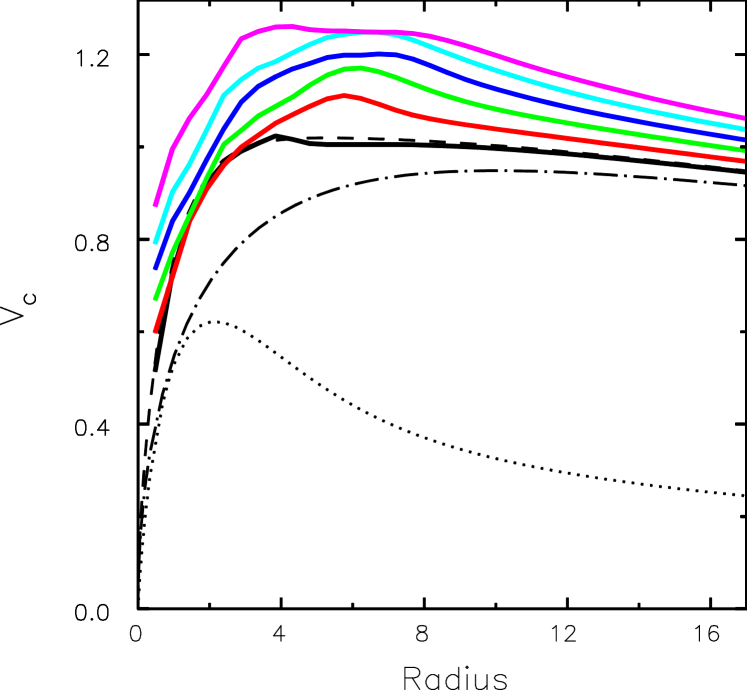
The results of adding material to this disk may be seen in Figure 8. The top panel of the figure illustrates the surface density profile at intervals. The initial exponential disk grows from its initial length of to as the disk mass increases five fold. The lower panel illustrates the rotation curve of the disk at the same time intervals as the upper panel. Here it can be seen that the rotation curve has an initial extra bump that is eventually flattened as the magnitude of the curve rises. The final (magenta) line rises in the innermost region, then flattens over the range , before decreasing.
4. Smoothing mechanism
While it is clear that spiral activity is the main agent responsible for smoothing out features in the surface density profile and rotation curve, we here try to achieve a deeper understanding of how this happens. To this end, we start with a smooth disk that is linearly stable, and study the instabilities that are provoked by an accreted annulus of additional matter.
4.1. Mestel disk
The Mestel disk is the only known linearly stable disk with differential rotation. This scale-free disk has the archetypal flat rotation curve, with constant circular speed, , at all radii and the surface density
| (6) |
where is the active disk mass fraction. Zang (1976) showed that the full-mass disk, , with an inner cut-out to break the scale free character, and , was stable to modes with and , but was unstable to lop-sided modes with . Toomre (1981) showed that the lop-sided mode could be suppressed by reducing the active disk mass to one-half () while invoking a rigid halo to maintain the same central attraction. His linear stability analysis predicted that such a disk with would be stable to all small-amplitude non-axisymmetric modes. Simulations by Sellwood (2012) seemed generally consistent with this prediction, even though he found that non-linear changes, caused by amplified shot noise from a finite number of particles, could lead to the ultimate appearance of large amplitude non-axisymmetric disturbances. However, his simulations with moderately large did not develop strong spiral features for a period long enough for the disk to be considered stable our purposes.
4.2. Simulations
We therefore employ this model, with the inner cut-out and outer taper described in Sellwood (2012), but with in order to inhibit the late formation of bars through non-linear trapping by the large-amplitude spirals we wish to provoke. The central cut-out is a moderately gentle taper in centered on a value , whose (small) radius defines our length scale. The outer taper is centered on , so that the disk has the surface density close to that given by eq. (6), with , over the range .
In model M, we study the immediate response to the accretion of new material and the effects of spiral activity on the matter distribution over a short time scale. The initial Mestel disk had particles with and we added particles at a rate of per time step to the initial disk in an annulus of uniform density at for just the first time steps, thereby increasing the total particle number by 20% over a period of rotations of the disk at the mean radius.


The evolution of the surface density and circular speed in the simulation are illustrated in Figure 9. The dashed line in the upper panel represents the initial profile of the untapered disk, and the red curve shows the ridged density profile just after the new particles have been added. Subsequent evolution causes the surface density profile to return to its original smoother state after a just a few disk rotations at the mean radius of the added matter.
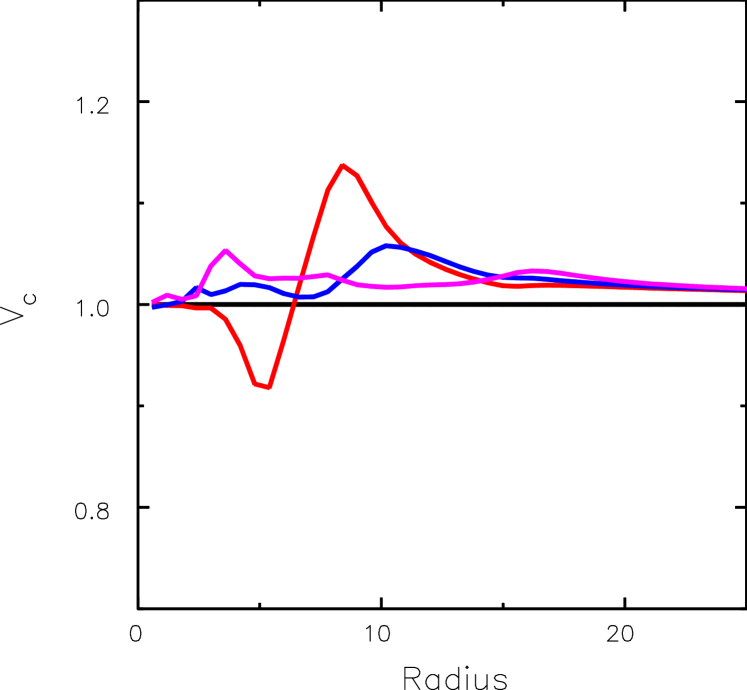
The radial variation of the circular speed is shown by the colored lines in the lower panel at the same moments as shown in the upper panel. The addition of a substantial ring of extra mass centered on gives rise to the inflexion, shown in red, in the originally flat rotation curve (black). The inflexion in the total circular speed is caused by the central attraction of an annular disk of matter, which is radially outward near the inner edge of the feature, and strongly inward near the outer edge, as noted in §1.2.
Although the disk without the annulus of accreted matter is stable, the extra mass quickly provokes strong spiral patterns that cause mass to be redistributed radially. After just a few disk rotations, the pronounced features in both the rotation curve and the surface density profile are quickly smoothed, as shown by the blue and magenta lines.
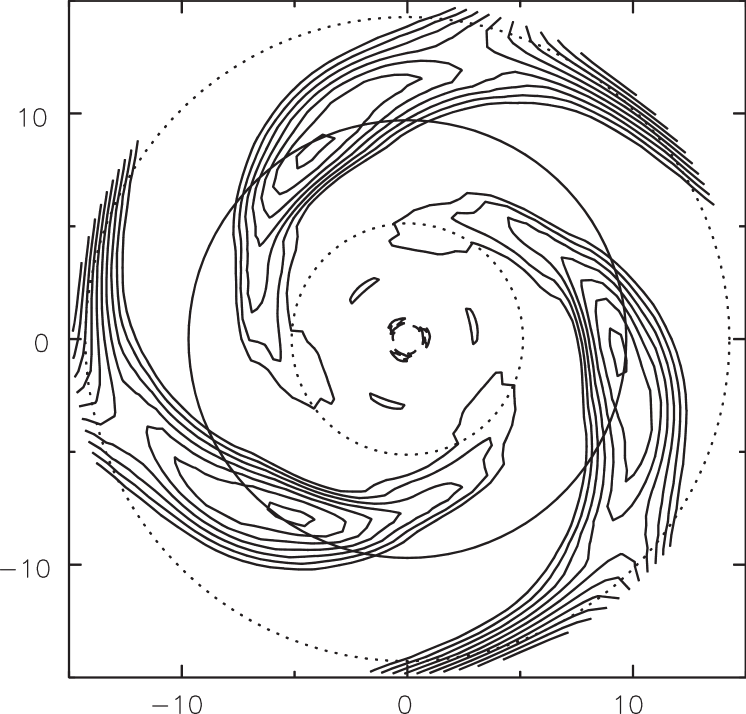
To underscore that smoothing is caused by spiral activity, we have rerun the simulation as model N with the same initial disk and accretion rule, but with all non-axisymmetric sectoral harmonics () suppressed. Figure 10 compares the evolution of model M, on the left, where strong 3-arm spirals appear, with model N on the right, where spiral instabilities were artificially suppressed and the added ring of particles was not dispersed.
4.3. Spiral modes
Sellwood & Kahn (1991) studied instabilities provoked by both grooves and ridges in the density distribution of similar models, and also presented a local analysis of the normal modes of such features. They found that an axisymmetric ridge possesses two linear modes for each sectoral harmonic, but only those that could elicit a vigorous supporting response from the surrounding disk would be unstable. In their local analysis, the two modes were expected to grow equally rapidly, and to have corotation radii at some distance from the ridge and symmetrically placed on either side of it. Naturally, the symmetry between the inner and outer modes, which is a consequence of the neglect of curvature in their local analysis, is broken in a global calculation.
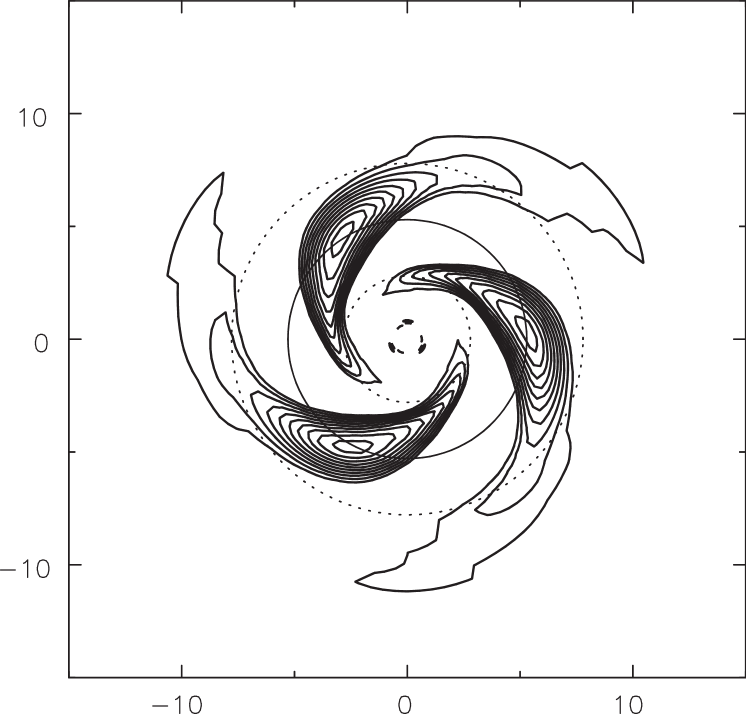
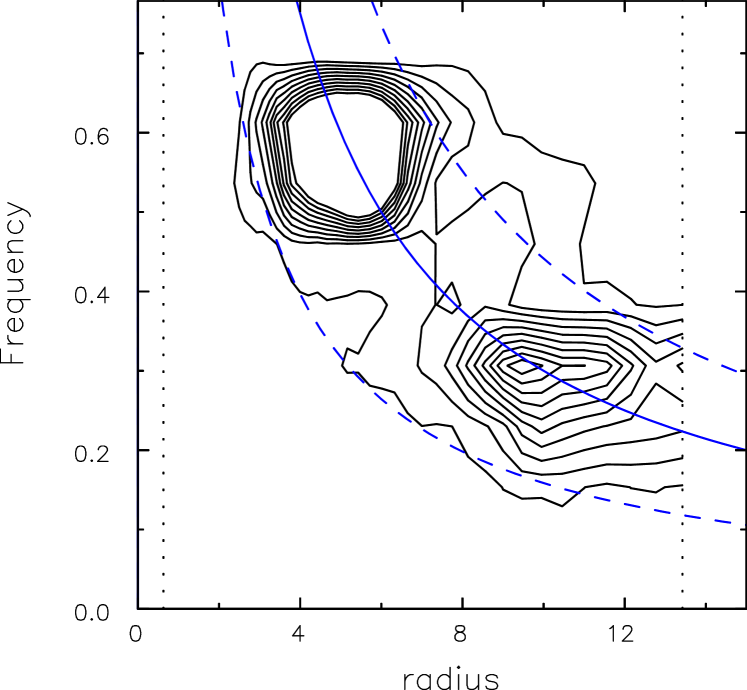
The dominant unstable modes excited by the ridge should be those that gain the strongest supporting response from the nearby disk. The disk supporting response is determined by swing-amplification, the theory of which (Toomre, 1981; Binney & Tremaine, 2008) predicts that the strongest response in a Mestel disk will be for . Thus we expect, and indeed find, two rapidly growing modes at . Figure 11 illustrates the power spectrum of disturbances over the period , while the modes were mostly growing. The contours of power are broadened in frequency by the rapid growth of the modes, but the Figure clearly shows two distinct disturbances with frequencies and , and corotation radii near and , nicely straddling the mean radius of the added matter. The outer mode is clearly weaker than the inner, largely because the dynamical time scale is almost twice as long at the greater radius, and therefore the growth rate of the mode must be lower also. We have been able to fit the instabilities using the apparatus described in Sellwood & Athanassoula (1986), finding pattern speeds and 0.32, although with highly uncertain growth rates. The overdense parts of both modes are contoured in Figure 12.
As these two instabilities reach large amplitude, each opens up a region around its own corotation radius where non-linear horseshoe orbits appear (Sellwood & Binney, 2002; Binney & Tremaine, 2008). This behavior arises because particles orbiting at circular frequencies close to that of the disturbance experience large changes in their angular momenta that cause the home radii of their orbits to change with no increase in random motion. The sign of the change is to cause them to cross corotation, i.e. to reverse direction in the frame corotating with the disturbance, hence the description “horseshoe” orbit.
Under normal circumstances, where the disk surface density declines slowly outwards, the number of gainers of angular momentum is approximately equal to the number of losers; particles simply exchange places leaving the disk density profile pretty much as it was (Sellwood & Binney, 2002; Solway et al., 2012). Here, however, corotation of each of the modes is not far from the edge of the annulus, and the horseshoe region extends into the higher surface density part of the disk, causing a large excess of particles scattered out of that region over those that are deflected into it – in other words, the non-linear evolution of both unstable modes rearranges matter in the sense of flattening out the local density excess. This is precisely the behavior we observe, and is the fundamental reason that ridges and other features in the surface density are smoothed by spiral activity.

4.4. Angular momentum changes
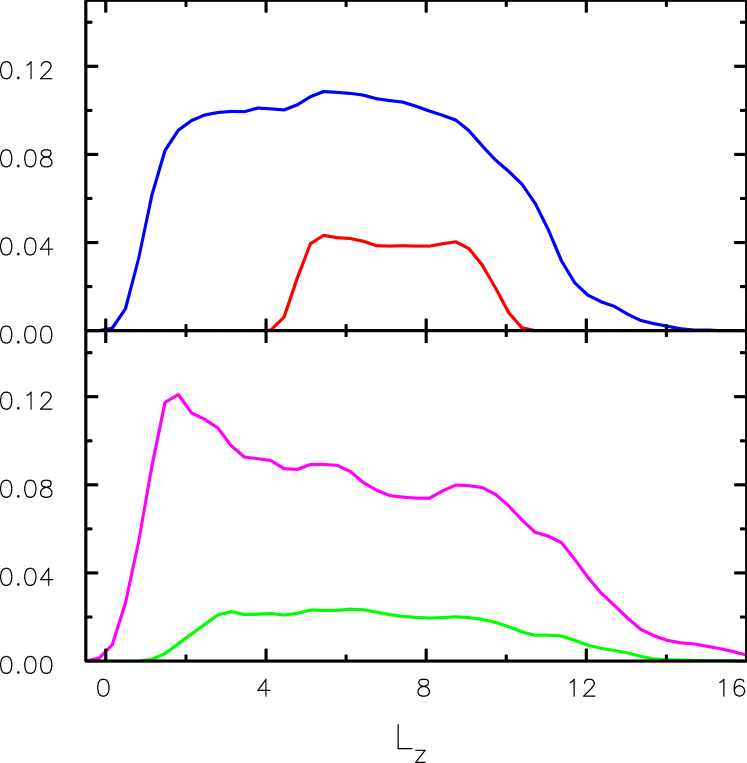
The distributions of angular momenta of the original disk particles and of the added particles are shown separately in Figure 13; the initial values in the upper panel and those at the end of the simulation () in the lower. The initial distribution of the added particles, which were placed on circular orbits, reflects the radial extent of the annulus where they were placed. The distribution of values of the added added particles at the later time (lower panel) has spread quite remarkably, while that of the initial disk particles was changed to a lesser extent.
Figure 14 shows density contours in the plane. The ridges with negative slope reflect the large changes brought about by horseshoe orbits at corotation, where the gainers were inside corotation and the losers outside. The two vertical lines mark the angular momenta at corotation for the modes we identified; most of the changes can be attributed to these two modes, but some further minor changes occurred at smaller that were probably caused by secondary instabilities.
4.5. Potential vorticity
Although their paper has received little attention in the realm of disk galaxy dynamics, Lovelace & Hohlfeld (1978, hereafter LH78) predicted instabilities associated with radially localized density enhancements. Their analysis focused on the radial gradient of the quantity known as the potential vorticity, or sometimes “vortensity,”
| (7) |
where is the -component of vorticity. (For a laminar, axisymmetric flow on circular orbits, .) Their local fluid analysis revealed that instabilities should arise wherever there were steep radial variations in , and they focused on models without a large-scale gradient but having both ridges and grooves in this quantity (as did Sellwood & Kahn, 1991, for stellar dynamical models). LH78 noted that in a massive disk having a flat rotation curve, i.e. the Mestel disk, all three quantities , , and vary inversely with , and therefore has no radial gradient and the disk should be locally stable by their criterion.
A ridge, or a groove, should be destabilizing, and LH78 argued ‘an important nonlinear effect of the fluctuations (from the resulting instabilities) may be the radial transport of mass, angular momentum, and energy. … A possible mechanism of saturation of the linear instability is that the “induced” radial transport acts to smooth out the maxima and minima in with the result that constant for at least a range of .’ The behavior in our Mestel disk simulation conforms closely to that anticipated in these far-sighted remarks.
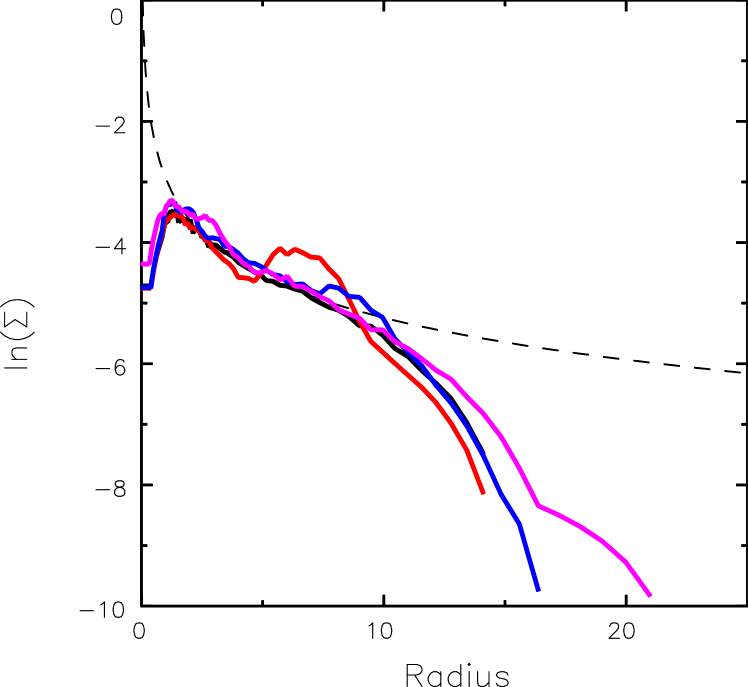
Figure 15 shows the radial variation of in model M at the same times as the other quantities in Figure 9. The initial value (black) is flat over , where the surface density of our modified Mestel disk is little affected by the inner and outer tapers. The accreted annulus introduced a pronounced spike at first (red), which was later smoothed (blue). A new spike appeared at smaller radius later (magenta) perhaps because the angular momentum changes associated with flattening the annulus had to be deposited somewhere.
We have examined the radial variation of in our other models, which always manifested declining profiles. Bumps in the broadly declining profiles, created by our accretion rules, were generally removed, however. These models differed from the Mestel disk in many ways, especially because the central attractions from neither the inner bulge nor the outer halo were self-similar, whereas that was true for the Mestel disk. A tendency to flatten was marginally more convincing in Run F, which lacked a central bulge, than in runs A through D.

5. Radial migration
We have just shown that changes to the home radii of particles, i.e. radial migration, smoothed the rotation curve and mass profile of the Mestel disk. We here show that this behavior also played the major role in smoothing the mass distributions in our other models. A painstaking demonstration of how spiral disturbances drove the orbital evolution of even a fraction of the particles in our simulations (e.g. Roškar et al., 2012) would be best presented in a separate paper. So here we simply demonstrate that particles do not gain much random energy as their angular momenta are changed, which is a characteristic feature of radial migration driven by scattering at corotation.
We therefore examined the orbital properties of the particles that were added in a narrow annulus to model D over the time interval . As a measure of random motion, we computed the eccentricity of the particle orbits in the frozen, axisymmetric potential of the model at . Here and are the peri- and apo-centric radii of each particle in the disk mid-plane. In fact, the simulation supported strong spiral patterns at all times, including this moment, so our procedure of computing the eccentricity in an axially symmetrized potential causes to be overestimated, because it treats the non-axisymmetric spiral streaming motions as random motion.
Figure 16 shows the density of all the recently added particles as functions of their angular momentum change since they were added to the simulation, , and eccentricity at . The added particles had initial , while in Figure 16 ranges up to 2, in our units. A small fraction of angular momentum losers lie in a tail reaching to , which are likely to have been scattered at an ILR, as observed by Sellwood & Carlberg (2014). Most of the particles for which , or a 25% change, have remained on nearly circular orbits, with . This is strong evidence for radial migration driven by surfing near the corotation resonances of spiral waves.
The total angular momentum changes over a longer period in a different run, presented in Fig. 3, imply that some particles have lost almost all their angular momenta, while others have gained more than twice their original. Since a strong spiral can cause , these much greater changes must have resulted from multiple spiral events.
Angular momentum changes are caused by the gravitational torque, which varies directly with the spiral potential amplitude (Binney & Tremaine, 2008, Appendix J). The torque is greatest for strong, open patterns with 2- and 3-fold rotational symmetry. It is weaker for multi-arm patterns for two reasons. (1) For a given density amplitude, the potential variations of waves that vary on smaller spatial scales, i.e. as rises, are weaker, and (2) the amplitudes of the spirals that develop in our models F and G were also lower. To quantify the second point, we define , from a Fourier decomposition of the surface density at any radius, and find in run A is about seven times greater than in run G, where the angle brackets denote averages over a broad swath of radii and time. Thus spiral torques are substantially weaker for our multi-arm patterns. Spirals are also weaker in disks having a higher , which is a direct measure of the competition between the growth of features due to gravitationally-driven collective effects and their dispersal due to random motion.
Thus the spirals that smooth the density profile most effectively have 2- or 3-arms. Such patterns are preferred in cool, responsive disks with high surface density for reasons given in §1.3. Clearly, therefore, features in the disk density and rotation curve are smoothed out more readily when the disk is heavy, and spirals have much less of a smoothing effect in submaximal disks, as we have found.
6. Discussion
Our experiments have shown that angular momentum changes caused by spiral instabilities in near-maximal disks smooth out both irregularities in the mass distribution within the disk and the rotation curve. Our experiments were artificial in many respects, but we believe that the mechanism they have revealed is robust.
As we described in §1.1, the disks of real galaxies are thought to have grown through the addition of gas that settles onto circular orbits in the disk mid-plane as it cools and forms stars. The radius at which gas settles is determined by both its angular momentum and the central attraction of the dominant mass components. The purpose of our study was to determine how sensitive is the final disk mass profile and rotation curve to the distribution of angular momentum in the accreted matter. We therefore needed to be able to vary this at will. Were we to have included gas in our models, we would have had to vary its angular momentum distribution and cooling rate in a similarly unrealistic manner to have achieved our science goal. We therefore opted for the simplest imaginable accretion formula to enable us to explore the widest possible range of rules in the most efficient and direct manner.
We employed rigid halos and bulges for similar reasons. In reality, responsive spheroidal components must compress as the disk grows and the central attraction strengthens. Also, some angular momentum exchange between these components and the disk may well occur. By keeping them rigid and unresponsive, we have been able to isolate the smoothing effect of the spiral activity in the disk, which would have been less clear if bulge and halo interactions were also taking place.
Halo compression has been invoked (Burstein & Rubin, 1985) as a possible reason for the absence of a feature in the rotation curve at the radius where the central attraction changes from disk domination to halo domination, which is the observed disk halo conspiracy (Bahcall & Casertano, 1985). Here we have shown that spiral activity rearranges the disk matter to erase any feature, without help from halo compression.
The accreted matter in all our simulations was placed in axisymmetric rings, as opposed to non-axisymmetric distributions that may be expected in a hierarchical cosmological context. However, accretion of a blob, or of a stream of cold gas over a narrow range in azimuth, will only excite spiral responses more easily, again leading to rapid spreading, as we confirmed in additional simulations not presented here.
We added mass at a steady rate in many, but not all, of our simulations, whereas hierarchical galaxy formation would suggest that a quiescent accretion history may be unusual. However, the behavior in the Mestel disk case, §4, showed that the smoothing mechanism persists when matter is added for a short period only.
Since bar formation has long been known to cause a substantial redistribution of angular momentum within a disk (Hohl, 1971; Sellwood, 1981; Debattista et al., 2004; Berentzen et al., 2006), we have tried to prevent it from happening in our experiments, in order to isolate the effects of spirals. However, bars have formed at a late stage in a number of our simulations, but usually late enough that spiral activity dominated most of the evolution.
The majority of our models are of heavy disks whose rotation curves become largely flat or even declining (e.g. models A through D). The final rotation curves in these cases are generally flat and about as smooth as those of many galaxies. Good examples for comparison with these models are M31 (Corbelli et al., 2010), which has a broad hump over the range kpc where the disk makes its peak contribution to rotation curve, and NGC 5055 (de Blok et al., 2008) which has the feature noted by Sancisi (2004) associated with the bulge, and is not perfectly flat at larger radii.
The more dominant halo models F and G still manifested some spreading of the accreted matter (see Figs. 7 & 8), but it was insufficient to flatten the rotation curves, which rose in the inner parts right through to the end of our simulations. Because the disk was less dominant in both these cases over the region where mass was added, the spiral patterns that developed in these two models had higher multiplicities () than in models A-D, where two-armed patterns were the strongest.
While none of our models has resulted in a perfect exponential disk, the surface density profiles at the final times, shown by the magenta curves in Figures 1, 2, and 4 are much more nearly exponential than that of the original disk plus accreted matter. The smoothing mechanism we identify here is clearly of importance to the origin of the classical exponential disk profile (Freeman, 1970).
7. Conclusions
All our experiments with massive disks have shown that mass added to a disk, or even exterior to it, having a narrow range of angular momentum is quickly spread in radius by spiral patterns. While the overall size the disk must be determined by its total angular momentum content, our results argue that the smoothness of the density profile is remarkably insensitive to the distribution of angular momentum among the accreted baryons. Our accretion rules were deliberately chosen to demonstrate the ability of spiral activity to lead to physically reasonable disks from even quite unrealistic distributions of accreted matter. Disks are believed to grow in an inside-out fashion, but we have shown that even outside-in growth leads to the same behavior, and a similar outcome.
The accreted material at first settles to the radius at which its angular momentum is in centrifugal balance. We find that the observed generally smooth rotation curves and decreasing surface density profiles of disk galaxies are created by internally driven secular processes, especially in disks that support strong spiral patterns with low-order rotational symmetry. Thus the final density profile is insensitive to the detailed angular momentum distribution of the infalling baryons, or to their distribution of arrival times, as they settle into the halo potential well.
Angular momentum changes driven by spiral patterns are responsible for smoothing out irregularities in the radial mass profile. Our detailed study of the instabilities of a single annulus added to an otherwise stable disk (§4), showed that the non-linear evolution of the unstable modes excited by the density ridge disperses the density excess through horseshoe orbits. The excess of those scattered out of the density ridge over those scattered into it by these orbits spread out the ridge in less than , which is disk rotation periods at the mean radius of the annulus. Since horseshoe orbits cross corotation for the spiral mode, the stars do not gain significant random motion (none to first order, Sellwood & Binney, 2002), and therefore the only heating associated with the smoothing process is caused by the much more minor angular momentum changes at the Lindblad resonances (Sellwood, 2014).
We believe that the mechanism of mode excitation that we identified in the Mestel disk holds more generally in our other experiments, as was predicted by the local analysis by Lovelace & Hohlfeld (1978) and by Sellwood & Kahn (1991). These modes erase the features that excited them through angular momentum changes around their corotation radii, which change the home radii of particles without increasing random motion (see Fig. 16). The radial extent of the horseshoe region is limited to % of the radius of corotation for strong spiral patterns with few arms. Thus multiple spiral episodes with a variety of corotation radii are required to spread the accreted material over the full radial extent of the disk. The smoothing effect is weaker in disks that support weaker spirals and/or patterns of higher higher multiplicity. The dominant patterns in large spiral galaxies do have 2- or 3-fold rotation symmetry (e.g. Davis et al., 2014), but more multi-arm patterns are seen is some dwarf galaxies, e.g. NGC 3928 (van den Bergh, 1980; Carollo et al., 1997).
Continuous accretion, which we applied in the majority of cases, causes a succession of spiral instabilities associated with the density excess, and probably also secondary instabilities caused by other features in the density profile where particles have accumulated after having been moved from the original ridge. However, none of our models has a perfectly smooth mass profile or rotation curve, and the mild features in the one are reflected in similar mild features in the other, just as for “Renzo’s rule” (Sancisi, 2004). This mechanism also provides at least a partial explanation of the long standing disk-halo “conspiracy.”
References
- Athanassoula et al. (1987) Athanassoula, E., Bosma, A., & Papaioannou, S. 1987, A&A, 179, 23
- Aumer & White (2013) Aumer, M. & White, S. D. M. 2013, MNRAS, 428, 1055
- Bahcall & Casertano (1985) Bahcall, J. N. & Casertano, S. 1985, ApJ, 293, L7
- Berentzen et al. (2006) Berentzen, I., Shlosman, I., & Jogee, S. 2006, ApJ, 637, 582
- Bershady et al. (2011) Bershady, M. A., Martinsson, T. P. K., Verheijen, M. A. W., Westfall, K. B., Andersen, D. R., & Swaters, R. A. 2011, ApJ, 739, L47
- Bertone & Conselice (2009) Bertone, S. & Conselice, C. J. 2009, MNRAS, 396, 2345
- Binney & Tremaine (2008) Binney, J. & Tremaine, S. 2008, Galactic Dynamics: Second Edition (Princeton University Press)
- Bird et al. (2013) Bird, J. C., Kazantzidis, S., Weinberg, D. H., Guedes, J., Callegari, S., Mayer, L., & Madau, P. 2013, ApJ, 773, 43
- Blumenthal et al. (1986) Blumenthal, G. R., Faber, S. M., Flores, R., & Primack, J. R. 1986, ApJ, 301, 27
- Broeils (1992) Broeils, A. H. 1992, A&A, 256, 19
- Brook et al. (2011) Brook, C. B., Governato, F., Roškar, R., et al. 2011, MNRAS, 415, 1051
- Burstein & Rubin (1985) Burstein, D. & Rubin, V. C. 1985, ApJ, 297, 423
- Carignan & Freeman (1985) Carignan, C. & Freeman, K. C. 1985, ApJ, 294, 494
- Carlberg et al. (1994) Carlberg, R. G., Pritchet, C. J., & Infante, L. 1994, ApJ, 435, 540
- Carollo et al. (1997) Carollo, C. M., Stiavelli, M., de Zeeuw, P. T., & Mack, J. 1997, AJ, 114, 2366
- Casertano (1983) Casertano, S. 1983, MNRAS, 203, 735
- Conselice et al. (2003) Conselice, C. J., Bershady, M. A., Dickinson, M., & Papovich, C. 2003, AJ, 126, 1183
- Conselice et al. (2011) Conselice, C. J., Bluck, A. F. L., Ravindranath, S., Mortlock, A., Koekemoer, A. M., Buitrago, F., Grützbauch, R., & Penny, S. J. 2011, MNRAS, 417, 2770
- Corbelli et al. (2010) Corbelli, E., Lorenzoni, S., Walterbos, R., Braun, R., & Thilker, D. 2010, A&A, 511, A89
- Davis et al. (2014) Davis, B. L., Berrier, J. C., Johns, L., et al. 2014, ApJ, 789, 124
- de Blok & McGaugh (1997) de Blok, W. J. G. & McGaugh, S. S. 1997, MNRAS, 290, 533
- de Blok et al. (2008) de Blok, W. J. G., Walter, F., Brinks, E., Trachternach, C., Oh, S.-H., & Kennicutt, Jr., R. C. 2008, AJ, 136, 2648
- Debattista et al. (2004) Debattista, V. P., Carollo, C. M., Mayer, L., & Moore, B. 2004, ApJ, 604, L93
- Debattista et al. (2006) Debattista, V. P., Mayer, L., Carollo, C. M., Moore, B., Wadsley, J., & Quinn, T. 2006, ApJ, 645, 209
- Debattista & Sellwood (2000) Debattista, V. P. & Sellwood, J. A. 2000, ApJ, 543, 704
- Dekel & Birnboim (2006) Dekel, A. & Birnboim, Y. 2006, MNRAS, 368, 2
- Dutton (2009) Dutton, A. A. 2009, MNRAS, 396, 121
- Elmegreen & Struck (2013) Elmegreen, B. G. & Struck, C. 2013, ApJ, 775, L35
- Erwin et al. (2008) Erwin, P., Pohlen, M., & Beckman, J. E. 2008, AJ, 135, 20
- Fall & Efstathiou (1980) Fall, S. M. & Efstathiou, G. 1980, MNRAS, 193, 189
- Ferguson & Clarke (2001) Ferguson, A. M. N. & Clarke, C. J. 2001, MNRAS, 325, 781
- Freeman (1970) Freeman, K. C. 1970, ApJ, 160, 811
- Gentile et al. (2010) Gentile, G., Baes, M., Famaey, B., & van Acoleyen, K. 2010, MNRAS, 406, 2493
- Gnedin et al. (2004) Gnedin, O. Y., Kravtsov, A. V., Klypin, A. A., & Nagai, D. 2004, ApJ, 616, 16
- Goldreich & Lynden-Bell (1965) Goldreich, P. & Lynden-Bell, D. 1965, MNRAS, 130, 125
- Gunn (1982) Gunn, J. E. 1982, in Astrophysical Cosmology Proceedings, ed. H. A. Brueck, G. V. Coyne, & M. S. Longair (Vatican City: Pontificia Academia Scientiarum), 233
- Hernquist (1990) Hernquist, L. 1990, ApJ, 356, 359
- Hohl (1971) Hohl, F. 1971, ApJ, 168, 343
- Jogee et al. (2008) Jogee, S., Miller, S., Penner, K., et al. 2008, in Astronomical Society of the Pacific Conference Series, Vol. 396, Formation and Evolution of Galaxy Disks, ed. J. G. Funes & E. M. Corsini, 337
- Julian & Toomre (1966) Julian, W. H. & Toomre, A. 1966, ApJ, 146, 810
- Kalnajs (1983) Kalnajs, A. J. 1983, in IAU Symposium, Vol. 100, Internal Kinematics and Dynamics of Galaxies, ed. E. Athanassoula, 109–115
- Katz & Gunn (1991) Katz, N. & Gunn, J. E. 1991, ApJ, 377, 365
- Kauffmann (2014) Kauffmann, G. 2014, MNRAS, 441, 2717
- Kazantzidis et al. (2004) Kazantzidis, S., Kravtsov, A. V., Zentner, A. R., Allgood, B., Nagai, D., & Moore, B. 2004, ApJ, 611, L73
- Kent (1986) Kent, S. M. 1986, AJ, 91, 1301
- Kereš et al. (2005) Kereš, D., Katz, N., Weinberg, D. H., & Davé, R. 2005, MNRAS, 363, 2
- Lin & Pringle (1987) Lin, D. N. C. & Pringle, J. E. 1987, ApJ, 320, L87
- Lotz et al. (2008) Lotz, J. M., Davis, M., Faber, S. M., et al. 2008, ApJ, 672, 177
- Lotz et al. (2011) Lotz, J. M., Jonsson, P., Cox, T. J., Croton, D., Primack, J. R., Somerville, R. S., & Stewart, K. 2011, ApJ, 742, 103
- Lotz et al. (2006) Lotz, J. M., Madau, P., Giavalisco, M., Primack, J., & Ferguson, H. C. 2006, ApJ, 636, 592
- Lovelace & Hohlfeld (1978) Lovelace, R. V. E. & Hohlfeld, R. G. 1978, ApJ, 221, 51
- Martín-Navarro et al. (2014) Martín-Navarro, I., Trujillo, I., Knapen, J. H., Bakos, J., & Fliri, J. 2014, MNRAS, 441, 2809
- Matteucci & Francois (1989) Matteucci, F. & Francois, P. 1989, MNRAS, 239, 885
- McGaugh et al. (2000) McGaugh, S. S., Schombert, J. M., Bothun, G. D., & de Blok, W. J. G. 2000, ApJ, 533, L99
- Minchev et al. (2012) Minchev, I., Famaey, B., Quillen, A. C., et al. 2012, A&A, 548, A126
- Navarro et al. (1996) Navarro, J. F., Frenk, C. S., & White, S. D. M. 1996, ApJ, 462, 563
- Newman et al. (2013) Newman, S. F., Genzel, R., Förster Schreiber, N. M., et al. 2013, ApJ, 767, 104
- Oppenheimer & Davé (2008) Oppenheimer, B. D. & Davé, R. 2008, MNRAS, 387, 577
- Oppenheimer et al. (2010) Oppenheimer, B. D., Davé, R., Kereš, D., Fardal, M., Katz, N., Kollmeier, J. A., & Weinberg, D. H. 2010, MNRAS, 406, 2325
- Palunas & Williams (2000) Palunas, P. & Williams, T. B. 2000, AJ, 120, 2884
- Patton et al. (2002) Patton, D. R., Pritchet, C. J., Carlberg, R. G., et al. 2002, ApJ, 565, 208
- Patton et al. (1997) Patton, D. R., Pritchet, C. J., Yee, H. K. C., Ellingson, E., & Carlberg, R. G. 1997, ApJ, 475, 29
- Persic et al. (1996) Persic, M., Salucci, P., & Stel, F. 1996, MNRAS, 281, 27
- Roškar et al. (2012) Roškar, R., Debattista, V. P., Quinn, T. R., & Wadsley, J. 2012, MNRAS, 426, 2089
- Sackett (1997) Sackett, P. D. 1997, ApJ, 483, 103
- Salucci et al. (2007) Salucci, P., Lapi, A., Tonini, C., Gentile, G., Yegorova, I., & Klein, U. 2007, MNRAS, 378, 41
- Sancisi (2004) Sancisi, R. 2004, in IAU Symposium, Vol. 220, Dark Matter in Galaxies, ed. S. Ryder, D. Pisano, M. Walker, & K. Freeman, 233
- Schneider et al. (2012) Schneider, M. D., Frenk, C. S., & Cole, S. 2012, JCAP, 5, 30
- Sellwood (1981) Sellwood, J. A. 1981, A&A, 99, 362
- Sellwood (1985) —. 1985, MNRAS, 217, 127
- Sellwood (2012) —. 2012, ApJ, 751, 44
- Sellwood (2013) —. 2013, in Planets Stars and Stellar Systems v5, ed. T. D. Oswalt & G. Gilmore, 923
- Sellwood (2014) —. 2014, Reviews of Modern Physics, 86, 1
- Sellwood & Athanassoula (1986) Sellwood, J. A. & Athanassoula, E. 1986, MNRAS, 221, 195
- Sellwood & Binney (2002) Sellwood, J. A. & Binney, J. J. 2002, MNRAS, 336, 785
- Sellwood & Carlberg (1984) Sellwood, J. A. & Carlberg, R. G. 1984, ApJ, 282, 61
- Sellwood & Carlberg (2014) —. 2014, ApJ, 785, 137
- Sellwood & Debattista (2014) Sellwood, J. A. & Debattista, V. P. 2014, ArXiv:1410.0834
- Sellwood & Kahn (1991) Sellwood, J. A. & Kahn, F. D. 1991, MNRAS, 250, 278
- Sellwood & McGaugh (2005) Sellwood, J. A. & McGaugh, S. S. 2005, ApJ, 634, 70
- Sellwood & Moore (1999) Sellwood, J. A. & Moore, E. M. 1999, ApJ, 510, 125
- Sellwood & Valluri (1997) Sellwood, J. A. & Valluri, M. 1997, MNRAS, 287, 124
- Sharma & Steinmetz (2005) Sharma, S. & Steinmetz, M. 2005, ApJ, 628, 21
- Sharma et al. (2012) Sharma, S., Steinmetz, M., & Bland-Hawthorn, J. 2012, ApJ, 750, 107
- Silk (2003) Silk, J. 2003, Ap&SS, 284, 663
- Sofue & Rubin (2001) Sofue, Y. & Rubin, V. 2001, ARA&A, 39, 137
- Solway et al. (2012) Solway, M., Sellwood, J. A., & Schönrich, R. 2012, MNRAS, 422, 1363
- Spekkens & Giovanelli (2006) Spekkens, K. & Giovanelli, R. 2006, AJ, 132, 1426
- Springel et al. (2006) Springel, V., Frenk, C. S., & White, S. D. M. 2006, Nature, 440, 1137
- Stewart et al. (2013) Stewart, K. R., Brooks, A. M., Bullock, J. S., Maller, A. H., Diemand, J., Wadsley, J., & Moustakas, L. A. 2013, ApJ, 769, 74
- Toomre (1963) Toomre, A. 1963, ApJ, 138, 385
- Toomre (1964) —. 1964, ApJ, 139, 1217
- Toomre (1981) Toomre, A. 1981, in Structure and Evolution of Normal Galaxies, ed. S. M. Fall & D. Lynden-Bell (Cambridge: Cambridge University Press), 111–136
- Tully & Fisher (1977) Tully, R. B. & Fisher, J. R. 1977, A&A, 54, 661
- Übler et al. (2014) Übler, H., Naab, T., Oser, L., Aumer, M., Sales, L. V., & White, S. D. M. 2014, MNRAS, 443, 2092
- van Albada et al. (1985) van Albada, T. S., Bahcall, J. N., Begeman, K., & Sancisi, R. 1985, ApJ, 295, 305
- van Albada & Sancisi (1986) van Albada, T. S. & Sancisi, R. 1986, Royal Society of London Philosophical Transactions Series A, 320, 447
- van den Bergh (1980) van den Bergh, S. 1980, PASP, 92, 409
- van den Bosch (2001) van den Bosch, F. C. 2001, MNRAS, 327, 1334
- van der Kruit (2007) van der Kruit, P. C. 2007, A&A, 466, 883
- van der Kruit & Freeman (2011) van der Kruit, P. C. & Freeman, K. C. 2011, ARA&A, 49, 301
- Weiner et al. (2001) Weiner, B. J., Sellwood, J. A., & Williams, T. B. 2001, ApJ, 546, 931
- White & Rees (1978) White, S. D. M. & Rees, M. J. 1978, MNRAS, 183, 341
- Yegorova et al. (2012) Yegorova, I. A., Babic, A., Salucci, P., Spekkens, K., & Pizzella, A. 2012, Astronomical and Astrophysical Transactions, 27, 335
- Zang (1976) Zang, T. A. 1976, PhD thesis, , Massachussetts Institute of Technology, Cambrigde, MA
- Zepf & Koo (1989) Zepf, S. E. & Koo, D. C. 1989, ApJ, 337, 34
- Zwaan et al. (1995) Zwaan, M. A., van der Hulst, J. M., de Blok, W. J. G., & McGaugh, S. S. 1995, MNRAS, 273, L35