Low frequency QPOs and possible change in the accretion geometry during the outbursts of Aquila X1
Abstract
We have studied the evolution of the Low Frequency Quasi-Periodic Oscillations (LFQPOs) during the rising phase of seven outbursts of the neutron star Soft X-ray Transient (SXT) Aql X1 observed with the Rossi X-ray Timing Explorer (RXTE). The frequency correlation between the low frequency break and the LFQPO sampled on the time scale of 2 days was seen. Except for the peculiar 2001 outburst, the frequency of the LFQPOs increased with time before the hard-to-soft state transition up to a maximum at 31 Hz, a factor of 5 higher than those seen in black hole transients such as GX 3394, making the maximum QPO frequency a likely indicator of the mass of the central compact object. The characteristic frequencies increased by around ten percent per day in the early rising phase and accelerated to nearly one hundred percent per day since 2 days before the hard-to-soft state transition. We examined the dependence of the frequency on the source flux and found an anti-correlation between the maximum frequency of the LFQPOs and the corresponding X-ray luminosity of the hard-to-soft transition (or outburst peak luminosity) among the outbursts. We suggest that X-ray evaporation process can not be the only mechanism that drives the variation of the inner disk radius if either of the twin kHz QPO corresponds to the Keplerian frequency at the truncation radius.
Subject headings:
X-rays: binaries1. Introduction
Low Mass X-ray Binaries (LMXBs) are binary systems that contain a black hole (BH) or neutron star (NS) primary and low mass companion. The primary accretes from the companion through an accretion disk around the compact object which emits predominately in the X-ray band at high mass accretion rates. Soft X-ray transients (SXTs) are transient LMXBs. They spend most of the time in the quiescent state at low luminosity, and occasionally turn into outbursts during which their luminosity increases by several orders of magnitude. During outbursts, SXTs show distinctive states with coupled spectral and timing properties: in the Low-Hard State (LHS) the soft X-ray (e.g., 0.3–10 keV) energy spectrum is dominated by a power-law spectral component and the Fourier power spectrum at low frequency is dominated by broad band noise component and quasi-periodic oscillations (QPOs), and the variability amplitude is quite large at a few tens percent level, while in the High-Soft State (HSS) the soft X-ray energy spectrum is dominated by a thermal disk component and the Fourier power spectrum is dominated by a power-law noise component with little variability (see, e.g., Belloni et al., 2005; Remillard & McClintock, 2006).
Systematic studies of the state transitions in SXTs during the rising phase of transient outbursts suggest that the accretion process is non-stationary: the luminosity of the hard-to-soft state transitions can occur at quite different luminosity, spanning two orders of magnitude which correlates with the rate-of-increase of the luminosity as well as the peak luminosity of the corresponding outbursts (Yu et al., 2004; Yu & Dolence, 2007; Yu & Yan, 2009; Tang et al., 2011). This indicates that the mass accretion rate cannot be the only parameter that determines the transition between the accretion states and the rate-of-change of the mass accretion rate is one important parameter which determines the regimes of the accretion states in SXT outbursts.
The most popular picture for the X-ray energy spectra in the distinct states of black hole and neutron star SXTs is the truncated disk picture, such as the model proposed in Esin et al. (1997). In this picture the change of the energy spectrum is associated with the change of the accretion geometry. A geometrically-thin but optically-thick disk is truncated at the truncation radius. The region within the radius is filled with a hot flow such as the radiatively-inefficient accretion flow. In the quiescent and the hard state, the truncation radius is quite large. During the rising phase of transient outbursts the truncation radius moves inward with increasing mass accretion rate, and reaches the innermost stable orbit during the soft state. The detailed process that truncates the disk is not clear, and proposals for the physical mechanism include magnetosphere-disk interaction (Ghosh et al., 1977, for neutron star systems only) and disk evaporation (e.g., Meyer & Meyer-Hofmeister, 1994; Liu et al., 1999; Meyer et al., 2007).
It was suggested that timing features, especially the quasi-periodic oscillations (QPOs) shown in the power spectra, might be the probe of the accretion geometry and its change in X-ray binaries several decades ago (e.g., van der Klis et al., 1985; van der Klis & Jansen, 1985; Miller et al., 1998; Stella & Vietri, 1998; Osherovich & Titarchuk, 1999; Ingram et al., 2009). The variation in the characteristic frequencies of the QPOs or noise components may reflect the change in the inner most edge of the accretion disk or the size of the corona. Low Frequency Quasi-Periodic Oscillations (LFQPOs) are the most obvious feature in the Fourier power density spectra (PDS) of black hole SXTs in the hard and the intermediate state. For black hole transients, the LFQPOs can be classified into A, B and C-type QPOs (Wijnands et al., 1999; Remillard et al., 2002). Among them, the C-type QPO appears in the hard and hard-intermediate states and its characteristic frequency appears to correlate with the luminosity. There are similar QPOs and broad noise components in neutron star LMXBs. For example, Yu et al. (2003) showed that the 1–20 Hz LFQPOs and broad noise components in the neutron star transient Aql X1 are associated with the LFQPOs and broad noise components commonly seen in black hole transients during outbursts.
Aql X1 is a well-known neutron star transient with very frequent outbursts (e.g., Priedhorsky & Terrell, 1984; Kitamoto et al., 1993; Simon, 2002). Its neutron star nature was revealed by the detection of type-I X-ray bursts from the source (e.g., Koyama et al., 1981; Czerny et al., 1987). Its neutron star spin was detected as well (Zhang et al., 1998; Casella et al., 2008). Based on its spectral and temporal properties (Reig et al., 2000), Aql X1 has been classified as an “Atoll” source, of which great similarities of both timing and spectral properties to those black hole X-ray binaries have been seen. This makes Aql X1 an ideal source for the study of the evolution of the characteristic timescales in the accretion flow during the rising phase of their outbursts, during which drastic changes in the accretion geometry are expected. In this we study the evolution of the LFQPOs during the rising phase of seven outbursts of the neutron star SXT Aql X1 with the observations performed with the RXTE.
2. Observations and Data Reduction
We made use of the RXTE/ASM and the MAXI long-term X-ray monitoring observations of Aquila X1 to identify X-ray outbursts in this study. RXTE/PCA pointed observations were used to study X-ray timing and spectral properties. We have analysed a total of 611 RXTE observations of Aquila X1 performed from 1996 to 2011, starting from the observation 10072-06-01-00 to the observation 96440-01-10-05.
2.1. Long-term Light Curves and Evolution of the Hardness Ratio
Figure 1 shows the long-term X-ray light curve of Aquila X-1. We converted the RXTE/ASM 2–12 keV flux in unit of Crab by dividing the ASM 2-12 keV count rate by the mean Crab count rate of 75.6 cts/s. Similarly, for the later period when RXTE stopped operation, we obtained the source flux in 2–10 keV by combining the 2–4 keV and the 4–10 keV MAXI data which are publicly available.
Figure 2 shows the X-ray light curve and the X-ray hardness ratio seen with the pointed observations of the RXTE/PCA. We extracted source light curves from the PCA standard products111http://heasarc.nasa.gov/docs/xte/recipes/stdprod_guide.html which provide data with a time resolution of 16 seconds from the STD 2 PCA data. The light curves in the PCA standard products have five energy bands, namely 2–9, 2–4, 4–9, 9–20 and 20–60 keV. We identified the time intervals that were associated with Type-I bursts following the screening method mentioned in Klein-Wolt & van der Klis (2008) and excluded these time intervals. Then we calculated the mean count rates per PCU in the five energy bands, and the hardness ratio (HR), which was defined as the count rate ratio between the 9–20 keV and the 2–9 keV in each observation.
2.2. Timing Analysis
We made use of the PCA data with a time resolution better than 0.25 ms and combined all available data in different energy bands whenever possible. We extracted the data and rebinned the light curves into 1/4096 s resolution and then generated the Fourier power spectrum for every 128 s segment. In the analysis of each power spectrum, we took the average power above 1800 Hz to estimate the white noise level, which was then subtracted. We fit each power spectrum with a model composed of several Lorentzians in which zero-centered Lorentzian represents the band-limited noise components and narrow Lorentzians represents the QPOs following the previous approach (Belloni et al., 2002). A power-law component was included to fit the Very Low Frequency Noises (VLFNs) when necessary. These model fits were performed using a custom package making use of the MPFIT package222http://cow.physics.wisc.edu/~craigm/idl/. The best-fit model was achieved by minimizing the , and the uncertainty was obtained from the distribution of . Throughout this paper the error quoted for the power spectral fit represents the 1 uncertainty.
2.3. Spectral Analysis
In order to estimate the X-ray flux of the source, we fit the 3–20 keV Standard 2 PCA energy spectra of the observations when the source was in the hard state during the rising phase of each outburst. The X-ray spectral model we used consisted of four components, namely a power-law component representing the emission from the hot accretion flow, a blackbody component for the emission from the neutron star surface, a Gaussian line component with its central energy fixed at 6.5 keV representing a broad Iron emission line, and the absorption by Galactic neutral hydrogen. We fixed the column density of the neutral hydrogen to , according to Dickey & Lockman (1990). The 2–20 keV flux was then obtained from the spectral fits in XSPEC 12.8.2.
3. Results
3.1. Outburst Sample
As shown in Figure 1, the combined RXTE/ASM and MAXI 2–10 keV light curve of Aql X1 indicates 16 outbursts in total in a period of 16 years, of which the RXTE observations covered the hard X-ray state during the rising phase of seven outbursts, which occurred in 1999, 2000, 2001, 2004, 2009, 2010 and 2011, respectively, as indicated by the triangles in the plot.

The PCA 2–20 keV count rate and the HR during the seven outbursts are shown in Figure 2. The peak count rate ranged from 200 (the 2001 outburst) to 1800 (the 2011 outburst) , spanning nearly one order of magnitude in the RXTE observations. For the 1999, 2000, 2004, 2010 and 2011 outbursts, the hard-to-soft state transitions are clearly shown by the abrupt decrease of the HR from 1.0 to 0.2. For the 2001 outburst, the hard-to-soft state transition was identified in Yu & Dolence (2007), which was made based on HEXTE(15–250 keV)/PCA(2–9 keV) hardness ratio. So we used the previous identification. The time of the hard-to-soft state transition corresponds to the observation 60054-02-04-00 on MJD 52095. It is also worth noting that the 2001 outburst was peculiar since it was not a Fast Rise with Exponential Decay (FRED) outburst as others. In addition, the hard-to-soft state transition in the 2001 outburst was also peculiar since it occurred when the luminosity declined Yu & Dolence (2007). For the 2009 outburst, we identified the time corresponding to the hard-to-soft state transition based on source timing properties. This is based on the fact that for other atoll sources, such as 4U 160852, the state transition is accompanied by the transition of properties of the power spectra (see for example, Figure 7 of van Straaten et al. 2003). In Aql X1 we saw such a transition in the power spectra from the observation 94076-01-04-04 taken on MJD 55152.2 to the observation 94076-01-04-05 taken on MJD 55153.1, hence we can conclude that the source left the hard state between these two observations.

3.2. The Evolution of the Power Spectra
Figure 3 shows the evolution of the power spectra in the rising phase of the seven outbursts during which the LFQPOs and the band-limited noise components were seen. The most obvious component below 100 Hz is the LFQPO component of which the frequency evolved gradually from several Hz to tens of Hz. The LFQPO component also corresponds to the maxima in the vs. Frequency plot below 100 Hz. We have found that the LFQPOs had the following properties:
-
1.
In all except the 2001 outburst, the frequency increased with time before the state transition. This indicates that the characteristic timescale corresponding to the LFQPO decreased with time during the rising phase of the outbursts.
-
2.
In all except the 2001 outburst, the frequency appeared to increase more rapidly just before the hard-to-soft state transition than during the earlier stages. This is best-illustrated in the 1999 outburst. Notice that the power spectra are plotted in the logarithmic scale and the power spectra are shifted by multiplying a factor proportional to the time separation between the observations.

To quantitatively analyze the frequency evolution of the LFQPO and other noise components, we fit the power spectra with multi-Lorentzians following the previous approach (Belloni et al., 2002). By doing so the power spectra can be decomposed into several Lorentzian components empirically (e.g., Belloni et al., 2002; van Straaten et al., 2002, 2003; Klein-Wolt & van der Klis, 2008), allowing us to study frequency correlations among the characteristic frequencies. Some examples of our model fits can be seen in Figure 4, in which we show the power spectra with the best-fit models corresponding to three observations performed during the 1999 outburst. The components with the lowest frequency can be identified as the noise component, , as defined in previous studies. Two distinct components, a narrow component at a lower frequency and a prominent broader component with a higher frequency, were found in the frequency range from several Hz to tens of Hz. The broader and stronger components are the LFQPOs. In more than half of the observations, the narrow feature is not required in the power spectral fit. The components with higher frequencies are identified as and , following the conventions used in Belloni et al. (2002).

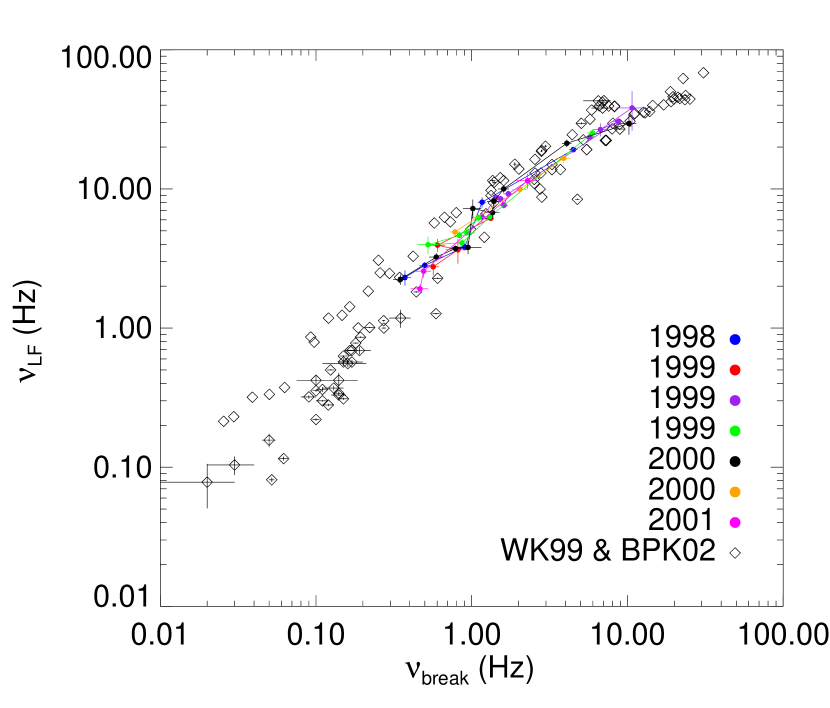
It has been found that the characteristic frequencies of broad noise and narrow QPO components are correlated (e.g. Wijnands & van der Klis, 1999; Psaltis et al., 1999; Belloni et al., 2002). To compare with the results obtained from other sources and to study how these characteristic frequencies are correlated during single outbursts in the RXTE era, we plotted the LFQPO characteristic frequency vs. break frequency , along with the data shown in the WK99 relation (Wijnands & van der Klis, 1999) and the BPK02 relation (Belloni et al., 2002) in Figure 5. The correlation of and in Aql X1 is consistent with the correlation in other sources as expected.
3.3. Maximum LFQPO Frequency and the Evolution Pattern
The evolution of the characteristic frequency of the LFQPOs in seven outbursts is shown in Figure 6. First we examined the maximum LFQPO frequency the source can reach in the hard states; this frequency may correspond to a certain radius or timescale in the accretion flow when the state transition occurs. As seen from Figures 6, the maximum LFQPO frequency varies among outbursts, from in the 2000 outburst to in the 2001 outburst, although the uncertainty of the latter is quite large. In the 2009 outburst, the maximum frequency was . We took the weighted average of the maximum LFQPO frequency of the 1999 and the 2001 outburst, i.e., , as the estimate of the maximum LFQPO frequency seen in Aql X1 in the following discussion.
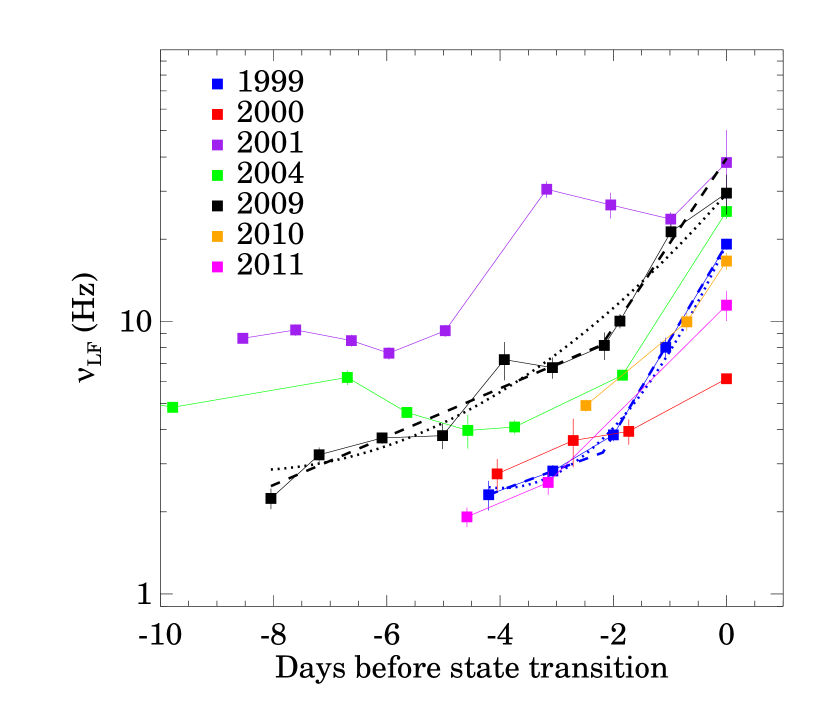
The evolution pattern of was quite similar among the outbursts. In the following analysis, for the 2004 outburst, we concentrated on the last four observations in the hard state before the hard-to-soft transition, since earlier observations corresponded to a special flare in the light curve, as can be seen from Figure 2. For the peculiar 2001 outburst, the frequency was around 10 Hz at the beginning, then increased rapidly to around 30 Hz at about 6 days before the state transition, and then decreased to around 24 Hz at about just one day before the transition, and finally turned to around 40 Hz at the time of the state transition. For all the other outbursts, the frequency of the LFQPO increased with time consistently during the rising phase of the outbursts.
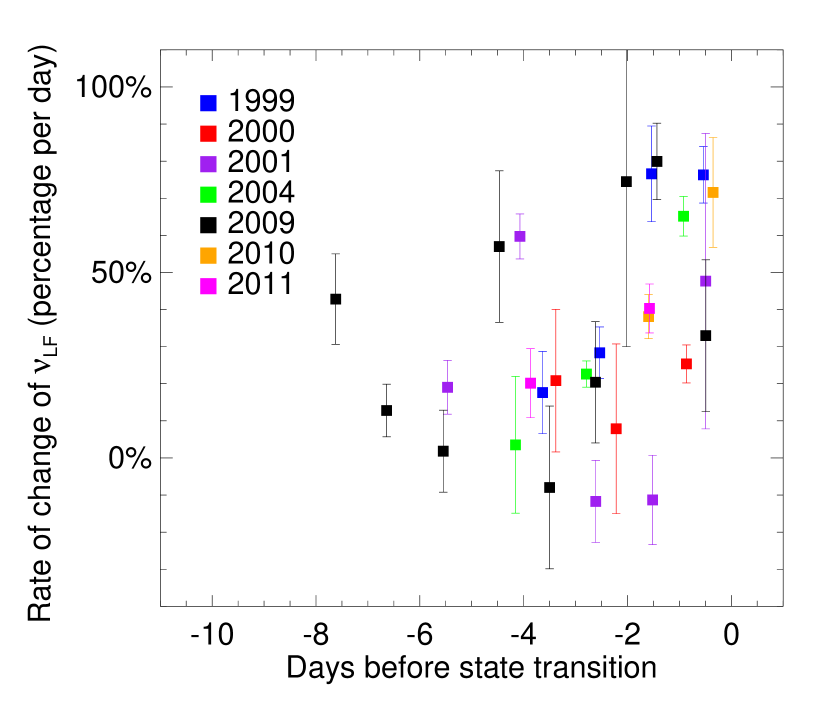
In our model-independent approach, we estimated the rate-of-change of the LFQPO frequency, following , where is the LFQPO frequency, is the time, and the subscripts 1 and 2 denote two consecutive observations. Then we calculated the fractional rate-of-change of the frequency , corresponding to the time at . Figure 7 shows the time evolution of the fractional rate-of-change. The fractional rate-of-change increased from 10% day-1 at the beginning of the outburst, to 100% day-1 just before the state transition.
The pattern of the increase of the LFQPO frequency deviates from a single exponential pattern, which would follow a straight line if plotted in logarithmic scales, and the fractional rate-of-change would be constant with time. We tried two phenomenological models to fit the pattern. The first one is an exponential quadratic polynomial, i.e. . This function is continuous and the fractional rate-of-change increases with time when the parameter a is positive; the second one is of a broken exponential function, i.e., the frequency first increases with a constant e-folding timescale , then afterwards the frequency increases with another constant e-folding timescale . We fit the models to the data of the 1999 outburst and the 2009 outburst which have the most number of data points available (which is also more than the number of model parameters). The dashed and the dotted lines show the best-fit broken exponential and exponential quadratic polynomial models, respectively. Notice that the time at zero corresponds to the time when the last observation of the source in the hard state was taken.
For the 2009 outburst, the were 8.76 with 6 Degrees of Freedom (DOF) and 34.25 with 7 DOF for the broken exponential function and exponential quadratic polynomial function, respectively, indicating that the former model describes the pattern of the frequency evolution better. The result from the best-fit broken exponential model showed that the frequency increased with an e-fold timescale of and days before and after the moment at days before the state transition, respectively. For the 1999 outburst, the model fit with an exponential quadratic polynomial gave a good fit with with 2 DOF, while the fit with the broken exponential model yielded a with 1 DOF, indicating we were lacking statistics to constrain the later model. The trend in both the 2009 outbursts suggests that the frequency increased with time at different speed in the early and in the late stage of the hard state during the rising phase of an outburst, further supporting the idea that the transition is associated with non-stationary accretion during these outbursts.
3.4. LFQPO Frequency and Its Dependence on the X-ray Flux
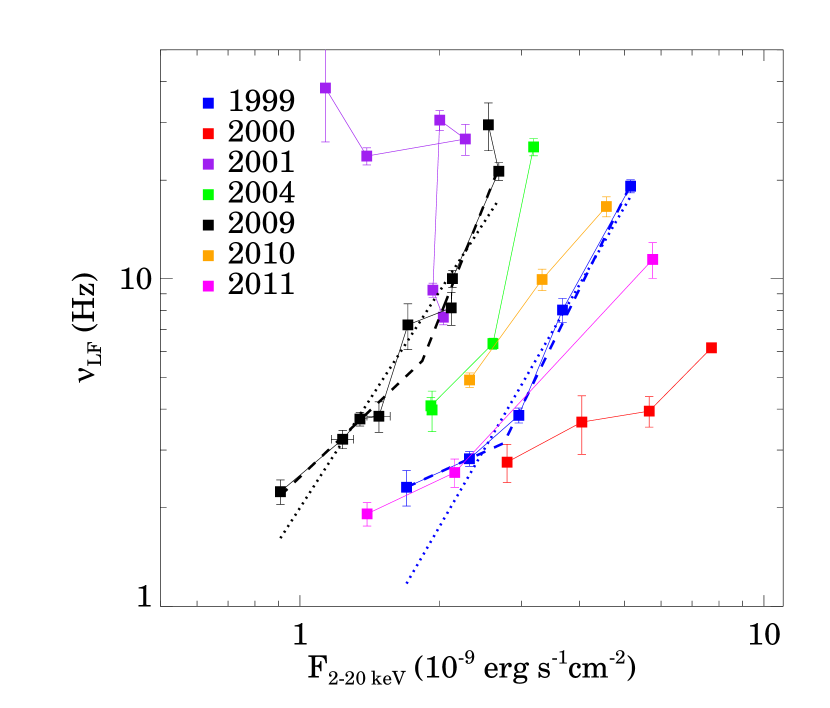
In Figure 8 we show how the LFQPO frequency evolved with the 2–20 keV flux. During the rising phase of an outburst, the frequency in general increased with the X-ray flux, except for the peculiar 2001 outburst. The frequency-flux relation for each outburst deviates from a straight line on a log-log plot, showing that it does not follow a simple power-law relation. The power-law model was only acceptable for the 2000 outburst, with and 1 DOF, while for other outbursts the model was rejected. The model parameters in the fits with the power-law model are tabulated in Table 1. We fit the data with a broken power-law model instead. Such a model consists of four free parameters: the normalization, the break frequency, and the power-law indices before and after the break. We fit the model to the data corresponding to the 1999 and the 2009 outburst which have more than four data points.
| Year | N | DOF | ||
|---|---|---|---|---|
| 1999 | 36.80 | 3 | ||
| 2000 | 3.48 | 2 | ||
| 2004 | 98.50 | 2 | ||
| 2009 | 39.36 | 7 | ||
| 2010 | 0.59 | 1 | ||
| 2011 | 4.89 | 1 |
Note. — The parameters of best-fit power-law model of frequency vs. 2–20 keV flux: , where and is flux in .
For the 1999 outburst, the broken power-law model yielded a with 1 DOF while the power-law model gave a with 3 DOF, showing a preference for the broken power-law model. In that model, the break occurred at . The index before the break was not well constrained, giving , while the index after the break was well-constrained as . Fitting with the broken power-law model yielded a with 5 DOF, while the power-law model fit gave a with 7 DOF. The break frequency occurred at . The power-law indices were and before and after the break, respectively. The best-fit power-law and broken power-law models are plotted as dashed and dotted lines, respectively, in Figure 8.
Among different outbursts, the power spectra show that the source can reach significantly different characteristic QPO frequencies at similar X-ray fluxes. For instance, as shown in Figure 8, at a source flux of , the frequency of the LFQPO was at around 2 Hz for the 1999 and the 2011 outburst, but at around 30 Hz for the 2001 outburst. It is interesting to notice that for a certain characteristic frequency, the X-ray flux is usually higher in the outbursts in the years of 1999, 2000 and 2011, which were associated with higher state transition fluxes, while the X-ray flux corresponding to the same QPO frequency was lower in the outbursts in the years of 2001, 2004, 2009 and 2010, which were associated with lower state transition fluxes. There is another anti-correlation between the maximum LFQPO frequency and the state transition flux (or the outburst peak X-ray luminosity), with the Spearman correlation coefficient of -0.96 at a significance level of . This is shown in the upper-right corner of Fig. 8. Actually the maximum frequency of the LFQPO was reached during the 2001 and the 2009 outburst, which was associated with the lowest state transition fluxes.
4. Conclusion and Discussion
We have analyzed the observations obtained during the rising phase of seven outbursts of the neutron star soft X-ray transient Aql X1 with the RXTE/PCA when the source was in the hard state. As expected, in the power spectra, the characteristic break frequencies of the band-limited noise component and the frequency of the LFQPOs were correlated, consistent with the overall correlation established in a large sample of black hole and neutron star X-ray binaries previously found.
The frequency evolution of LFQPOs is shown in Figure 3. Both the characteristic frequency of the band-limited noise and the frequency of the LFQPOs increased with the PCA/2–20 keV count rate before the hard-to-soft state transitions, except for the peculiar 2001 outburst. We found that the maximum frequency of the LFQPOs in Aql X1 can reach 31 Hz. We measured the rate-of-change of the LFQPO frequency during the rising phase of the outbursts and found that the frequencies increased by around one tenth per day in the early stage of the outbursts to nearly one hundred percent per day nearly two days before the hard-to-soft state transition. In the 2009 outburst, for which we have the best data available, we found that the frequency of the LFQPOs actually increased with time with an e-folding timescale of and days in the early rising phase and in the later rising phase, respectively.
In Figure 5 we also show that the frequency correlation between band-limited noise and the LFQPOs holds down to the timescale of one to two days, since the RXTE observations were taken roughly every other day. It would be interesting to investigate the correlation on shorter time scales with future X-ray missions to test if such a correlation holds on shorter time scales. In addition, we found that the characteristic frequency vs. flux relation is significantly different among the seven outbursts. Higher characteristic frequency is reached by the source at similar X-ray flux levels in the outbursts with lower state transition and outburst peak fluxes. In individual outbursts, the relationship between the frequency and the source flux deviated from a simple power-law form. The frequency depended on the source flux. For the 2009 outburst, If we model it with a broken power-law function, we found that the power-law indices were and before and after the break, respectively. The observed multiple relation between the LFQPO frequency and X-ray flux and the fast variation of the frequency would potentially put strong constraints on the Lense-Thirring precession model of the LFQPO proposed by (Ingram et al., 2009), if quantitative prediction of the relation between the transitional radius, the mass accretion rate and the Lense-Thirring precession frequency can be delivered.
4.1. Maximum LFQPO Frequency: Indicator of the Mass of the Compact Object ?
In this work, we found that the maximum frequency of the LFQPOs in Aql X1 observed with the RXTE was 31 Hz. In a similar study of the black hole transient GX 3394 we found that the maximum frequency of the LFQPOs was around 5 Hz, which is about six times lower than that of Aql X1. Özel et al. (2012) showed that the mass of the neutron stars in the recycled pulsars has a mean value of with a dispersion of . We know that the black hole binary GX 3394 has a mass function of (Hynes et al., 2003), so we do not know the exact mass ratio. If we take its mass as a typical value of 10 solar masses in black hole X-ray binaries, the mass ratio between the compact stars in the two systems seems consistent with the ratio between their maximum frequencies of the LFQPOs. This suggests that the maximum frequency of the LFQPOs may be an indicator of the mass of the compact star. By observing the maximum frequency of the LFQPOs during outbursts, we may be able to determine the nature of the compact star in a new transient LMXBs empirically.
4.2. Tracing the Inner Disk Radius with LFQPO ?
Using the observations we analysed, we can investigate whether it is possible to trace the evolution of the truncation radius using the LFQPO based on current disk truncation models and to constrain these models with observations. It has been believed that the frequency of one of the twin kHz QPOs might be associated with the Keplerian frequency at the inner disk edge (e.g., Miller et al., 1998; Stella & Vietri, 1998; Osherovich & Titarchuk, 1999). Therefore we can probably associate the frequency of the LFQPOs with the inner disk edge (or the truncation radius in some popular models) based on the empirical frequency correlation between the kHz QPOs and the LFQPOs. The empirical correlations found in the RXTE data suggest that for the lower kHz QPO at frequency , the frequency of the LFQPO is (Psaltis et al., 1999). The empirical relation between the lower and the upper kHz QPO is (Psaltis et al., 1998). This yields the relation between the LFQPO and the upper kHz QPO as .
In the magnetospheric model (Ghosh et al., 1977; Ghosh & Lamb, 1979), the inner edge of the disk is where the ram pressure is balanced by the magnetic pressure. Ghosh & Lamb (1979) studied the structure of a geometrically thin disk around a magnetized neutron star and found that the disk is truncated at , where is the Alfvén radius, i.e., , here is the magnetic dipole moment and is the neutron star radius, and is a parameter which does not affect configuration a lot. The magnetospheric model therefore predicts that the truncation radius .
In the disk evaporation model, the heat generated in the corona formed above the disk is conducted down to the lower layer of the corona and radiated away. If the density of the lower layer is too low to efficiently radiate away the heat, the thin disk would be heated and then evaporated, leading to a steady mass flow from the disk to the corona. In a stationary state, the outer disk would be truncated at a radius where the evaporation is balanced by the mass inflow from the outer disk. This truncation radius lies at . Further development of the model included the effect of the viscosity and the accretion disk magnetic field (Taam et al., 2012; Liu & Taam, 2013), which gives the truncation radius , where is the viscous parameter and is the ratio of gas pressure to total pressure. The truncation radius depends only weakly on the viscosity.
It is worth noting that the parallel-track phenomenon of the LFQPO shown in Fig. 8, which is similar to that seen for the kHz QPOs, actually suggests that mass accretion rate is not the only parameter that determines the QPO frequency. However, let’s consider the simplest case where mass accretion rate is the only parameter in the accretion system. As we know, both disk truncation models predict that the truncation radius is a function of the mass accretion rate, i.e., , where is the normalization coefficient. Then we get the relation between the LFQPO frequency and the mass accretion rate as if taking the lower kHz QPO as the orbital frequency at the inner disk edge and as if taking the upper kHz QPO frequency as the Keplerian frequency at the inner disk edge. For the former case, the index is in the evaporation model and in the magnetospheric model; while in the later case which corresponds to the upper kHz QPO assumption, the index is in the evaporation model and in the magnetospheric model. In the above estimates we have assumed that the bolometric correction factor was a constant during those observations and that the bolometric luminosity was proportional to the mass accretion rate (i.e., the radiation efficiency did not change a lot).
In Section 3.4 we showed that for the well-sampled 2009 outburst, the frequency vs. the X-ray flux relation was best-fit by a broken power-law model with indices of and before and after the trend break. Both of the values are larger than that predicted by the magnetospheric model. As for the disk evaporation model, we found that for the case corresponding to the lower kHz QPO assumption, during the early rising phase of the outburst, the observed index before the trend break is consistent with the model, while after the break the observed index is much larger than that predicted by the disk evaporation model. This might indicate that the disk evaporation model is consistent with the observed evolution of the inner disk edge at the early rising phase of those outbursts but not later on. For the case corresponding to the upper kHz QPO assumption, the disk evaporation model overestimates the index in the early stage of the outburst but underestimates the index in the later stage. This suggests that at least additional physics should be considered in the current disk evaporation model. We also realised that additional constraints can be put on the evaporation model as well from the so-called ‘parallel-track’ phenomenon of the LFQPO. In the improved evaporation model investigated in Taam et al. (2012), the truncation radius, , depends on the magnetic field in the accretion disk as . In order to explain the observations showing that lower characteristic frequency can be observed under similar mass accretion rates in the outbursts with a higher state transition luminosity, the disk evaporation theory with the consideration of the magnetic field has to be consistent with the fact the brighter an outburst is, the lower the magnetic pressure in the accretion disk should be, due to the fact that there is empirical correlation between the luminosity of the hard-to-soft transition and the peak luminosity of the outburst or the following soft state (Yu et al., 2004; Yu & Dolence, 2007; Yu & Yan, 2009).
References
- Belloni et al. (2005) Belloni, T., Homan, J., Casella, P., et al. 2005, A&A, 440, 207
- Belloni et al. (2002) Belloni, T., Psaltis, D., & van der Klis, M. 2002, ApJ, 572, 392
- Casella et al. (2008) Casella, P., Altamirano, D., Patruno, A., Wijnands, R., & van der Klis, M. 2008, ApJ, 674, L41
- Czerny et al. (1987) Czerny, M., Czerny, B., & Grindlay, J. E. 1987, ApJ, 312, 122
- Dickey & Lockman (1990) Dickey, J. M., & Lockman, F. J. 1990, ARA&A, 28, 215
- Esin et al. (1997) Esin, A. A., McClintock, J. E., & Narayan, R. 1997, ApJ, 489, 865
- Ghosh & Lamb (1979) Ghosh, P., & Lamb, F. K. 1979, ApJ, 232, 259
- Ghosh et al. (1977) Ghosh, P., Pethick, C. J., & Lamb, F. K. 1977, ApJ, 217, 578
- Hynes et al. (2003) Hynes, R. I., Steeghs, D., Casares, J., Charles, P. A., & O’Brien, K. 2003, ApJ, 583, L95
- Ingram et al. (2009) Ingram, A., Done, C., & Fragile, P. C. 2009, MNRAS, 397, L101
- Kitamoto et al. (1993) Kitamoto, S., Tsunemi, H., Miyamoto, S., & Roussel-Dupre, D. 1993, ApJ, 403, 315
- Klein-Wolt & van der Klis (2008) Klein-Wolt, M., & van der Klis, M. 2008, ApJ, 675, 1407
- Koyama et al. (1981) Koyama, K., Inoue, H., Makishima, K., et al. 1981, ApJ, 247, L27
- Liu & Taam (2013) Liu, B. F., & Taam, R. E. 2013, ApJS, 207, 17
- Liu et al. (1999) Liu, B. F., Yuan, W., Meyer, F., Meyer-Hofmeister, E., & Xie, G. Z. 1999, ApJ, 527, L17
- Meyer et al. (2007) Meyer, F., Liu, B. F., & Meyer-Hofmeister, E. 2007, A&A, 463, 1
- Meyer & Meyer-Hofmeister (1994) Meyer, F., & Meyer-Hofmeister, E. 1994, A&A, 288, 175
- Miller et al. (1998) Miller, M. C., Lamb, F. K., & Psaltis, D. 1998, ApJ, 508, 791
- Osherovich & Titarchuk (1999) Osherovich, V., & Titarchuk, L. 1999, ApJ, 522, L113
- Priedhorsky & Terrell (1984) Priedhorsky, W. C., & Terrell, J. 1984, ApJ, 280, 661
- Psaltis et al. (1999) Psaltis, D., Belloni, T., & van der Klis, M. 1999, ApJ, 520, 262
- Psaltis et al. (1998) Psaltis, D., Méndez, M., Wijnands, R., et al. 1998, ApJ, 501, L95
- Reig et al. (2000) Reig, P., Méndez, M., van der Klis, M., & Ford, E. C. 2000, ApJ, 530, 916
- Remillard & McClintock (2006) Remillard, R. A., & McClintock, J. E. 2006, ARA&A, 44, 49
- Remillard et al. (2002) Remillard, R. A., Sobczak, G. J., Muno, M. P., & McClintock, J. E. 2002, ApJ, 564, 962
- Sanna et al. (2012) Sanna, A., Méndez, M., Belloni, T., & Altamirano, D. 2012, MNRAS424, 2936
- Simon (2002) Simon, V. 2002, A&A, 381, 151
- Stella & Vietri (1998) Stella, L., & Vietri, M. 1998, ApJ, 492, L59
- Taam et al. (2012) Taam, R. E., Liu, B. F., Yuan, W., & Qiao, E. 2012, ApJ, 759, 65
- Tang et al. (2011) Tang, J., Yu, W.-F., & Yan, Z. 2011, Research in Astronomy and Astrophysics, 11, 434
- van Straaten et al. (2002) van Straaten, S., van der Klis, M., di Salvo, T., & Belloni, T. 2002, ApJ, 568, 912
- van Straaten et al. (2003) van Straaten, S., van der Klis, M., & Méndez, M. 2003, ApJ, 596, 1155
- van der Klis et al. (1985) van der Klis, M., Jansen, F., van Paradijs, J., et al. 1985, Nature, 316, 225
- van der Klis & Jansen (1985) van der Klis, M., & Jansen, F. A. 1985, Nature, 313, 768
- Wijnands & van der Klis (1999) Wijnands, R., & van der Klis, M. 1999, ApJ, 514, 939
- Wijnands et al. (1999) Wijnands, R., Homan, J., & van der Klis, M. 1999, ApJ, 526, L33
- Yu & Dolence (2007) Yu, W., & Dolence, J. 2007, ApJ, 667, 1043
- Yu et al. (2003) Yu, W., Klein-Wolt, M., Fender, R., & van der Klis, M. 2003, ApJ, 589, L33
- Yu et al. (2004) Yu, W., van der Klis, M., & Fender, R. 2004, ApJ, 611, L121
- Yu & Dolence (2007) Yu, W., & Dolence, J. 2007, ApJ, 667, 1043
- Yu & Yan (2009) Yu, W., & Yan, Z. 2009, ApJ, 701, 1940
- Özel et al. (2012) Özel, F., Psaltis, D., Narayan, R., & Santos Villarreal, A. 2012, ApJ, 757, 55
- Zhang et al. (1998) Zhang, W., Jahoda, K., Kelley, R. L., et al. 1998, ApJ, 495, L9