5.9 keV Mn K-shell X-ray luminosity from the decay of in Type Ia supernova models
Abstract
We show that the X-ray line flux of the Mn Kα line at from the decay of is a promising diagnostic to distinguish between Type Ia supernova (SN Ia) explosion models. Using radiation transport calculations, we compute the line flux for two three-dimensional explosion models: a near-Chandrasekhar mass delayed detonation and a violent merger of two (1.1 and 0.9 ) white dwarfs. Both models are based on solar metallicity zero-age main sequence progenitors. Due to explosive nuclear burning at higher density, the delayed-detonation model synthesises times more radioactive than the merger model. As a result, we find that the peak Mn Kα line flux of the delayed-detonation model exceeds that of the merger model by a factor of . Since in both models the X-ray flux peaks five to six years after the explosion, a single measurement of the X-ray line emission at this time can place a constraint on the explosion physics that is complementary to those derived from earlier phase optical spectra or light curves. We perform detector simulations of current and future X-ray telescopes to investigate the possibilities of detecting the X-ray line at . Of the currently existing telescopes, XMM-Newton/pn is the best instrument for close (), non-background limited SNe Ia because of its large effective area. Due to its low instrumental background, Chandra/ACIS is currently the best choice for SNe Ia at distances above . For the delayed-detonation scenario, a line detection is feasible with Chandra up to for an exposure time of . We find that it should be possible with currently existing X-ray instruments (with exposure times ) to detect both of our models at sufficiently high S/N to distinguish between them for hypothetical events within the Local Group. The prospects for detection will be better with future missions. For example, the proposed Athena/X-IFU instrument could detect our delayed-detonation model out to a distance of . This would make it possible to study future events occurring during its operational life at distances comparable to those of the recent supernovae SN 2011fe () and SN 2014J ().
keywords:
nuclear reactions, nucleosynthesis, abundances – X-rays: general – line: formation – radiative transfer – supernovae: general – white dwarfs1 Introduction
SNe Ia are important for a variety of astrophysical research fields. Besides their relevance as distance indicators in cosmology (e.g. Schmidt et al., 1998; Riess et al., 1998; Perlmutter et al., 1999), they are an important ingredient in models of star formation and galaxy dynamics (e.g. Scannapieco et al., 2008). Furthermore, their nucleosynthesis contributes significantly to the chemical evolution of galaxies (e.g. Burbidge et al., 1957) and they are possible sources of galactic positrons (e.g. Clayton, 1973) and gamma rays (e.g. Clayton et al., 1969). Despite their significance, a clear picture of the progenitor systems and explosion mechanisms responsible for SNe Ia continues to elude us. It is generally agreed that thermonuclear explosions of carbon–oxygen white dwarfs (WDs) are the origin of SN Ia explosions, but a variety of evolutionary channels leading to such an explosion have been suggested. For a recent review of explosion scenarios and explosion models see e.g. Hillebrandt et al. (2013).
Although SNe Ia are now routinely observed in the optical part of the electromagnetic spectrum, a clear distinction between competing explosion scenarios based only on the optical emission of the SNe is difficult (e.g. Röpke et al., 2012). Recently, there has been a revived effort to identify additional signatures, such as the contribution to the early-time light curve from a possible companion (e.g. Kasen, 2010; Bloom et al., 2012; Brown et al., 2012), Na I D line absorption features interpreted as evidence for circumstellar material (Patat et al., 2007; Sternberg et al., 2011; Dilday et al., 2012), gamma-ray line and continuum emission (e.g. Sim & Mazzali, 2008; Maeda et al., 2012; Summa et al., 2013), or the chemical evolution of Mn in the Galaxy (Seitenzahl et al., 2013a), to distinguish between different explosion models.
X-ray emission from SNe Ia is another, although still unobserved, signature of the physical processes occurring in these explosions. X-rays in SNe Ia are produced in several ways, including bremsstrahlung of fast recoil Compton electrons, down-scattering of gamma rays, as well as the relaxation of ionised atoms following photoelectric absorption, Compton scattering, collisional ionisation or electron capture decay (e.g. Burrows & The, 1990; Clayton & The, 1991; The et al., 1994). The & Burrows (2014) show that SN 2014J in M82 is sufficiently close that NuSTAR (Harrison et al., 2013), ASTRO-H (Kokubun et al., 2010), and perhaps INTEGRAL (Lebrun et al., 2003) could detect the emerging hard X-ray emission and possibly constrain explosion models with the data. Incidentally, SN 2014J is the first SN Ia for which gamma rays from the decay of (Diehl et al., 2014) and (Churazov et al., 2014) have been observed (with INTEGRAL). However, although The & Burrows (2014) extensively analyse the prospects of detecting X-rays from SN 2014J, they do not discuss the Mn Kα line from the decay of . Leising (2001) already pointed out that X-ray signals of SN electron capture radionuclides such as can be used as a diagnostic of SN nucleosynthesis by directly measuring isotopic abundances. A search for the Kα line in of Chandra/ACIS data of SN 1987A only produced upper limits (Leising, 2006). However, Leising (2001) already noted that SNe Ia (from exploding near-Chandrasekhar mass WDs) synthesise significantly more than core-collapse SNe, which enhances prospects of detection.
In this paper, we revisit the detection prospects of the X-ray emission directly related to the radioactive decay of produced in SNe Ia. These X-rays are emitted when the atomic electron configuration of the daughter nucleus relaxes to eliminate K-shell vacancies. Electron capture of produces a line doublet with energies of () and () (Junde, 2008). Using three-dimensional hydrodynamical simulations and subsequent radiative transfer calculations, we determine the respective line fluxes for two explosion models – a violent merger of two WDs with a sub-Chandrasekhar mass primary, and a delayed detonation in a near-Chandrasekhar mass WD. For the latter, we use the N100 model from Seitenzahl et al. (2013b). For the violent merger of two WDs (1.1 and 0.9 ), we use the model published in Pakmor et al. (2012). These two explosion models have been shown to reproduce many of the observable characteristics of “normal” SNe Ia (Röpke et al., 2012; Sim et al., 2013) and are representatives of the single degenerate and double degenerate evolutionary channels, respectively. Details of the simulation techniques can be found in the original publications and references therein. We have chosen these two explosion models as illustrative examples that highlight the dependence of the yield on the explosion scenario and primary WD mass. Both models employ a fully three-dimensional treatment of the explosion hydrodynamics, which, compared to lower dimensional models, establishes a more realistic description of the distribution of the radioactive isotopes in the ejecta and enables radiative transfer calculations for different lines of sight. We consider the use of three-dimensional models important for this problem for the following reason: driven by buoyancy forces, hot and less dense ashes of the nuclear burning “float towards the surface”, that is, they travel in mass coordinate against the gravitational field lines, their places filled by unburned material from down-drafts. This physical behaviour is present in our 3D model but is completely absent in 1D models, where the symmetry constraint makes convective motion impossible and forces the burning products to an artificial “onion-like” shell structure (where they remain layered in the same order they were burned). This leads to differences in the location of important isotopes: for example, comparing the mass distribution of the N100 (Seitenzahl et al., 2013b, 2014) and say W7 (Iwamoto et al., 1999) models, we see that the Mn (coming from ), predominantly arising from ”normal” freeze-out from nuclear statistical equilibrium (NSE), sits in qualitatively different positions, that is, centrally concentrated at low velocity in the W7 and roughly speaking in a spherical shell at intermediate velocities in our 3D models. We then use the results of the radiative transfer calculations as input for X-ray telescope signal simulations and investigate the prospects for distinguishing the explosion models for several current and proposed X-ray astronomy missions.
For explosive nucleosynthesis conditions occurring in SNe Ia, only a small fraction of the () that is present in the ejecta a few weeks after the explosion was produced as “primary” . Most of the present at late times was synthesised as (e.g. Truran et al., 1967). decays with a half-life of to and is mainly produced for electron fractions in two distinct processes: “normal” freeze-out from NSE and incomplete Si-burning. For freeze-out from NSE to be “normal”, the mass fraction of during the freeze-out phase has to remain rather low (1 per cent, e.g. Woosley et al., 1973). This is the case for explosive nuclear burning at relatively low entropy, which implies high density (, cf. Thielemann et al., 1986; Bravo & Martínez-Pinedo, 2012).
In our delayed detonation of a near-Chandrasekhar mass WD, densities sufficiently high to undergo “normal” freeze-out from NSE are realised. In contrast, the merger model has much lower peak densities and predominantly synthesises via incomplete Si-burning (the present in NSE for such low central density models is mostly destroyed during the alpha-rich freeze-out via , cf. Jordan et al., 2003). A recent study has shown that the to production ratio is rather insensitive to nuclear reaction rate uncertainties (Parikh et al., 2013). Thus, our models should make a rather robust prediction of different yields for the two explosion scenarios (at equal masses, the abundance of is significantly higher for the delayed detonation), which also drives the different predicted behaviour of late time bolometric light curves (Seitenzahl et al., 2009; Seitenzahl, 2011; Röpke et al., 2012) and the different Mn production (Seitenzahl et al., 2013a) of these two explosion models.
2 Radiative Transfer Simulations
We compute the photon flux (photons cm-2 s-1 keV-1) in the Mn Kα line at energy at time (relative to explosion) for an observer orientation specified by unit vector using
| (1) |
where the integral runs over the entire volume of the ejecta and is the distance of the SN. Here, yr is the half-life of (the parent of ), (Junde, 2008) is the probability per decay of producing a Mn Kα photon, is the rest energy of the line, is the mass density of the ejecta at position , is the Dirac delta function, is the atomic mass of and is the sum of the mass fractions of and at (i.e. immediately after explosion). Note that we are treating the decay to as effectively instantaneous (since, as noted above, its half life is orders of magnitude shorter). The optical depth is given by
| (2) |
where is the photo-absorption cross-section (cm2 g-1) at (we use the results from Henke et al. 1993), and the mass fraction of the element with atomic number . The line integral runs along the ray defined by from the starting point to the outer edge of the ejecta. Our approach ignores light-travel time effects and assumes that photo-absorption is the dominant opacity – i.e. electron scattering is relatively unimportant, which is a good approximation in SNe Ia ejecta at the epochs of interest (several years post explosion).
To evaluate equations (1) and (2), we use the ejecta properties provided by our hydrodynamic explosion models. Specifically, as in e.g. Kromer et al. (2010), we use the distributions of density and composition reconstructed (on uniform Cartesian grids) via a smoothed-particle-hydrodynamics-like algorithm from the ensemble of nucleosynthesis tracer particles at the final state of the explosion simulations (). For all later times it is assumed that the ejecta follow a homologous expansion law.
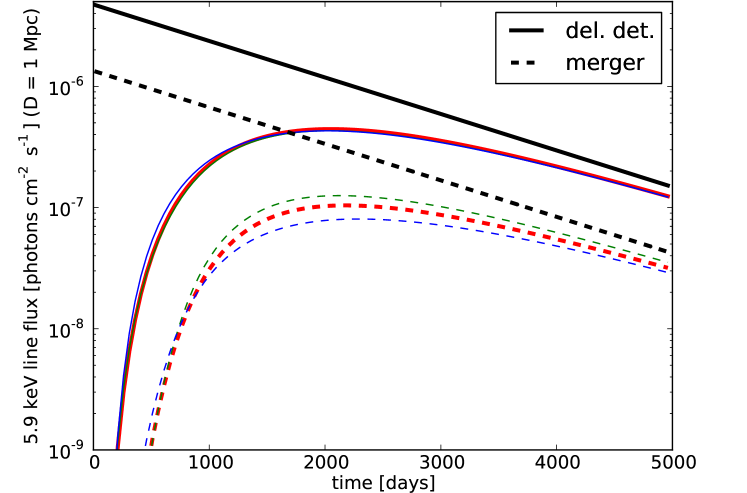
The results of our radiative transport calculations for the two different explosion scenarios are given in Fig. 1, which shows the total line flux obtained by integrating equation 1 over photon energy, . The line flux is significantly larger for the delayed detonation than for the violent merger due to the greater mass of synthesised . The time evolution of the X-ray line flux is similar in both cases. Due to the relatively long half-life of and the large photoelectric opacity of the ejecta to X-rays at early times, it takes roughly to reach the maximum fluxes. This also defines the optimal time frame for X-ray observations of the emission line. The influence of attenuation effects can be clearly seen in comparison to the X-ray “free-streaming” limits (see Fig. 1). Photoelectric opacity continues to be relevant in both models until .
For both models, we plot the evolution of the line fluxes for three orthogonal lines of sight to the explosion. As inferred from the colour-coded set of curves for each model, the effect of different viewing angles is negligible for the delayed-detonation and moderate for the violent-merger model. There, the asymmetric ejecta structure and the inhomogeneous distribution of the radioactive isotopes (cf. Pakmor et al., 2012) lead to a larger (but still modest) spread between the flux values. However, unlike in gamma rays (cf. Summa et al., 2013), there is no degeneracy between the two models for different viewing angles.
3 Observability of the 5.9 keV line
In this section, we discuss the detectability of the emission line by current and future X-ray observatories. In addition to the expected signal from the SN Ia X-ray line emission, we consider the instrumental background and X-ray continuum contributions.
There are several potential mechanisms that could produce X-ray continuum emission at keV energies. First, there is the bremsstrahlung of fast recoil electrons that scatter from ions during their deceleration to thermal energies within the SN interior (Clayton & The, 1991). These recoil electrons are produced in Compton-scattering events with the primary gamma-ray photons of the radioactive isotopes in the ejecta. The X-ray flux due to this mechanism is most intense in the first few weeks after the explosion when the radioactive energy deposition of and decay in the expanding SN is still large and the production of fast electrons near the surface is efficient because the Compton optical depth remains high. This changes at later times when the ejecta become fully transparent to gamma rays and the production of fast electrons is no longer efficient. An extrapolation of the results of Clayton & The (1991) for the W7 model shows that the internal bremsstrahlung contribution can be completely neglected at the epochs relevant for this work.
Second, there may be X-ray emission arising from the interaction of the ejecta with the surrounding circumstellar medium (CSM). Both thermal and non-thermal emission mechanisms can contribute. Since the X-ray emission of shell-type SN remnants usually shows a dominant contribution of thermal emission processes (e.g. Ballet, 2006; Badenes, 2010), we approximate the continuum emission with a thermal bremsstrahlung model. Models assuming typical densities for the ambient medium predict that the thermal X-ray emission from the heated ejecta and ambient material does not reach its maximum luminosity until several hundred years after explosion (Badenes et al., 2003). In agreement with such models, observations generally place only upper limits of the early thermal X-ray emission of SNe Ia (e.g. Hughes et al., 2007). The intensity of the X-ray emission from CSM interaction depends on the strengths of the forward and reverse shocks that build up after the ejecta are launched. Although initially weak, the X-ray radiation in the shocked regions increases as more heated and compressed material is accumulated. To take the effects of CSM interaction into account, we adopt an analytic model of the underlying X-ray continuum emission (Immler et al., 2006; Hughes et al., 2007).
For the thermal bremsstrahlung, we use (cf. Immler et al., 2006; Fransson et al., 1996). The normalisation of the bremsstrahlung emission is given by the emission measure
| (3) |
where is the volume of the shocked and emitting material, the electron density and the ion density. Assuming a constant-density ambient medium with , which is a typical number in most of the Galaxy and the Magellanic Clouds, hydrodynamical simulations of the shock interactions result in typical emission measures of to at six years after the explosion (cf. Badenes et al., 2003). These assumptions concerning the ambient medium and the emission measure are further justified by the fact that only a rare subclass of SNe Ia shows indications for a strong interaction with their CSM (Hamuy et al., 2003; Russell & Immler, 2012; Dilday et al., 2012; Silverman et al., 2013). For this work, we perform all calculations assuming an emission measure of .
We absorb the emission line and the thermal bremsstrahlung component by a Galactic neutral hydrogen column (cf. Wilms et al., 2000) of . This value corresponds to the viewing direction of M101 (Kalberla et al., 2005) and is typical for an observation that does not point towards the Galactic disk. However, at the line energy of 5.9 keV, absorption effects are negligible for column densities below and our results therefore do not depend on the exact value of .
Next, we estimate the detectability of the 5.9 keV emission line, which we assume to be monochromatic for the purpose of this excercise. The detection significance is given by
| (4) |
with the source count rate , the background count rate , and the exposure time (Bradt, 2004). The background count rate includes instrumental background and continuum count rates.
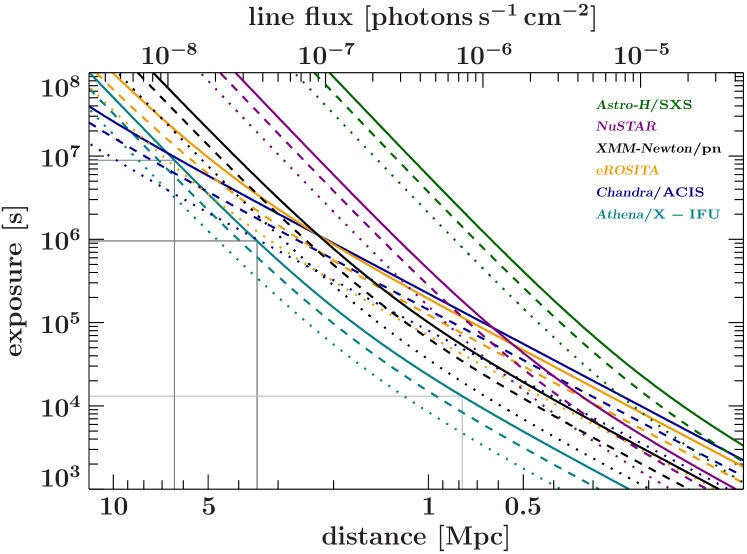
For the detector simulations, we use the effective areas, redistribution matrix functions, and background count rates of Chandra/ACIS (Chandra X-ray Center, 2012), eROSITA (Boller, 2011), XMM-Newton/pn (Read & Ponman, 2003), NuSTAR (Harrison et al., 2013), Astro-H/SXS (Astro-H Mission, 2013), and Athena/X-IFU (Athena X-ray Observatory, 2014). Fig. 2 shows the exposure times required by these six instruments to detect the line at maximum luminosity for the delayed-detonation explosion model with 3, 4, and significance as a function of the distance to the SN. The upper X-axis shows the corresponding photon flux. The distance is given under the assumption that an observation is taken at the epoch corresponding to the maximum line flux of the models ( d after the explosion). At this time, the violent-merger model has a line flux that is lower by a factor of 4.5 compared to the delayed-detonation model. Therefore the distances corresponding to a detection at a chosen significance level are shifted by a factor of . Equivalently, for a fixed distance, longer exposure times are required to detect the line with the same significance as for the delayed-detonation model.
For low line fluxes (and hence large distances), the background count rates in the detectors dominate the source flux. Due to the low instrumental background, Chandra/ACIS is the best choice of the currently operating X-ray telescopes for SNe at distances above . For the delayed-detonation model, line detection for close explosion events in the Local Group up to the Andromeda (M31) distance of is possible for all discussed instruments except Astro-H/SXS, with realistic exposure times (). For source fluxes photons s-1 cm-2, count rates are no longer background dominated and XMM-Newton/pn is the best-suited existing instrument because of its large effective area. For M31 (see Fig. 2), the large effective area of XMM-Newton/pn leads to exposure times of several 100 ks only. The realisation of the currently proposed Athena mission would significantly increase the distance limits for a line detection. With Athena, the delayed-detonation model could be detected (at ) up to distances of 5 Mpc within reasonable exposure times of .
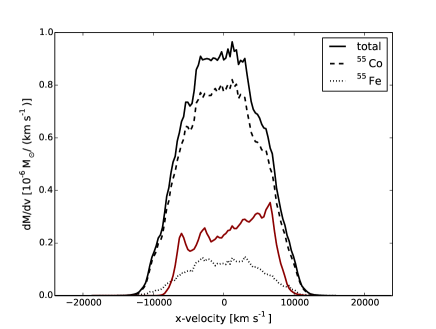
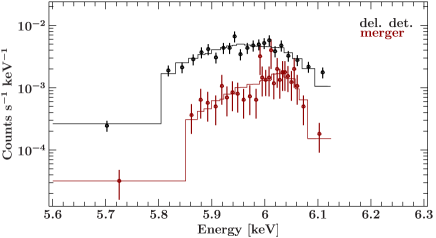
Our radiative transfer calculations take the Doppler broadening arising from the velcocity distributions of and along the line of sight (see Fig. 3) into account. We can therefore simulate line detection with Athena/X-IFU and XMM-Newton/pn in greater detail, including the broadening and shape for a fully resolved line. An example of the simulations of the proposed Athena/X-IFU detector is shown in Fig. 4, where we assume a distance of 0.78 Mpc (distance to the Andromeda Galaxy M31) and an exposure time of 500 ks. For such an exposure time, the delayed-detonation model could be detected up to a distance of 2.9 Mpc and the merger model up to a distance of 1.4 Mpc by Athena/X-IFU at the level and a clear distinction of the two models is possible. With XMM-Newton/pn, our models can both be distinguished for distances below 1.8 Mpc in case of a 500 ks exposure.
For the distance of to M82, which is the host galaxy of the recently discovered SN 2014J (Fossey et al., 2014), line detection for our models is within reach. For our delayed-detonation scenario (see Fig. 2), we estimate a better than detection with Chandra/ACIS for exposure times of . corresponds to the distance of the recently discovered SN 2011fe. A line detection for our delayed-detonation model with Chandra/ACIS would require exposure times of , which means that SN 2011fe is currently beyond the reach of X-ray telescopes.
The quantitative statements we make about the detectability of SNe Ia are of course model dependent. In particular, the assumed metallicity of the zero-age main sequence (ZAMS) progenitor has a direct effect on the production of the slightly neutron rich radionuclides and (see Table 1). The metallicity dependent yields for the N100 model are taken from Seitenzahl et al. (2013b), who approximately take the effect of ZAMS metallicity into account by making the simplyfing assumption that all metals in the ZAMS progenitor are locked up in CNO, which is efficiently converted to during H-burning and then to during core He-burning. For the merger case, we use the yields from the 1.1 + 0.9 model from Pakmor et al. (2012), which treated ZAMS metallicity in the same way.111Note that the yields for the three sub-solar metallicity cases of the merger model were determined according to a slightly updated prescription described in Kromer et al. (2013). For the merger model, the effect of the assumed ZAMS metallicity on Mn is quite pronounced, resulting in a strong suppression (by more than an order of magnitude) in the combined mass of and when going from solar to 0.01 times solar metallicity (note that SNe Ia from progenitors with such low ZAMS metallicity should be rare in the local Universe based on their predicted age from theoretical delay-time distributions). In contrast, the delayed-detonation model based on the explosion of a near-Chandrasekhar mass WD exhibits only a modest reduction of less than a factor of two with decreasing ZAMS progenitor metallicity from solar to 0.01 times solar. This qualitatively different dependence on progenitor metallicity is explained by the different nucleosynthetic processes operating. The high-density regions of the near-Chandrasekhar mass delayed-detonation model undergo significant in-situ neutronisation via electron capture processes, which explains the relatively flat dependence on pre-explosion neutron enrichment. On the other hand, the much lower peak densities of the significantly sub-Chandrasekhar mass WDs in the merger model prohibit significant neutron enrichment via in-situ electron captures, which explains the comparatively steep dependence on pre-explosion neutron enrichment and hence metallicity. But even if the variations in the abundances of and in dependence on the progenitor metallicities as given in Table 1 are taken into consideration, the differences between the two models still amount to at least a factor of two. In other words, the dimmest of our delayed-detonation models will still be more than a factor of two brighter than the brightest of our violent-merger models. In this context we point out that the Mn yields are also rather robust across many near-Chandrasekhar mass explosion models (e.g., Iwamoto et al., 1999; Seitenzahl et al., 2013b) – the variance between the different models is comparable to the variance introduced by metallicity. Furthermore, we note that in case of a specific nearby SN Ia, explosion models would be adjusted in order to reproduce the event as accurately as possible. This includes assumptions concerning the metallicity of the progenitor system that may be constrained by information about the environment of the respective host galaxy. ZAMS metallicity therefore cannot be regarded as a completely free parameter.
| model name | ||||
|---|---|---|---|---|
| N100 (del. det.) | 1.34e2 | 1.11e2 | 8.70e3 | 7.84e3 |
| 1.1_0.9 (merger) | 3.85e3 | 2.57e4 | 7.93e5 | 9.46e5 |
Note that the results of our simulations are quite robust against variations of the parameters EM, , and . Due to the fact that the thermal continuum emission at 2100 d after explosion is orders of magnitude below the line emission from the decay of , even larger variations in EM and only have marginal influences on the line detectability. Therefore, even if the emission measure was enhanced due to higher CSM densities or additional non-thermal processes, the detectability of the line would remain qualitatively unaffected in case of the major part of normal SNe that do not show strong CSM interaction at early times (cf. Silverman et al., 2013). Changes in the Doppler broadening result in slightly larger error bars for the determination of the line flux in case of higher velocities. Therefore, the 5.9 keV emission line can be regarded as a unique distinctive feature for the two introduced explosion scenarios, independent of the choice of a specific parameter set.
4 Summary
We have calculated the Mn Kα line emission for three-dimensional models of SNe Ia. As a result of different central densities at the time of freeze-out from NSE, the more abundant production of leads to a 4.5 times larger maximum line flux in the delayed detonation than in the merger model. Even taking variations due to the dependence of the yield of and on ZAMS metallicity of the progenitor into account, the signal of the delayed-detonation and the merger model remain clearly separated. Therefore, we have shown that the X-ray line provides a distinguishing feature between the observable signatures of two leading explosion scenarios of SNe Ia: a near-Chandrasekhar mass delayed detonation and a violent merger of two WDs. By performing detector simulations of several current and future X-ray instruments, we quantified the prospects for detecting the line and find that, due to very low background, Chandra/ACIS is currently the most suitable instrument for SNe at distances greater than 2 Mpc. Of the existing instruments, XMM-Newton/pn is preferable for distances below 2 Mpc because of the larger effective area. For delayed-detonation SNe Ia at distances , the proposed Athena mission holds promise for a detection of the 5.9 keV line. Our estimates for the line flux detectabilities (see Fig. 2) can be used as a reference for future SN Ia X-ray observations. Given the scarcity of SN Ia events in the local Universe and the sensitivities of current generation X-ray observatories, it is not possible to constrain the relative rates of SNe Ia from various progenitor models (e.g. Ruiter et al., 2011) with X-ray line fluxes alone. For individual, fortuitously nearby SNe, however, the prospects are better. In particular, we find that in this case a exposure of SNe in the local group (M31) would suffice to detect and distinguish our two explosion models. Observations with lower exposure times ( ks) should allow for a detection of the 5.9 keV line at a significance of in case of the delayed-detonation model. Thus, observations of the line provide an independent diagnostic tool that can be used together with measurements at UV, optical, and IR wavelengths to address the open questions of SN Ia explosion scenarios and progenitor channels.
Acknowledgements
This research has made use of a collection of ISIS scripts provided by the Dr. Karl Remeis observatory, Bamberg, Germany at http://www.sternwarte.uni-erlangen.de/isis/. We thank Matthias Kühnel for his support in calculating the Astro-H/SXS detector background count rates, Christian Schmid for his support with the Athena/X-IFU response simulations, and J. E. Davis for the development of the slxfig module that has been used to prepare some of the figures in this work. The work by KM is partly supported by the WPI Initiative, MEXT, Japan, and by the Grant-in-Aid for Scientific Research (23740141, 26800100).The hydrodynamical simulations presented here were carried out in part at the Forschungszentrum Jülich with grants PRA042 and HMU13/14 and at the Computer Centre of the Max Planck Society, Garching. We acknowledge support by the DFG via the Transregional Collaborative Research Centre TRR 33 “The Dark Universe”, the Emmy Noether Program (RO 3676/1-1), the ARCHES prize of the German Ministry of Education and Research (BMBF), the graduate school “Theoretical Astrophysics and Particle Physics” at the University of Würzburg (GRK 1147), the ARC Laureate Grant FL0992131, the Excellence Cluster EXC 153, the Helmholtz Association (HGF) through the Nuclear Astrophysics Virtual Institute (VH-VI-417), and the European Research Council (ERC-StG EXAGAL-308037). We also thank the DAAD/Go8 German-Australian exchange programme for travel support.
References
- Astro-H Mission (2013) Astro-H Mission, 2013. http://astro-h.isas.jaxa.jp/researchers/sim/response.html
- Athena X-ray Observatory (2014) Athena X-ray Observatory, 2014. http://www.the-athena-x-ray-observatory.eu/
- Badenes (2010) Badenes C., 2010, Proc. National Academy of Science, 107, 7141
- Badenes et al. (2003) Badenes C., Bravo E., Borkowski K. J., Domínguez I., 2003, ApJ, 593, 358
- Ballet (2006) Ballet J., 2006, Advances in Space Research, 37, 1902
- Bloom et al. (2012) Bloom J. S. et al., 2012, ApJL, 744, L17
- Boller (2011) Boller T., 2011, The erosita background. http://www2011.mpe.mpg.de/erosita/eROSITA_background_v8.pdf
- Bradt (2004) Bradt H., 2004, Astronomy Methods. Cambridge University Press, Cambridge, United Kingdom
- Bravo & Martínez-Pinedo (2012) Bravo E., Martínez-Pinedo G., 2012, Phys. Rev. C, 85, 055805
- Brown et al. (2012) Brown P. J. et al., 2012, ApJ, 753, 22
- Burbidge et al. (1957) Burbidge E. M., Burbidge G. R., Fowler W. A., Hoyle F., 1957, Reviews of Modern Physics, 29, 547
- Burrows & The (1990) Burrows A., The L.-S., 1990, ApJ, 360, 626
- Chandra X-ray Center (2012) Chandra X-ray Center, 2012, The chandra proposers’ observatory guide. http://cxc.cfa.harvard.edu/proposer/POG/html/index.html
- Churazov et al. (2014) Churazov E. et al., 2014, Nature, 512, 406
- Clayton (1973) Clayton D. D., 1973, Nature Physical Science, 244, 137
- Clayton et al. (1969) Clayton D. D., Colgate S. A., Fishman G. J., 1969, ApJ, 155, 75
- Clayton & The (1991) Clayton D. D., The L.-S., 1991, ApJ, 375, 221
- Diehl et al. (2014) Diehl R. et al., 2014, Science
- Dilday et al. (2012) Dilday B. et al., 2012, Science, 337, 942
- Fossey et al. (2014) Fossey J., Cooke B., Pollack G., Wilde M., Wright T., 2014, Central Bureau Electronic Telegrams, 3792, 1
- Fransson et al. (1996) Fransson C., Lundqvist P., Chevalier R. A., 1996, ApJ, 461, 993
- Hamuy et al. (2003) Hamuy M. et al., 2003, Nature, 424, 651
- Harrison et al. (2013) Harrison F. A. et al., 2013, ApJ, 770, 103
- Henke et al. (1993) Henke B. L., Gullikson E. M., Davis J. C., 1993, At. Data Nucl. Data Tables, 54, 181
- Hillebrandt et al. (2013) Hillebrandt W., Kromer M., Röpke F. K., Ruiter A. J., 2013, Frontiers of Physics, 8, 116
- Hughes et al. (2007) Hughes J. P., Chugai N., Chevalier R., Lundqvist P., Schlegel E., 2007, ApJ, 670, 1260
- Immler et al. (2006) Immler S. et al., 2006, ApJL, 648, L119
- Iwamoto et al. (1999) Iwamoto K., Brachwitz F., Nomoto K., Kishimoto N., Umeda H., Hix W. R., Thielemann F.-K., 1999, ApJS, 125, 439
- Jordan et al. (2003) Jordan G. C., Gupta S. S., Meyer B. S., 2003, Phys. Rev. C, 68, 065801
- Junde (2008) Junde H., 2008, Nuclear Data Sheets, 109, 787
- Kalberla et al. (2005) Kalberla P. M. W., Burton W. B., Hartmann D., Arnal E. M., Bajaja E., Morras R., Pöppel W. G. L., 2005, A&A, 440, 775
- Kasen (2010) Kasen D., 2010, ApJ, 708, 1025
- Kokubun et al. (2010) Kokubun M. et al., 2010, in SPIE Astronomical Telescopes+ Instrumentation, International Society for Optics and Photonics, pp. 773215–773215
- Kromer et al. (2013) Kromer M. et al., 2013, ApJL, 778, L18
- Kromer et al. (2010) Kromer M., Sim S. A., Fink M., Röpke F. K., Seitenzahl I. R., Hillebrandt W., 2010, ApJ, 719, 1067
- Lebrun et al. (2003) Lebrun F. et al., 2003, A&A, 411, L141
- Leising (2001) Leising M. D., 2001, ApJ, 563, 185
- Leising (2006) Leising M. D., 2006, ApJ, 651, 1019
- Maeda et al. (2012) Maeda K. et al., 2012, ApJ, 760, 54
- Pakmor et al. (2012) Pakmor R., Kromer M., Taubenberger S., Sim S. A., Röpke F. K., Hillebrandt W., 2012, ApJL, 747, L10
- Parikh et al. (2013) Parikh A., José J., Seitenzahl I. R., Röpke F. K., 2013, A&A, 557, A3
- Patat et al. (2007) Patat F. et al., 2007, Science, 317, 924
- Perlmutter et al. (1999) Perlmutter S. et al., 1999, ApJ, 517, 565
- Read & Ponman (2003) Read A. M., Ponman T. J., 2003, A&A, 409, 395
- Riess et al. (1998) Riess A. G. et al., 1998, AJ, 116, 1009
- Röpke et al. (2012) Röpke F. K. et al., 2012, ApJL, 750, L19
- Ruiter et al. (2011) Ruiter A. J., Belczynski K., Sim S. A., Hillebrandt W., Fryer C. L., Fink M., Kromer M., 2011, MNRAS, 1282
- Russell & Immler (2012) Russell B. R., Immler S., 2012, ApJL, 748, L29
- Scannapieco et al. (2008) Scannapieco C., Tissera P. B., White S. D. M., Springel V., 2008, MNRAS, 389, 1137
- Schmidt et al. (1998) Schmidt B. P. et al., 1998, ApJ, 507, 46
- Seitenzahl (2011) Seitenzahl I., 2011, Prog. Part. Nucl. Phys., 66, 329
- Seitenzahl et al. (2013a) Seitenzahl I. R., Cescutti G., Röpke F. K., Ruiter A. J., Pakmor R., 2013a, A&A, 559, L5
- Seitenzahl et al. (2013b) Seitenzahl I. R. et al., 2013b, MNRAS, 429, 1156
- Seitenzahl et al. (2014) Seitenzahl I. R. et al., 2014, MNRAS, 444, 350
- Seitenzahl et al. (2009) Seitenzahl I. R., Taubenberger S., Sim S. A., 2009, MNRAS, 400, 531
- Silverman et al. (2013) Silverman J. M. et al., 2013, ApJS, 207, 3
- Sim & Mazzali (2008) Sim S. A., Mazzali P. A., 2008, MNRAS, 385, 1681
- Sim et al. (2013) Sim S. A. et al., 2013, MNRAS, 436, 333
- Sternberg et al. (2011) Sternberg A. et al., 2011, Science, 333, 856
- Summa et al. (2013) Summa A. et al., 2013, A&A, 554, A67
- The et al. (1994) The L.-S., Bridgman W. T., Clayton D. D., 1994, ApJS, 93, 531
- The & Burrows (2014) The L.-S., Burrows A., 2014, ApJ, 786, 141
- Thielemann et al. (1986) Thielemann F.-K., Nomoto K., Yokoi K., 1986, A&A, 158, 17
- Truran et al. (1967) Truran J. W., Arnett W. D., Cameron A. G. W., 1967, Canadian J. Phys., 45, 2315
- Wilms et al. (2000) Wilms J., Allen A., McCray R., 2000, ApJ, 542, 914
- Woosley et al. (1973) Woosley S. E., Arnett W. D., Clayton D. D., 1973, ApJS, 26, 231