Monte-Carlo Simulation of J1 League Postseason System from the 2015 Season
Abstract
In this paper, the new two stage and postseason system of J1 League, the top division of professional football in Japan, is simulated. Official regulation defines that the new postseason from the 2015 season consists of five teams selected by different principles — the top three teams by total season points, and the winning teams of the 1st and 2nd half of the season.
This paper clarifies that there are overlaps within these five teams and the average number of teams reaching the postseason is about 3.5. The probability that the postseason is held with 3, 4, and 5 teams are estimated about 0.62, 0.35, and 0.03, respectively.
From this result, this paper concludes that the new system of J1 League is basically a one-stage system, whereas the new system is officially defined as a two-stage system, due to inappropriate design of the postseason.
1 Introduction
J1 League, the top professional division of football in Japan, will adopt a new two-stage system with a postseason system from the 2015 season. The postseason system consists of two different stages. The (tentative) names are “Super Stage” and “J League Championship”[1].
Since its opening in 1993 till 2004, the J1 League has had a system of two stages along with a chapmionship game. From the 2005 season, the J1 League has adopted a simple double round-robin system like European major football leagues such as Premier League (England), Bundesliga (Germany), Serie A (Italy), Liga Española (Spain), and so on. Some European football leagues such as Jupiler Pro League (Belgium) and Scottish Premiership (Scotland) have a postseason system called the “split system”[2][3], but these are considered exceptional cases in UEFA111Union des Associations Europeennes de Football .
The double round-robin principle is the most simple and fair system, however, J1 League has decided to change the system due to decreased sales and profit[4].
Kazumi Ohigashi, the fourth Chairman of J League, said: “It is obvious that football in Japan has shown big progess and has been dramatically growing as a major sport in the last two decades. Japanese players also have shown big progress. Some Japanese play in top-level clubs in the world. This is an amazing fact.”
“However, money and good players are attracted to the five major European football leagues (England, Spain, Italy, Germany, and France). This is called the straw effect, and it refers to football leagues in other countries declining as playsers and money move to the major leagues; This s now occurring all over the world.”
“J League income peaked at 12.8 billion yen in 2008, but decreased by 0.93 billion yen to 11.9 billion yen by 2012. If this continues, income is expected to decline by another 1 billion yen by 2014.” (translated by the authors)
Most professional sports league in the USA, such as NFL222National Football League, MLB333Major League Baseball, NBA444National Basketball Association, and NHL555National Hockey League, have adopted postseason system. These postseason systems are designed to get much attention, and these postseason games produce much profit. NPB666Nippon Professional Baseball, the top professional baseball league in Japan, has adopted a postseason system since 2007, which has seen some commercial success. Following these successful examples, J1 League aims to increase its income by introducing the new postseason system.
The most fundamental difference between the new postseason system of J1 League and that of others is that there is possibly an overlap in the teams which have the right to reach the postseason. No substitution teams are selected even if there is any overlap, and therefore, the number of teams and games in the postseason may be different every year, although the number of games is an important factor for income from box office sales and broadcast rights sales.
The objective of this paper is to simulate the new postseason system using a Monte-Carlo simulation to calculate the possibility of overlap.
2 J1 League’s new postseason system
This section introduces the new postseason system. The following explanation is based on the official press release in 2014/2/25[1].
-
•
Regular season
-
–
Ragular season consists of two stages by 18 clubs. Each stage is named as “1st stage” and “2nd stage.”
-
–
Each stage is single round-robin competition. Home and away games are placed on either stage. As a result, each team has 17 matches in one stage with 8 or 9 home games.
-
–
Standings for each stage are based on the sum in points of each game. The point system is the usual 3-1-0 (Win-Draw-Lose) system.
-
–
-
•
Super Stage (tentative name)
-
–
The Super Stage is a knockout tournament of four teams. The following four teams reach the Super Stage.
-
*
Winning teams of the 1st and 2nd stages.
-
*
The teams ranked 2nd and 3rd in terms of total points over the two stages.
The stage winning teams are denoted by W1 and W2 based on their total points over both stages, not based on the stage number. Similarly, the latter teams are denoted by Y2 and Y3.
-
*
-
–
Without any overlaps (defined below), match-ups in the first round are W1 and Y3, and W2 and Y2. The game is held in the hometown of the stage-winning team.
-
–
The winners of the first round reach the second round, and the winner of the second round (a single-game contest) is the winner of the Super Stage. This team reaches the Championship.
-
–
Overlap resolution
-
*
If Y1 (defined below) overlaps with W1, Y1 reaches the Championship and does not play in the Super Stage. There is no subsutitution for W1. In this case, the match-up of the first stage is between Y2 and Y3. W2 is seeded and clears the first round.
-
*
If either of W1 or W2 overlaps with Y2 or Y3, the team is seeded and clears the first round.
-
*
If both W1 and W2 overlap Y2 and Y3, no first round is held and only the second-round match between W1(Y2) and W2(Y3) is held.
-
*
If a stage-winning team is ranked from 16th to 18th in terms of total points over the two stages, the team does not reach the Super Stage777This condition is ignored in order to simplify the discussion. .
-
*
-
–
-
•
J League Championship (tentative name)
-
–
The team ranked 1st in terms of total points ovet the two stages, that is, over 34 matches, reaches the J League Championship. This team is denoted as Y1.
-
–
Y1 and the winner of the Super Stage play fot the Championship. The Championship consists of two games, one each in the hometowns of both teams.
-
–
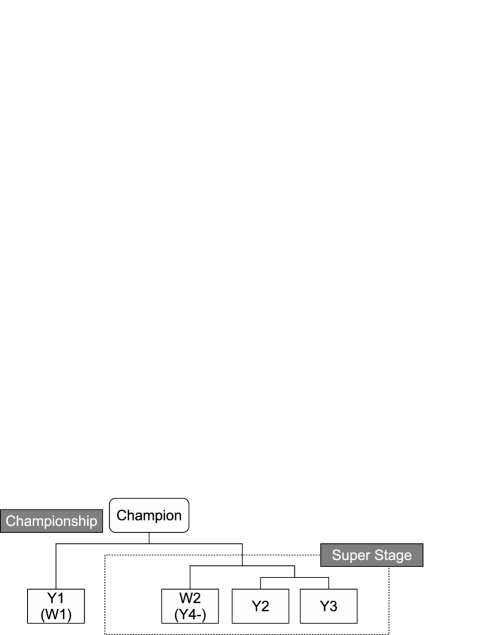
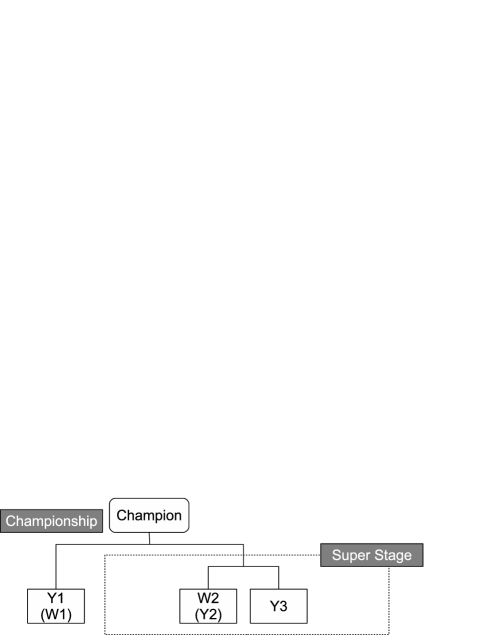
Figure 1 shows the postseason tournament if five teams reach the postseason. There are 8 possible cases of overlap (listed in Table 1), and the number of teams reaching the postseason may vary from three to five. Figures 2 to 9 show the tournament for each cases. “Y4-” means that the stage-winning team is ranked 4th or lower in terms of the total points.
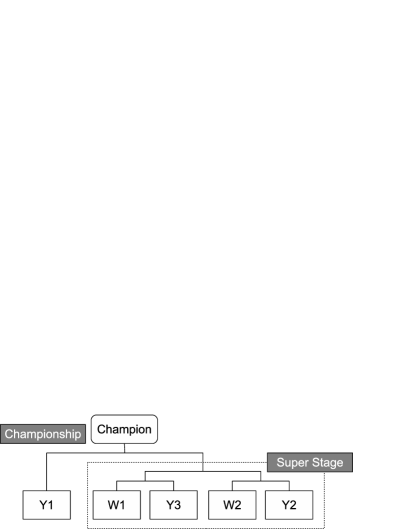
| case # | overlap(s) | teams |
|---|---|---|
| 1 | null | 5 |
| 2 | (Y3, W1) | 4 |
| 3 | (Y2, W1) | 4 |
| 4 | (Y2, W1), (Y3, W2) | 3 |
| 5 | (Y1, W1) | 4 |
| 6 | (Y1, W1), (Y3, W2) | 3 |
| 7 | (Y1, W1), (Y2, W2) | 3 |
| 8 | (Y1, W1), (Y1, W2) | 3 |


3 Simulation Results
Intuitively, the stage-winning teams would rank high in terms of total points, and vice versa. The objective of this paper is to simulate the new postseason decision system using Monte-Carlo simulation to calculate the possibility of an overlap.
3.1 Notations
The notations used in this paper are summarized below.
-
•
and denote the -th and -th teams, respectively.
-
•
denotes the average number of goals per game.
-
•
denotes the average number of goals per game by team .
-
•
denotes the average number of goals per game against team .
-
•
and denote the number average of goals per game by team in home and away games, respectively. and are similarly defined.
-
•
is a random variable that shows the number of goals by team in one game.
-
•
is a Poisson distribution with mean .
3.2 Game model
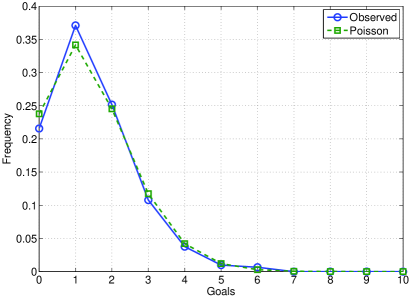
It is well known that the number of goals in one football game follows a Poisson distribution[5]. Figure 10 shows the histogram of goals per game in the 2013 J1 League and the probability function of a Poisson distribution with the actual average as the mean.
In this paper, the following models of the game are used.
-
•
M1: is determined by in all games. In other words,
(1) Further, suppose that the number of goals by the home and away teams are independent of each other:
(2) In other words, every team has the same offensive and defensive skills.
-
•
M2: is determined by for all opponents. In other words,
(3) Further, suppose that the number of goals by the home and away teams are independent of each other:
(4) In other words, every team has different offensive skills, but the same defensive skills.
-
•
M3: When plays against , is determined by .
(5) (6) Further, suppose that the number of goals by the home and away teams are independent of each other:
(7) In this model, the offense and the defense skills are reflected.
-
•
M4: When plays against in ’s hometown, is determined by
.
(8) (9) Further, suppose that the number of goals by the home and away teams are independent of each other:
(10) In this model, not only the offense and the defense skills but also the home and away status are reflected.
-
•
M5: Average of goals of against is estimated from the results of the past games.
-
–
From the past results, team scored goals againt is added to detabase as .
-
–
The axes of and are partitioned with interval . Average of the number of goals are calculated for each partition. If there are less than 30 games in one partition, they are discarded as outlier.
-
–
Regression coefficients of the following regression model are estimated by least square method.
(11)
Based on the regression model, when plays against , is determined by .
(12) Further, suppose that the number of goals by the home and away teams are independent of each other:
(13) -
–
The paremeters , , and so on are taken from J1 League statistics.
3.3 Simulation result
For each model, seasons are simulated and the number of overlap cases is counted. In M5, the regression alanysis is performed based on the results of 2010—2013 seasons. . Tables 2 and 3 show the results.
| Teams | M1 | M2 | M3 | M4 | M5 | case # |
| 3 | 0.4320 | 0.5912 | 0.5195 | 0.5676 | 0.6173 | 4, 6, 7, 8 |
| 4 | 0.4876 | 0.3740 | 0.4282 | 0.3916 | 0.3519 | 2, 3, 5 |
| 5 | 0.0804 | 0.0348 | 0.0522 | 0.0408 | 0.0309 | 1 |
| mean | 3.6485 | 3.4466 | 3.5327 | 3.4372 | 3.4134 |
| Teams | M1 | M2 | M3 | M4 | M5 | case # |
|---|---|---|---|---|---|---|
| 5 | 0.0804 | 0.0348 | 0.0522 | 0.0408 | 0.0309 | 1 |
| 4 | 0.0754 | 0.0496 | 0.0606 | 0.0527 | 0.0459 | 2 |
| 4 | 0.1205 | 0.0865 | 0.1016 | 0.0898 | 0.0809 | 3 |
| 3 | 0.0530 | 0.0549 | 0.0539 | 0.0513 | 0.0550 | 4 |
| 4 | 0.2917 | 0.2379 | 0.2660 | 0.2491 | 0.2251 | 5 |
| 3 | 0.1168 | 0.1399 | 0.1328 | 0.1353 | 0.1448 | 6 |
| 3 | 0.2063 | 0.2766 | 0.2445 | 0.2639 | 0.2864 | 7 |
| 3 | 0.0559 | 0.1198 | 0.0873 | 0.1172 | 0.1311 | 8 |
3.4 Discussion
Table 2 shows that a postseason with the maximum of five teams will be held only once about every 10 to 30 years.
For every model, the simulated total points are
-
•
less than the real values for the teams ranked high, and
-
•
more than the real values for the teams ranked low.
For instance, Figure 11 shows the simulated points obtained by models M2 to M4 for the winning team in the 2013 season with 63 points.
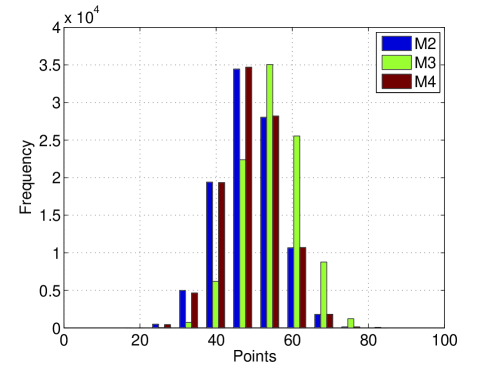
The averages are and by each model, respectively: these are less then the actual score by 10 to 15 points. This is a straightforward result expected from the calculation rule of average goals for (and goals against) in each model. It can and should be modified in the future. These models, however, lead the points distribution in a narrow range. Therefore, a model close to the real dynamics may lead more overlaps.
M5 improves this point. Table 4 shows actual points (Pts), mean of simulated points (Mean) Cerror (Err) Cstandard deviation (Std), and normalized error (Err/Std). The actual points of 16 out of 18 teams are within simulated . This model fails prediction for the rest 2 teams by the regression analysis because there are few similar teams in terms of the goals for and against in the past results. However, similar to M2 to M4, M5 also leads the points distribution in a narrow range. Therefore, a model close to the real dynamics may lead more overlaps.
| Standing | Pts | Mean | Err | Std | Err/Std |
| 1 | 63 | 60.86 | 7.32 | ||
| 2 | 62 | 58.22 | 7.37 | ||
| 3 | 60 | 54.64 | 7.67 | ||
| 4 | 59 | 59.92 | 0.92 | 7.39 | 0.124 |
| 5 | 59 | 51.28 | 7.63 | ||
| 6 | 58 | 52.24 | 7.71 | ||
| 7 | 55 | 50.41 | 7.53 | ||
| 8 | 54 | 54.86 | 0.86 | 7.63 | 0.112 |
| 9 | 50 | 41.67 | 7.47 | ||
| 10 | 48 | 45.16 | 7.63 | ||
| 11 | 47 | 46.12 | 7.52 | ||
| 12 | 46 | 41.85 | 7.55 | ||
| 13 | 45 | 48.65 | 3.65 | 7.41 | 0.492 |
| 14 | 45 | 44.90 | 7.47 | ||
| 15 | 37 | 39.43 | 2.43 | 7.10 | 0.342 |
| 16 | 25 | 30.72 | 5.72 | 6.90 | 0.828 |
| 17 | 23 | 37.37 | 14.37 | 7.22 | 1.990 |
| 18 | 14 | 26.62 | 12.62 | 6.55 | 1.926 |
The official definition of Super Stage states the following:
The Super Stage is a knockout tournament of four teams. The following four teams reach the Super Stage.
- •
Winning teams of the 1st and 2nd stages.
- •
The teams ranked 2nd and 3rd in terms of total points over the two stages.
This definition does not properly reflect the facts of high probability of overlap. Practically, this postseason is basically by Y1, Y2 and Y3. If a stage-winning team is (unfortunately) ranked 4th or lower can reach the postseason as a repechage team. This paper proposes the following (proper) definition of the postseason. Note that this definition proposes only proper explanation but not proposes proper design of postseason system.
Definition of the postseason of J1 League from 2015 season
-
•
Regular season
-
–
Ragular season consists of two stages by 18 clubs. Each stage is named as “1st stage” and “2nd stage.”
-
–
Each stage is single round-robin competition. Home and away games are placed on either stage. As a result, each team has 17 matches in one stage with 8 or 9 home games.
-
–
Standings for each stage are based on the sum in points of each game. The point system is the usual 3-1-0 (Win-Draw-Lose) system.
-
–
-
•
Postseason
-
–
The final of the postseason tournament is called “Championship”, and the rest is “Super Stage”.
-
–
The teams ranked 1st, 2nd, and 3rd in terms of total points over the two stages reach the postseason tournament. They are denoted as Y1, Y2, and Y3. Y1 is seeded to the Championship. Y2 and Y3 play in the Super Stage. The winner of the Super Stage reaches the Championship (Fig. 12).

Figure 12: Basic format of postseason -
–
If a stage-winning team is ranked 4th or lower (denoted as Y4-) can reach the postseason. The stage-winning teams are denoted by W1 and W2 based on their total points over both stages, not based on the stage number.
-
*
If W1 is in Y1 to Y3 and W2 is in Y4-, W2 reaches the first round.
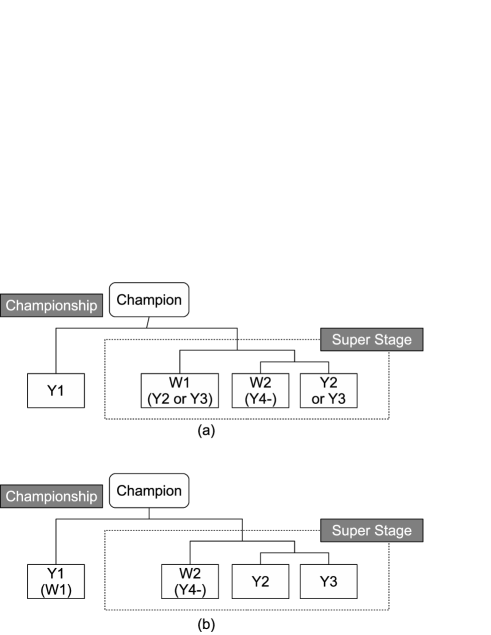
Figure 13: One stage winner reaches postseason as repechage -
*
If both W1 and W2 is in Y4-, they reach the postseason. The first round matches are Y2 v. W2, and Y3v. W1 (Fig. 14).

Figure 14: Two stage winners reach postseason as repechage
-
*
-
–
This definition is much simpler than the official one. And this definition clarifies that the new season system from 2015 leads a one-stage regular season with the postseason tournament, whereas the new system is officially defined as a two-stage system, due to inappropriate design of the postseason.
4 Conclusion
From these reuslts, it can be concluded that the new J1 postseason system from the 2015 season has inherent overlaps. In addition, it is clarified that the new sytem is basically a one-stage system with the postseason tournament, and it lowers the prestige of winning the 1st and 2nd stages because these teams would appear postseason as repechage teams. Given the above, it would be interesting to see whether the new league competition setup succeeds in attracting increasing attention thereby raising sales and profits.
In the future, we intend to develop a more accurate game model and calculate the overlap probability.
References
-
[1]
J League.
Press release.
http://www.j-league.or.jp/release/000/00005661.html (in Japanese), Feb. 2014. accessed in 11/24/2014. -
[2]
Jupiler Pro League.
Formule de championnat.
http://www.sport.be/fr/jupilerproleague/competitieformule/ (in French), 2014. accessed in 11/18/2014. -
[3]
Scottish Professional Football League.
The rules of the Scottish Professional Football League.
http://spfl.co.uk/docs/067_324__therulesofthescottishprofessionalfootball
leagueasat11september2014_1411980004.pdf, Sep. 2014. accessed in 11/24/2014. -
[4]
T. Yanagisawa.
Sports Graphic Number Web 839.
http://number.bunshun.jp/articles/-/724962 (in Japanese), Oct. 2013. accessed in 11/17/2014. - [5] JohnS. Croucher. Using Statistics to Predict Scores in English Premier League Soccer. In Sergiy Butenko, Jaime Gil-Lafuente, and Panos Pardalos, editors, Economics, Management and Optimization in Sports, pages 43–57. Springer Berlin Heidelberg, 2004.