Thermodynamically Anomalous Regions and Possible New Signals of Mixed Phase Formation
K.A. Bugaev1,∗, A.I. Ivanytskyi1, D.R. Oliinychenko1,2, V.V. Sagun1, I.N. Mishustin2,3, D.H. Rischke4, L.M. Satarov2,3 and G.M. Zinovjev1
1Bogolyubov Institute for Theoretical Physics, of the National Academy of Sciences of Ukraine, Metrologichna str. 14B, Kiev 03680, Ukraine
2FIAS, Goethe-University, Ruth-Moufang Str. 1, 60438 Frankfurt upon Main, Germany
3Kurchatov Institute, Akademika Kurchatova Sqr., Moscow, 123182, Russia
4Institute for Theoretical Physics, Goethe-University, Ruth-Moufang Str. 1, 60438 Frankfurt upon Main, Germany
∗e-mail: bugaev@th.physik.uni-frankfurt.de
Abstract.
Using an advanced version of the hadron resonance gas model we have found
indications for irregularities in data for hadrons produced in
relativistic heavy-ion collisions. These include
an abrupt change of the effective number of degrees of freedom,
a change of the slope of the ratio of lambda hyperons to protons
at laboratory energies 8.6–11.6 AGeV, as well as highly correlated
plateaus in the collision-energy dependence of the entropy per baryon, total pion
number per baryon, and thermal pion number per baryon at
laboratory energies 6.9–11.6 AGeV. Also, we observe a sharp
peak in the dimensionless trace anomaly at a laboratory energy
of 11.6 AGeV.
On the basis of the generalized shock-adiabat model we demonstrate that these observations
give evidence for the anomalous thermodynamic properties of the mixed phase
at its boundary to the quark-gluon plasma.
We argue that the trace-anomaly peak and the local minimum of the
generalized specific volume observed at
a laboratory energy of 11.6 AGeV
provide a signal for the formation of a mixed phase
between the quark-gluon plasma and the hadron phase.
This naturally explains the change of slope in the
energy dependence of the yield of
lambda hyperons per proton at a laboratory energy of 8.6 GeV.
25.75.Nq Quark deconfinement, quark-gluon plasma production, and phase transitions
25.75.-q Relativistic heavy-ion collisions
25.75.Dw Particle and resonance production
I Introduction
During almost thirty years of searching for the quark-gluon plasma (QGP) in heavy-ion collisions many different signals of its formation have been suggested. Among them are some remarkable irregularities in excitation functions of experimental data, known in the literature as the Kink Kink , the Strangeness Horn Horn , and the Step Step . Although these irregularities are often advocated as signals of the onset of deconfinement Gazd_rev:10 , their relation to the QGP-hadron mixed phase is far from being clear. Therefore, additional and independent justification of these irregularities is required. This task is rather important in view of the planned heavy-ion collision experiments at JINR-NICA and GSI-FAIR. Clearly, searching for other irregularities and signals of mixed-phase formation is no less significant, but until recently such efforts were not very successful, since they require a realistic model which is able to accurately describe the existing experimental data and, thus, provide us with reliable information about the late stages of the heavy-ion collision process.
The recent extensions Oliinychenko:12 ; KAB:13 ; KAB:gs ; NICAWP of the hadron resonance gas model KABCleymans:93 ; KABCleymansFO ; PBM:99 ; KABpbm:02 ; KABAndronic:05 ; KABAndronic:09 provide us with the most successful description of available hadronic multiplicities measured in heavy-ion collisions at AGS, SPS, and RHIC energies. The global values of and have been achieved, respectively, in Refs. KAB:13 and KAB:gs for 111 independent multiplicity ratios measured at 14 values of the center-of-mass energy 2.7, 3.3, 3.8, 4.3, 4.9, 6.3, 7.6, 8.8, 9.2, 12, 17, 62.4, 130, 200 GeV (for more details, see Ref. KAB:13 ; KAB:gs ). This gives us confidence that the irregularities found in the narrow range of collision energies GeV are not artifacts of the model and indeed reflect reality.
However, the most difficult part of establishing a signal of mixed-phase formation is to formulate a convincing model of the heavy-ion collision process, which allows to connect the irregularity in the behavior of some observable with the occurrence of the QGP-hadron phase transition. Here we report such irregularities as an abrupt change of the effective number of degrees of freedom and a peak of the trace anomaly , which are seen at GeV, and plateaus in the collision-energy dependence of the entropy per baryon, total pion number per baryon, and thermal pion number per baryon found at laboratory energies 6.9–11.6 AGeV ( GeV). We observe all these irregularities at the stage of chemical freeze-out (FO) using the most successful version of the hadron resonance gas model Oliinychenko:12 ; KAB:13 ; KAB:gs ; NICAWP . However, in order to relate them to the QGP-hadron phase transition we employ the model of the generalized shock adiabats for central nuclear collisions KAB:89a ; KAB:90 ; KAB:91 , which predicted such plateaus a long time ago.
Surprisingly, at chemical FO we also observe a second set of plateaus at higher laboratory energies 30–44 GeV ( GeV), where the generalized shock-adiabat model is no longer reliable, but which is exactly the region where the onset of deconfinement is claimed to exist Kink ; Horn ; Step ; Gazd_rev:10 ; RafLet . On the one hand, this fact demonstrates that despite the large error bars the performed analysis of the entropy per baryon, total pion number per baryon, and thermal pion number per baryon extracted from the data at chemical FO is able to detect hidden correlations between the plateaus in these quantities. On the other hand, if the plateaus at laboratory energies 30–44 GeV are also generated by a mixed-phase instability, as it is the case for the set of plateaus found at lower collision energies, then this may provide evidence for a second phase transition.
In addition, here we not only discuss the physical origin of novel signals of mixed-phase formation such as the minimum of the generalized specific volume and the sharp peak of the trace anomaly, we also relate them to the observed plato in the number of thermal pions per baryon.
This work is organized as follows. In the next section we report various irregularities existing at chemical FO. In order to provide a possible interpretation, in section 3 we present a short discussion of the generalized shock model and the possible origin of the above mentioned plateaus in the entropy per baryon, the total pion number per baryon, and the thermal pion number per baryon. We also present the details of extracting the parameters of the plateaus from the data and from the chemical FO quantities. Section 4 is devoted to a justification of new signals of QGP-hadron mixed-phase formation, while our conclusions are summarized in section 5.
II Novel Irregularities At Chemical FO
In order to elucidate the irregularities at chemical FO we employ a multicomponent hadron resonance gas model (HRGM) Oliinychenko:12 ; KAB:13 which currently provides the best description of the observed hadronic multiplicities. Hadron interactions are taken into account via hard-core repulsion, with different hard-core radii for pions, , kaons, , other mesons, , and baryons, . The best global fit of all hadronic multiplicities was found for = 0.2 fm, = 0.4 fm, = 0.1 fm, and = 0.38 fm KAB:13 . More details about the HRGM can be found in Refs. Oliinychenko:12 ; KAB:13 ; KAB:gs ; NICAWP .
In the HRGM the full chemical potential of the -th hadron species, , is expressed in terms of the corresponding charges and their chemical potentials. For each collision energy the fit parameters are the temperature , the baryonic chemical potential , and the chemical potential of the third component of isospin , whereas the strange chemical potential is found from the condition of vanishing strangeness.
Another important feature of the employed HRGM is that the width of all hadron resonances is taken into account. A thorough discussion of its role can be found in Ref. NICAWP . As usual, the effect of the resonance decay on the final hadron multiplicity is taken into account as , where = 1 for the sake of convenience. The masses, the widths, and the strong-decay branchings of all experimentally known hadrons were taken from the particle tables used by THERMUS THERMUS .
In this work we use the data set of Ref. KAB:13 . At AGS energies ( GeV or GeV per nucleon) the available data have a good energy resolution. However, for the beam energies 2, 4, 6, and 8 GeV per nucleon only a few data points are available. They correspond to the yields for pions AGS_pi1 ; AGSpi2 , for protons AGS_p1 ; AGS_p2 , and for kaons AGSpi2 (except for 2 GeV per nucleon). –integrated data are also available for hyperons AGS_L and for hyperons (for 6 GeV per nucleon only) AGS_Kas . However, as it was argued in Ref. KABAndronic:05 , the data for and should be recalculated for midrapidity. Therefore, instead of raw experimental data we used the corrected values from Ref. KABAndronic:05 . Furthermore, we analyzed the data set at the highest AGS energy AGS_p1 ; AGSpi2 ; AGS_L2 ( GeV or GeV per nucleon). Similarly to Ref. KAB:13 , here we analyzed only the NA49 mid-rapidity data KABNA49:17a ; KABNA49:17b ; KABNA49:17Ha ; KABNA49:17Hb ; KABNA49:17Hc ; KABNA49:17phi , being the most difficult ones to reproduce. Since RHIC high-energy data of different collaborations agree well with each other, we analyzed the STAR results for GeV KABstar:9.2 , GeV KABstar:62a , GeV KABstar:130a ; KABstar:130b ; KABstar:130c ; KABstar:200a , and 200 GeV KABstar:200a ; KABstar:200b ; KABstar:200c .
These experimental data were chosen because of their completeness and consistency. The fit criterion is a minimization of , where and are, respectively, theoretical and experimental values of particle-yield ratios, stands for the corresponding experimental error, and a summation is performed over all independent experimental ratios. For an extended discussion of the independent hadron-multiplicity ratios see Refs. KAB:13 ; KABAndronic:05 .
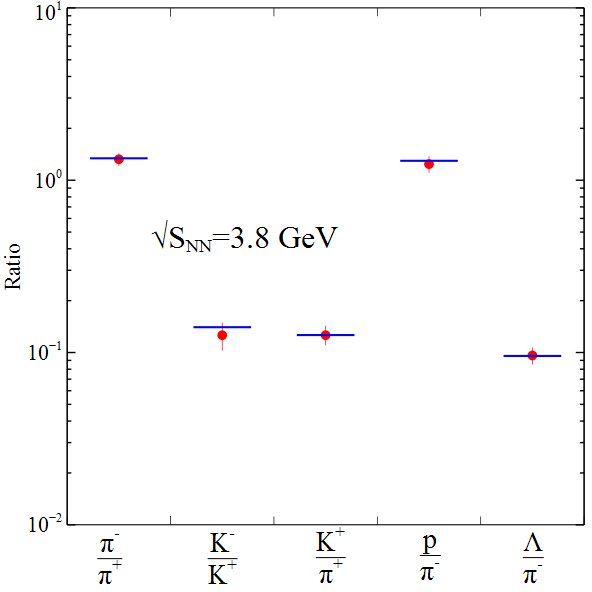
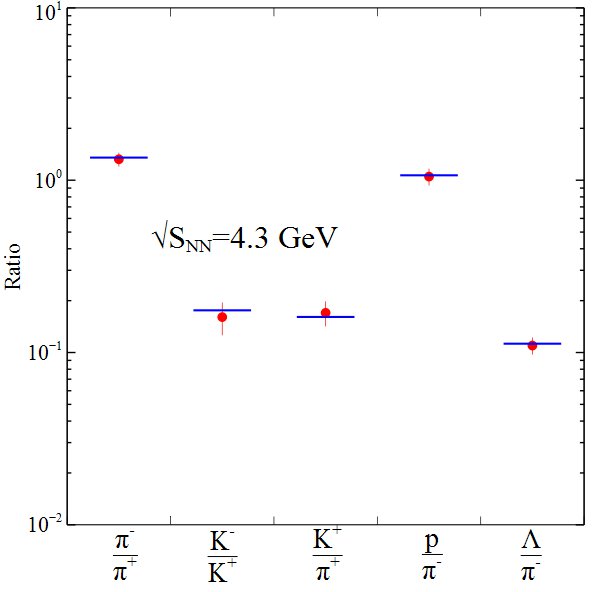
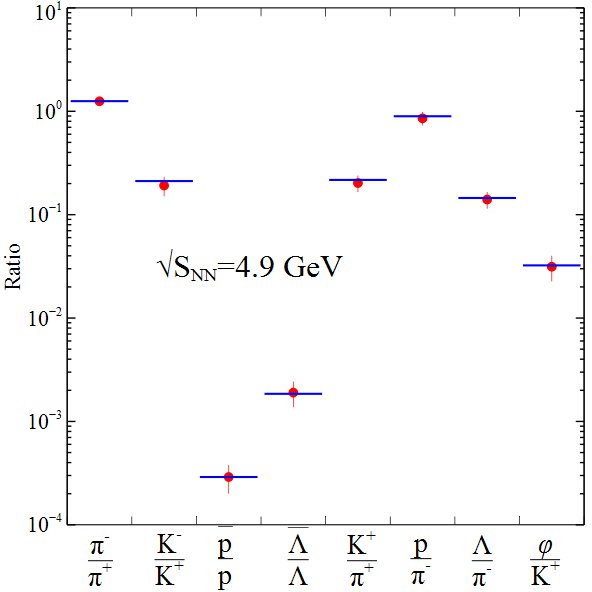
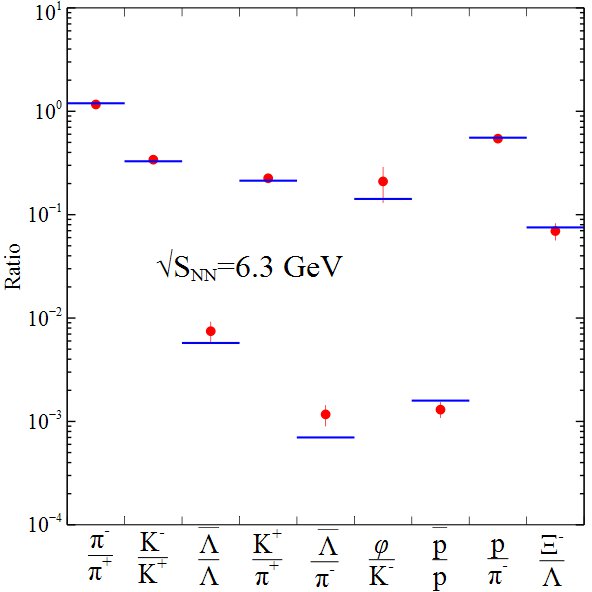
Within the present HRGM, a global value of KAB:13 is obtained for 111 independent multiplicity ratios measured at AGS, SPS, and RHIC, at the 14 values of collision energy specified above. Some results are shown in Figs. 1 and 2. As one can see from these figures, AGS and SPS data are described with very high quality and, hence, using the fit parameters found we were able to extract all thermodynamic quantities at chemical FO.
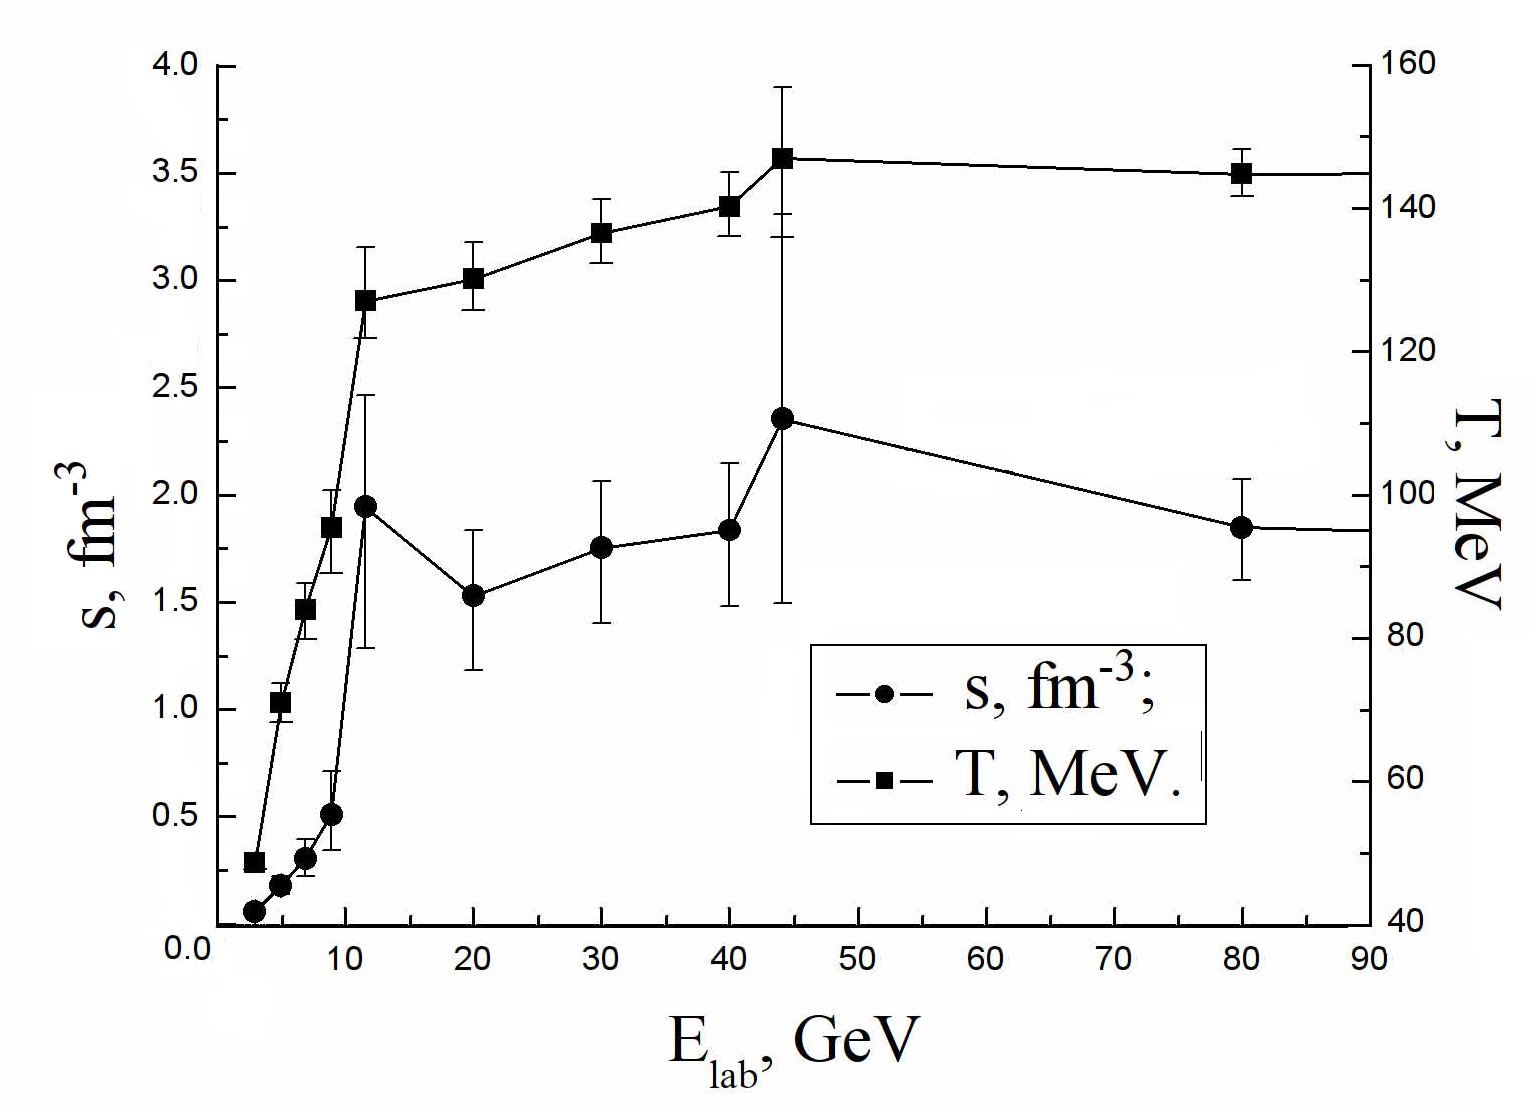
The most remarkable results are depicted in Figs. 3, 4, and 5. From Fig. 3 one can see that the entropy density increases by a factor of four in a range of laboratory energies per nucleon GeV. At the same time, the chemical FO temperature changes from 95 to 127 MeV and the baryonic chemical potential drops only from 586 to 531 MeV. In other words, for a 30% increase in the laboratory energy the ratio increases by 70%. A similar change can be seen in the effective number of degrees of freedom in the same energy range, cf. Fig. 4 for the chemical FO pressure in units of . Note that a similar (and somewhat stronger) rapid change in the number of effective degrees of freedom is observed in the most recent (former) version of the hadron resonance gas model KAB:gs ; NICAWP (Oliinychenko:12 ; KABAndronic:05 ).
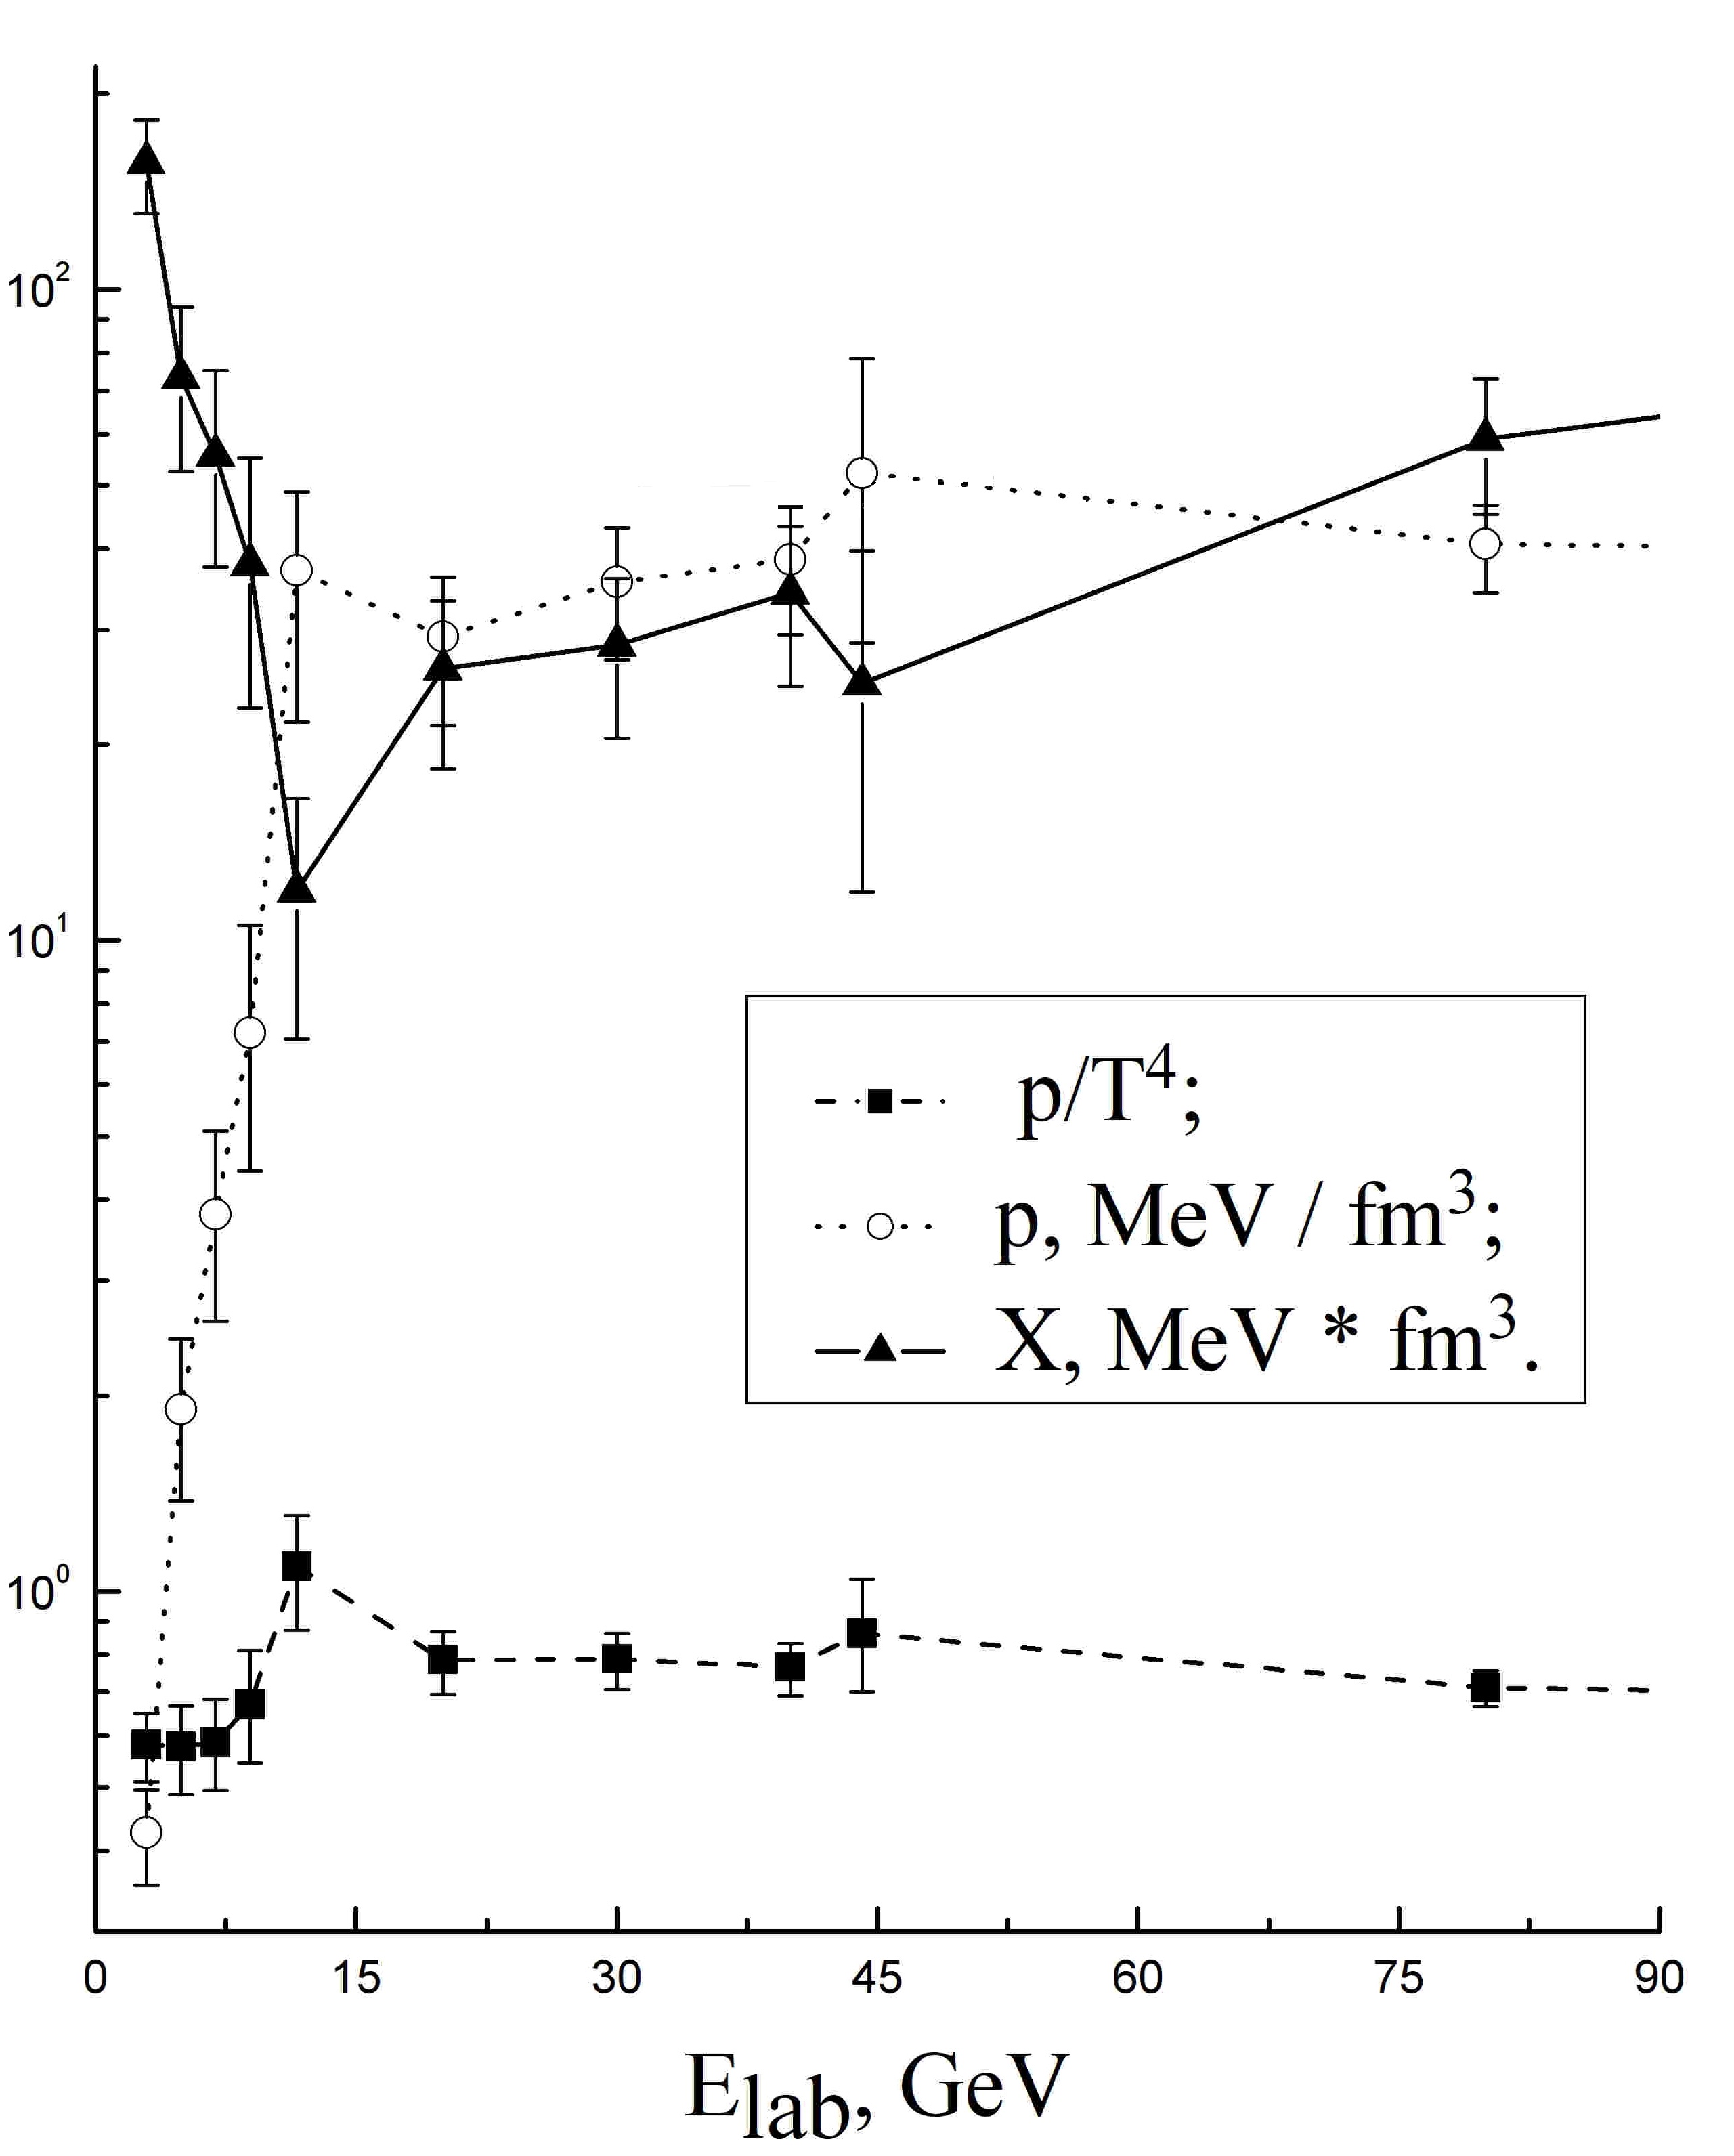
As one can see from Fig. 4, at chemical FO a dramatic change is experienced by the so-called generalized specific volume , where is the energy density, the pressure, and the baryonic charge density. It is remarkable that in all known examples of equations of state (EOS) describing the QGP-hadron transition a local minimum in the energy dependence of the values of matter described by the shock or generalized shock model is observed right at the transition to the QGP, independently of whether this is a first-order phase transition KAB:89a ; KAB:90 ; KAB:91 ; KAB:89 or a strong cross-over KAB:89a ; KAB:89 . Therefore, below we would like to reanalyze the generalized shock-adiabat model developed in Refs. KAB:89a ; KAB:90 ; KAB:91 ; KAB:89 ; KAB:89b in order to interpret the above irregularities and to verify the other signals of mixed-phase formation.
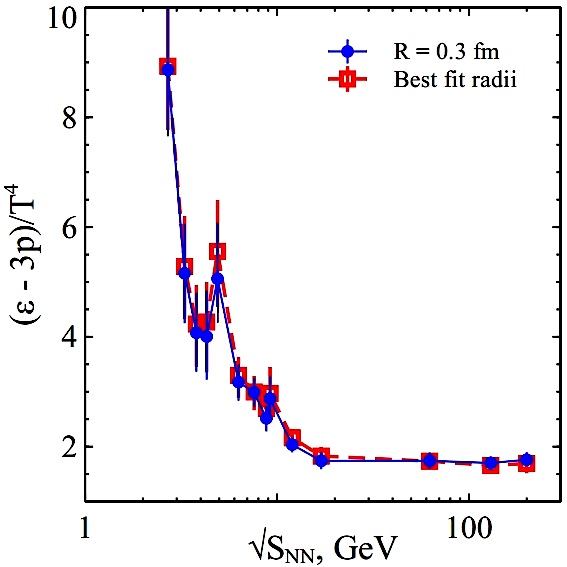
Another irregularity, the behavior of the dimensionless trace anomaly , is shown in Fig. 5. Here, one observes a peak at GeV. One could conservatively argue that this peak is produced by only one data point and that its significance should therefore be considered with caution. However, one can see that the error bars at GeV and GeV do not overlap. Thus, we are inclined to argue that this peak is indeed physical. Further measurements at various other collision energies in the immediate vicinity of GeV could lend support to our argument.
Note that the inflection point/maximum of the trace anomaly is traditionally used in lattice QCD to determine the pseudocritical temperature of the cross-over transition lQCD . Figure 5 shows that a sharp peak of the trace anomaly exists at the center-of-mass energy GeV and it is not a coincidence that it occurs right at this energy, since is directly related to the partial derivatives of the effective number of degrees of freedom as
| (1) |
Therefore, we face the intriguing possibility to relate the peak of the trace anomaly at chemical FO with its peak at the phase transition. In the next sections we will do this using the shock-adiabat model for central nuclear collisions. Also it is necessary to mention that, in order to see the peak of in Fig. 5, it is rather important to account for the non-zero width of all hadronic resonances NICAWP .
III Generalized Shock-Adiabat Model
The generalized shock-adiabat model was developed in Refs. KAB:89a ; KAB:90 ; KAB:91 ; KAB:89 ; KAB:89b to extend the compression-shock model Mish:78 ; Horst:80 ; Kamp:83 ; Horst_PR:86 ; Barz:85 to regions of matter with anomalous thermodynamic properties. Similarly to nonrelativistic hydrodynamics Landavshitz , in the relativistic case matter is thermodynamically normal, if the quantity is positive along the Poisson adiabat. Otherwise, for , the matter has thermodynamically anomalous properties. The sign of defines the type of allowed simple and shock waves: for rarefaction simple waves and compression shocks are stable. In the case of an anomalous medium, , compressional simple waves and rarefaction shocks are stable. If both signs of are possible, then a more detailed investigation of the possible flow patterns is necessary KAB:89a ; KAB:91 . In fact, all known pure phases have thermodynamically normal properties Landavshitz , whereas anomalous properties may appear at a first-order phase transition Zeldovich ; Rozhd , at its second-order critical endpoint Landavshitz , or for a fast cross-over KAB:89a .
The compression-shock model of central nuclear collisions Mish:78 ; Horst:80 ; Kamp:83 ; Horst_PR:86 ; Barz:85 allows one to determine the initial conditions for the subsequent hydrodynamic evolution. Such a picture of the collision process, which neglects the nuclear transparency, can be reasonably well justified at intermediate collision energies per nucleon GeV 20 GeV. Its validity in this region of collision energies was once more demonstrated recently Satarov:11 within the hydrodynamic model with a realistic EOS. The direct comparison of the results of the compression-shock model with those of the three-fluid model 3fluid made in Ref. Satarov:11 shows that at laboratory energies per nucleon up to 30 GeV this model can be used for quantitative estimates, while at higher energies it provides a qualitative description only. Moreover, this comparison shows that at 30 GeV transparency effects are not so strong, at least in central nucleus-nucleus collisions.
In the center-of-mass frame of the two colliding nuclei the initial state of the collision can be considered as a hydrodynamic Riemann problem of an initial discontinuity. For normal media this kind of initial discontinuity leads to an appearance of two compression shocks that move in opposite directions toward the vacuum, leaving high-density matter at rest behind the shock fronts. The thermodynamic parameters of this compressed matter are related by the Rankine-Hugoniot-Taub (RHT) adiabat Landavshitz with the parameters of uncompressed matter in the state ,
| (2) |
This equation follows from the usual hydrodynamic conservation laws of energy, momentum, and baryonic charge across the shock front. The variable is convenient, since with its help the conserved baryonic current can be expressed as , i.e., in the plane the state existing behind the shock front is given by the intersection point of the RHT adiabat (2) and the straight line with the slope known as the Raleigh line. In order to solve Eq. (2) one needs to know the EOS.
Traditionally, it is believed that the compression-shock model requires immediate thermalization. However, we would like to stress that the hydrodynamic conservation laws should be obeyed irrespectively of whether matter is in thermodynamic equilibrium or not. Moreover, the propagation of the compression shock (or a more complicated hydrodynamic solution) requires a finite formation time which in the center-of-mass frame of the collision is essentially larger than the propagation of light along the Lorentz-contracted nucleus of diameter , i.e.,
(here, is the mean nucleon mass). More accurate estimates for the time of the collision can be found in Ref. KAB:89a , but the order of magnitude of the above estimate should be correct. Hence, for GeV and for GeV one finds fm and fm, respectively, where we used fm. In other words, this formation time is rather long on the scale of the strong interaction and, hence, after this time the major part of matter formed in the central zone of the collision has a good chance to become equilibrated, even if it was initially out of equilibrium. Consequently, if only a small amount of energy dissipates during the formation time, it is reasonable to assume that the formed matter can be described by the usual hydrodynamic conservation laws for a perfect fluid Landavshitz .
In the compression-shock model the laboratory energy per nucleon is
| (3) |
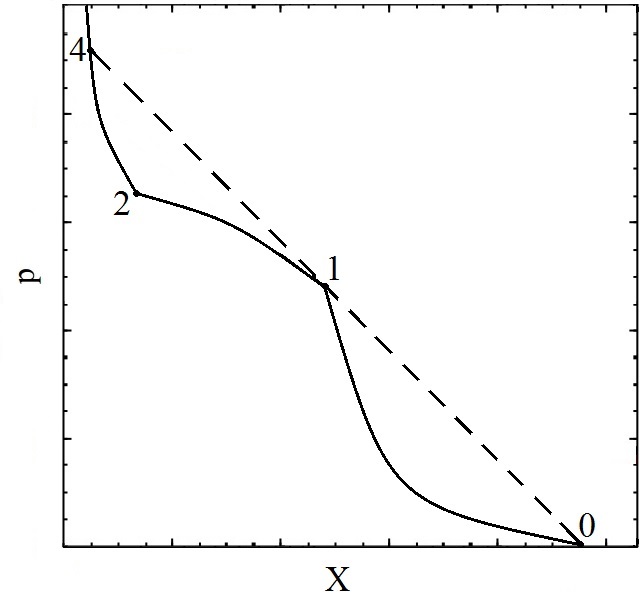
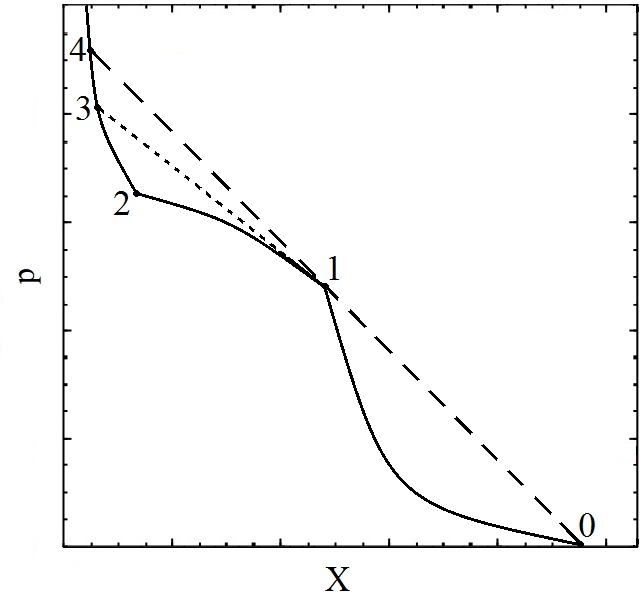
A typical example for the shock adiabat is shown in Fig. 6. As one can see from this figure the shock adiabat in the pure hadronic and QGP phases exhibits the typical (concave) behavior for a normal medium, while the mixed phase (the region 1-2) in Fig. 6 has a convex shape which is typical for matter with anomalous properties. Until now there is no complete understanding why in a phase-transition or cross-over region matter exhibits anomalous thermodynamic properties. In pure gaseous or liquid phases the interaction between the constituents at short distances is repulsive and, hence, at high densities the adiabatic compressibility of matter usually decreases for increasing pressure, i.e., . In the mixed phase there appears another possibility to compress matter: by converting the less dense phase into the more dense one. As it was found for several EOS with a first-order phase transition between hadronic gas and QGP, the phase transformation leads to an increase of the compressibility in the mixed phase at higher pressures, i.e., to anomalous thermodynamic properties. The hadronic phase of the aforementioned EOS was described by the Walecka model Walecka and by a few of its more realistic phenomenological generalizations KAB:91 ; Satarov:11 ; Zimanyi . The appearance of anomalous thermodynamic properties for a fast cross-over can be understood similarly, if one formally considers the cross-over states as a kind of mixed phase (but without sharp phase boundary), in which, however, none of the pure phases is able to completely dominate.
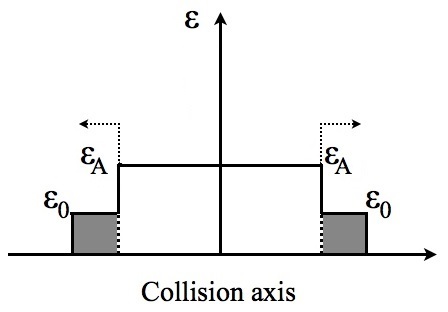
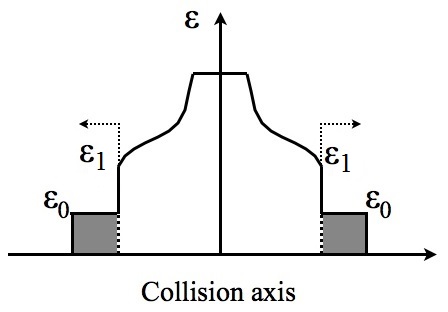
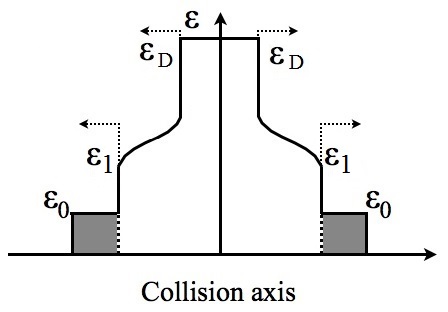
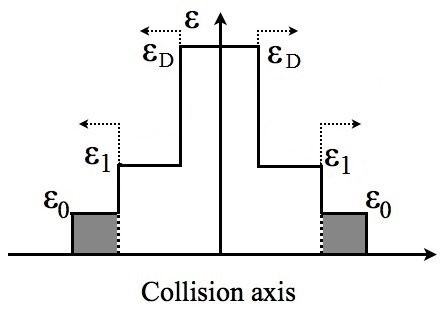
From Fig. 6 one sees that the presence of anomalous matter leads to mechanically unstable parts of the RHT adiabat (segment 1-2-3 in Fig. 6), which include states in the mixed and the QGP phases. This is a model of W-kind KAB:91 ; Satarov:11 ; Walecka and its RHT adiabat in the instability region should be replaced by the generalized shock adiabat (see Fig. 7) KAB:89a ; KAB:90 ; KAB:91 . In this case, in the region of instability 1-2-3 the shock wave has to be replaced by the following hydrodynamic solution KAB:89a of the generalized shock adiabat shown in Fig. 7: a shock between states 0 and 1 (see the upper panel of Fig. 8), followed by a compressional simple wave (see the lower panel of Fig. 8) for the segment 1-2 of the generalized shock adiabat of Fig. 7; at higher energies (segment 2-3 of the generalized shock adiabat of Fig. 7) this solution converts into two compressional shocks and a compressional simple wave moving between them shown in the upper panel of Fig. 9; at even higher energies (segment 3-4 of the generalized shock adiabat of Fig. 7) there exist two compressional shocks following one after the other KAB:89a ; Mish:78 , i.e., a double shock wave as shown in the lower panel of Fig. 9. Note that the double-shock solution was already suggested a long time ago Bethe:42 .
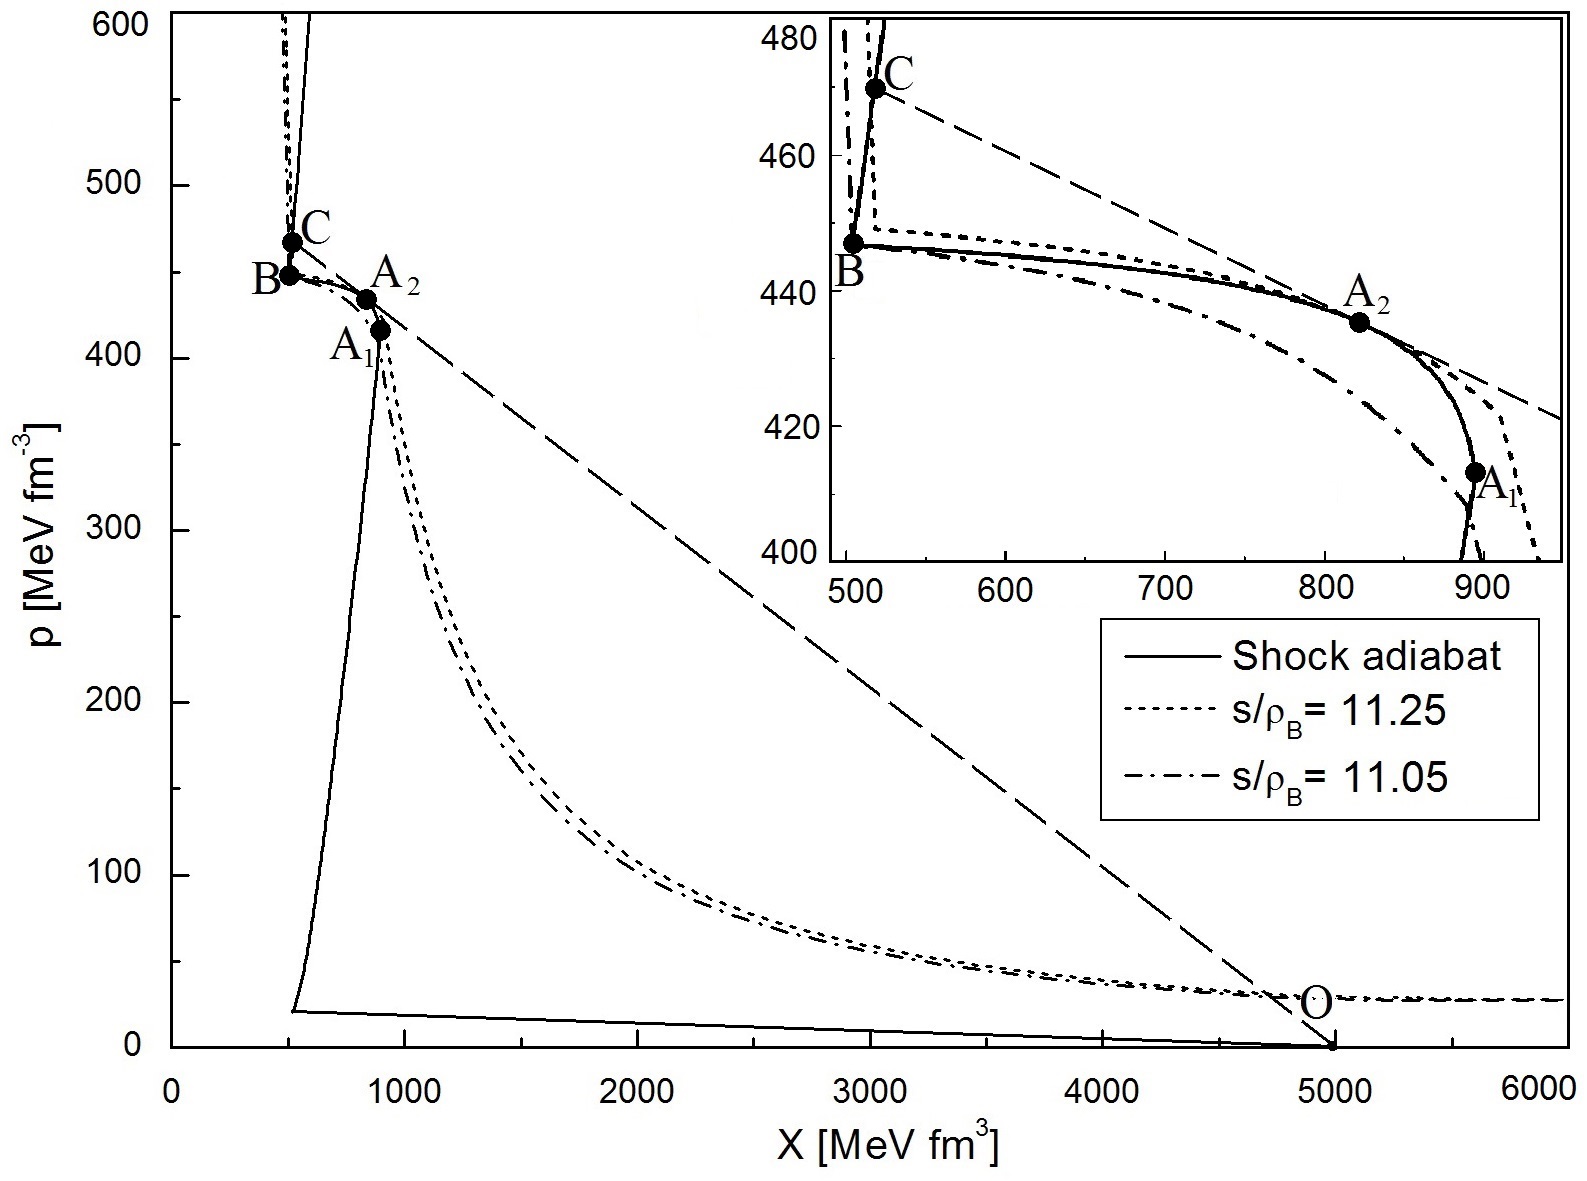
A similar situation occurs in the case of a fast cross-over or for the RHT adiabat of the W-kind shown in Fig. 10 (see also Figs. 3 and 4 in Ref. KAB:89a for more details) which has the Chapman-Jouguet point A2 (see Fig. 10). From Fig. 10 one sees that the presence of anomalous matter leads to mechanically unstable parts of the RHT adiabat (segment in Fig. 10), which include states in the mixed and the QGP phases. The only difference with the case of the unstable RHT adiabat of Fig. 6 is that the double shock does not appear due to an instability, while the other solutions shown in Fig. 8 and in the upper panel of Fig. 9 remain the same.
It is necessary to stress that all these generalized hydrodynamic solutions are proven to be mechanically stable KAB:89a ; KAB:89 ; KAB:89b and they were constructed in such a way that all neighboring shocks and simple waves are moving with the same velocity in the rest frame of their common fluid. In case of the double shock the inner shock between the initial state 1 and the final state belonging to the segment 3-4 of the generalized shock adiabat of Fig. 7 propagates in the medium 1 slower than the shock between the states 0 and 1 KAB:89a ; KAB:89 ; KAB:89b .
Shock transitions to mechanically unstable regions are accompanied by a thermodynamic instability, i.e., the entropy in such transitions decreases, while the collision energy grows Zeldovich ; Rozhd ; KAB:89a . At the same time the mechanical stability condition of the generalized shock adiabat always leads to thermodynamic stability of its flows. Or in other words, along the correctly constructed generalized shock adiabat the entropy cannot decrease KAB:89b . Among the possible solutions mentioned above an important role is played by the combination of a shock wave between the states O and A2, followed by a simple wave starting in the state A2 and continuing to states located at the boundary between the mixed phase and the QGP KAB:89a . The energy-density profile of this solution is shown in the lower panel of Fig. 8. For such a solution the entropy does not grow with collision energy, because the whole entropy is generated by a shock OA2 to the Chapman-Jouguet point A2 (see Fig. 10). This means that by increasing the collision energy one generates more highly compressed states which, however, have the same value of .
Based on this solution a signal for mixed-phase formation was suggested, provided that this instability of a W-kind model exists KAB:89a ; KAB:90 ; KAB:91 . The important physical consequence of such an instability is a plateau in the collision-energy dependence of the total number of pions per baryon produced in a nuclear collision, i.e., KAB:90 ; KAB:91 , provided that entropy is conserved during the subsequent hydrodynamic expansion. Since the total pion multiplicity consists of thermal pions and the ones which appear from decays of hadronic resonances, in case of the RHT adiabat the number of thermal pions per baryon should also exhibit a plateau or a plateau-like behavior with a small negative slope as a function of collision energy.
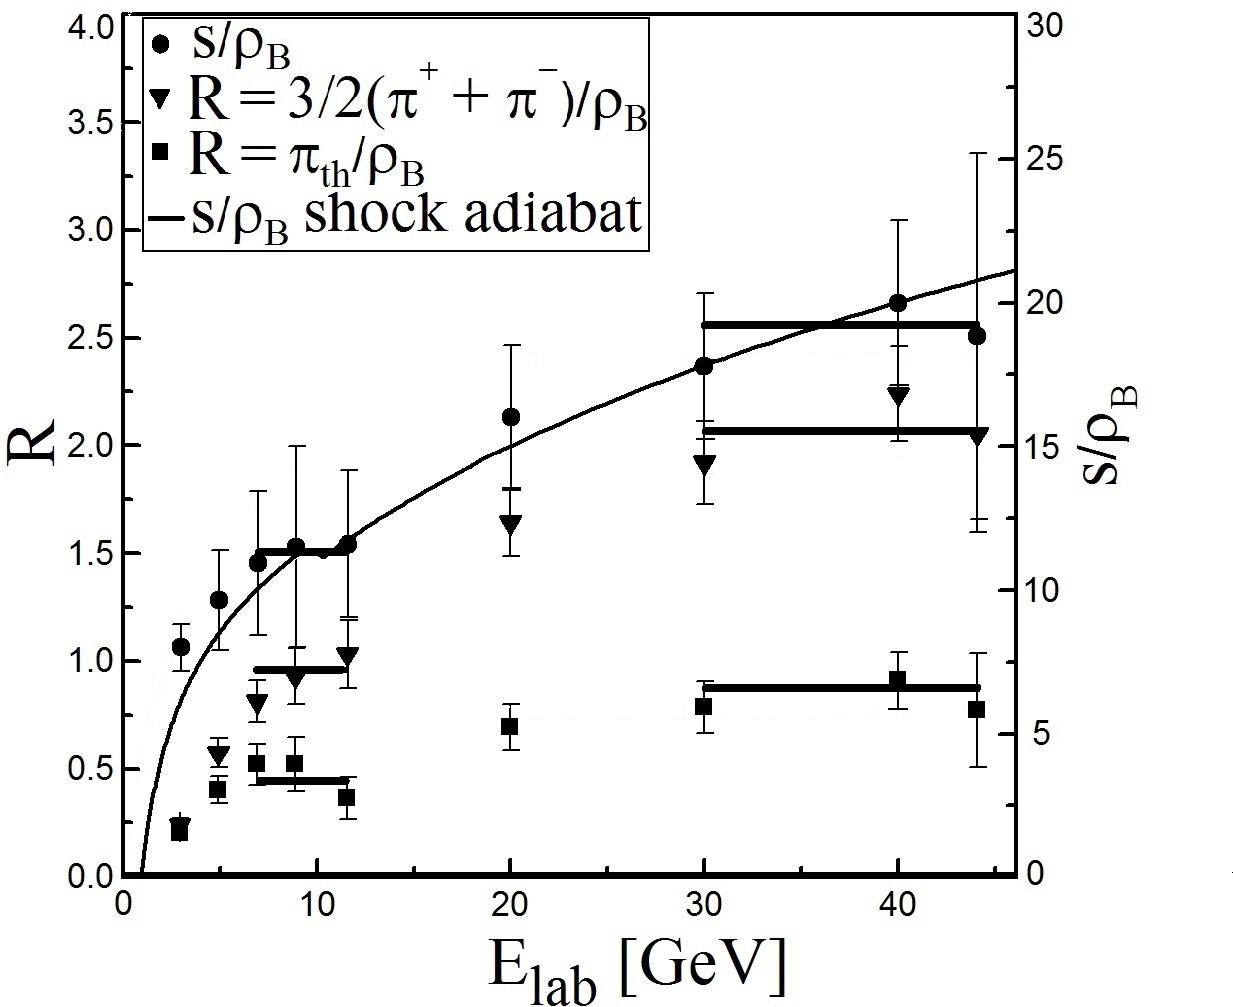
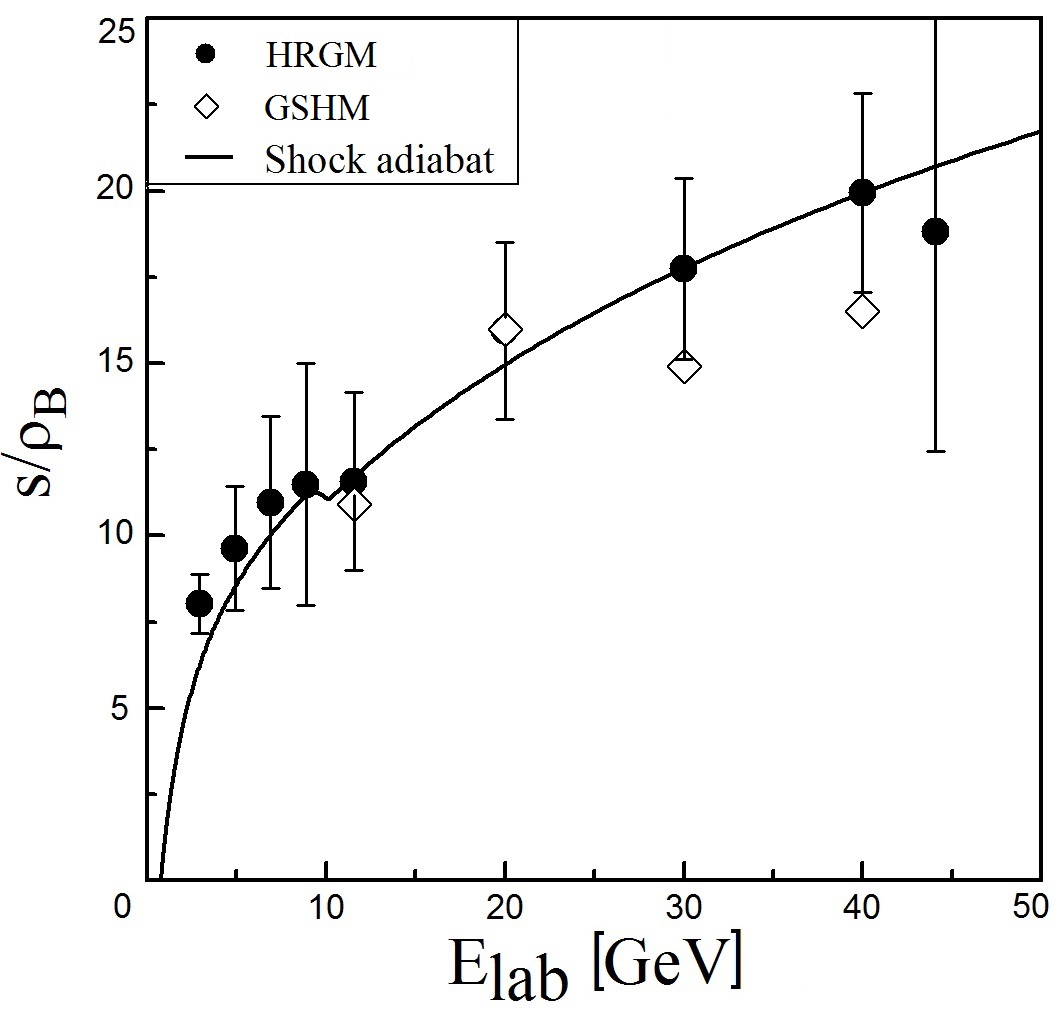
In Fig. 11 one can see indications for plateaus in the entropy per baryon and in the total and thermal pion number per baryon as functions of collision energy at the laboratory energies GeV, i.e., in the range where the other irregularities depicted in Figs. 3-5 occur. We admit that the error bars for and the total number of pions are still too large to draw definite conclusions. However, the thermal pion number per baryon clearly exhibits a plateau and, as discussed above, even a small decrease at GeV. We would like to stress that all quantities shown in Figs. 3-5 and 11 were found at chemical FO within the most realistic HRGM with multicomponent hard-core repulsion KAB:13 , which not only successfully describes 111 independent hadron-multiplicity ratios measured for center-of-mass energies 2.7 – 200 GeV, but also correctly reproduces the energy dependence of the Strangeness Horn with a .
It is, of course, possible that the anomalous properties of the mixed phase do not generate mechanical instabilities for shock transitions to this phase KAB:89a , like it was found for the Z-kind hadronic EOS Zimanyi . Nevertheless, it was argued that even in the latter case a plateau-like structure in the entropy per baryon, and, hence, in the thermal pion multiplicity per baryon, should be seen KAB:89a ; KAB:90 ; KAB:91 .
Now we are at a position to determine the parameters (individual heights for the same width) of the plateaus in the ratios , , and shown in Fig. 11. We investigated a few different schemes, but came to the conclusion that a three-parameter fit is the most reliable and simple one. Since we are searching for a plateau it is clear that its height should be the same for a given quantity . The width of all plateaus in the collision energy should also be the same, since they are generated by the same physical mechanism. Let denote the beginning of plateau, while denotes its width. Then one has to minimize
| (4) |
for all possible values of and . Here the subscript counts the data points to be described, whereas denotes the error of the corresponding quantity . We assume that the plateaus are correlated to each other, if is essentially smaller than 1. Also from the practical point of view it is necessary to find the set of maximally correlated plateaus for future experiments. The height of each plateau is found by minimizing in Eq. (4) with respect to and one obtains
| (5) |
As one can see from the table below minimal values of are reached for , but these are not the widest plateaus. There exist two sets for with for the low-energy plateaus (at GeV) and with for the high-energy plateaus (at GeV). Precisely these sets are depicted in Fig. 11, since we believe that the high-energy set at GeV with the width should not be taken into account because its value of is too close to 1 and, therefore, such plateaus are not strongly correlated even for these huge error bars.
| Low-energy minimum | |||||
| 2 | 3 | 11.13 | 0.520 | 0.857 | 0.178 |
| 3 | 3 | 11.31 | 0.461 | 0.892 | 0.531 |
| 4 | 2 | 10.56 | 0.433 | 0.725 | 1.649 |
| 5 | 2 | 11.54 | 0.470 | 0.848 | 4.455 |
| High-energy minimum | |||||
| 2 | 8 | 19.81 | 0.882 | 2.204 | 0.128 |
| 3 | 7 | 18.78 | 0.835 | 2.058 | 0.340 |
| 4 | 6 | 17.82 | 0.779 | 1.878 | 0.871 |
| 5 | 5 | 16.26 | 0.648 | 1.621 | 3.721 |
Although in Fig. 11 a clear plateau is seen in the thermal pion number per baryon while other quantities exhibit quasiplateaus, they are important since their strong correlation with the plateau in the thermal number of pions per baryon found here allowed us to determine their common width in the laboratory energy.
IV New signals of QGP formation
Here we suggest a couple of new signals indicating a boundary between the mixed phase and the QGP. First, a local minimum of the generalized specific volume at chemical FO as a function of the collision energy (see Fig. 4), signifies the existence of mechanical instabilities inside the mixed phase. Note that all stable RHT adiabats of Z-kind and all unstable RHT adiabats of W-kind and the corresponding generalized shock adiabats with a QGP EOS of MIT-Bag model type MITBag studied in Refs. KAB:89a ; KAB:90 ; KAB:91 ; Satarov:11 demonstrate exactly the same behavior. The physical origin for such a behavior is that for an increase in collision energy the entropy per baryon and the temperature of the formed QGP (being a normal medium) increase as well, while the baryonic density and the baryonic chemical potential are steadily decreasing. Hence in the QGP phase the variable grows, if the collision energy increases. Intuitively, such a dependence seems to be true for other QGP EOS, if they correspond to a normal medium. On the other hand, the behavior of the variable inside the mixed phase with anomalous properties is opposite and it does not depend on the stability or instability of the shock transitions to this region KAB:89a ; KAB:90 ; KAB:91 . On the basis of these arguments one can understand the reason why the boundary of the mixed phase and QGP corresponds to a local minimum of the variable along the RHT adiabat (shown in Fig. 10) or generalized shock adiabat and why it is also a minimum of as function of collision energy KAB:89a ; KAB:90 ; KAB:91 ; Satarov:11 .
In case of unstable shock transitions to the mixed phase, the unstable part of the mixed phase (segment A2B in Fig. 10) should be replaced by the Poisson adiabat passing through the point A2 (the dotted curve shown in Fig. 10). Consequently, if the matter formed in a collision expands isentropically after the shock OA2 disappears, then it can be shown that for the chemical FO pattern depicted in Figs. 3 and 4 the minimum of the variable of the initial state corresponds to a minimum of this variable at chemical FO, i.e., corresponds to . Indeed, the final states of the isentropic expansion belong to the Poisson adiabat at which . Here the entropy density and the system volume are taken at chemical FO, while the total number of baryons in an A+A collision is . At chemical FO temperatures below 150 MeV, the hadronic EOS can be safely represented as a mixture of ideal gases of massive pions and nucleons, i.e., its pressure and energy density can be represented via the density of nucleons and density of pions (here () is the nucleon (pion) mass). With the help of this EOS the variable at chemical FO can be cast as . From Fig. 11 one sees that constant values of in the range of GeV correspond to a nearly constant ratio and, hence, one can write for these energies. Since for these energies the entropy density changes from 0.3 fm-3 to 1.944 fm-3, while the chemical FO temperature changes from 84 MeV to 127 MeV, it is clear that approximately one can write and, hence, the value . A direct numerical check shows that for the chemical FO data belonging to the laboratory energy range GeV one obtains , which means that such a relation is valid with relative deviations % and %. Note that the relation gives us the values , i.e., it is fulfilled with relative errors % and % in this energy range and these estimates validate the use of our EOS. Using these arguments, we conclude that with reasonable accuracy one can establish the relation for the final states which belong to the Poisson adiabat and, therefore, the growth of entropy density (see Fig. 3) and the decrease of the variable shown in Fig. 4 are directly related to each other.
The same treatment can be applied to higher energies. In this case one has to write and account for the fact that the ratios and are increasing with collision energy, while the chemical FO temperature and entropy density are almost constant for GeV (see Fig. 3). Hence, in this case one can write , where we used the entropy conservation during the expansion of the matter formed after the disappearance of the shock wave (initial matter). Therefore, for laboratory energies above 11.6 GeV the variable should increase with the collision energy, and this is a reflection of the growth of the initial values of the variable, when the generalized shock adiabat reaches states inside the QGP.
Accounting for the above estimates, we conclude that the local minimum of is related to the minimum of the variable on the generalized shock adiabat existing at the boundary between the mixed phase and the QGP. Moreover, the above estimates show that the minimum of the function corresponds to the minimum of the chemical freeze-out volume , reported in Ref. KABAndronic:05 and reanalyzed recently in Ref. Oliinychenko:12 . Thus, we find that the minimum of is generated by the unstable part of the RHT adiabat which is close to the boundary of the mixed with the QGP phase, i.e., it is another signal of QGP formation.
In the above treatment we did not consider the kinetic FO process of hydrodynamic flows and did not account for the possible entropy growth in a kinetic FO shock KSH:96 . The reason is that the kinetic FO shock generates not more than 2% of the entropy KSH:99 and, hence, we can safely neglect such an increase during kinetic FO and can further assume that entropy conservation holds.
Note that these conclusions were also verified numerically for the shock adiabat shown in Figs. 10 and 11 and, hence, it is appropriate to present here the employed EOS. The hadron gas pressure used in the present work accounts for the mesonic and the (anti)baryonic states which are described by the masses , and by the temperature-dependent numbers of degrees of freedom KABPoS12
| (6) | |||||
This EOS accounts for the short-range repulsion introduced via the excluded volume (with fm) taken to be equal for all hadrons. With the parameters MeV, MeV, and
| (7) |
such a model not only represents the mass-integrated spectrum of all hadrons, but also it rather accurately reproduces the chemical FO densities of mesons and baryons and the ratios and for chemical FO temperatures below 155 MeV KABPoS12 . The parameters of the center of the shock adiabat were fixed as: , and .
The QGP EOS is motivated by the MIT-Bag model MITBag
| (8) |
where the constants , , , and were found by fitting the chemical FO data for GeV with values along the RHT adiabat and by keeping the pseudocritical temperature value at zero baryonic density close to 150 MeV, in agreement with lattice-QCD data Aoki .
Note that the above values of the coefficients , and differ from the values , and obtained within lattice QCD Aoki at vanishing baryonic chemical potential, but this difference can be attributed to the and dependence of the bag pressure
| (9) | |||||
which identically generates the QGP pressure (8) , but with coefficients , and . The obtained result for is in line with the requirements of the finite-width model FWM:1 ; FWM:2 of quark-gluon bags.
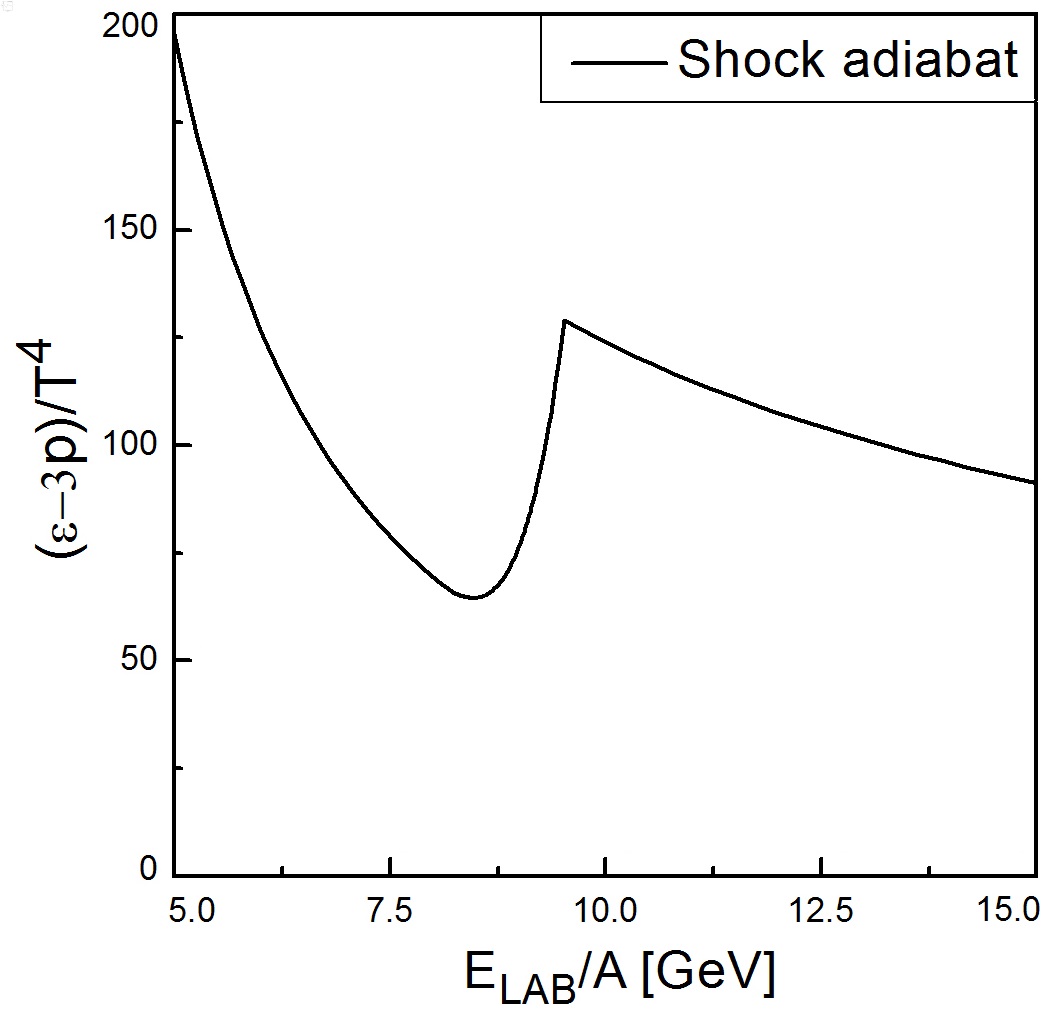
Using the above EOS we calculated the phase diagram and constructed the RHT adiabat inside all phases. As usual, the phase transition was found from the Gibbs criterion, . The resulting RHT adiabat describes the chemical FO data well (see Fig. 11). The most remarkable finding is the appearance of a peak in the trace anomaly, which exists exactly at the boundary of the mixed phase and the QGP (see upper panel of Fig. 12). Comparing the trace-anomaly peak at chemical FO (see Fig. 5) and that on the RHT adiabat shown in Fig. 12, one can conclude that the respective collision energies are very close to each other. This is not a coincidence, but a natural one-to-one correspondence. A slight shift of the position of the peaks relative to each other is due to the fact that the chemical FO points are discrete while the trace-anomaly peak on the RHT adiabat is located just between two neighboring values of collision energies GeV ( GeV) and GeV ( GeV). Moreover, from the fact that inside the mixed phase and inside the QGP near its border with the mixed phase the quantitative differences between the shock, Poisson, and generalized shock adiabats are very small (compare, for instance, the Poisson and shock adiabats passing through the Chapman-Jouguet point in Fig. 10) one can safely conclude that the -peak on the shock adiabat and on the generalized one (which consists of the Poisson and the shock adiabat) should be located at practically the same collision energy. Our numerical results support this conclusion, but the analysis of the trace anomaly along the shock adiabat is much simpler than the one for the generalized shock adiabat, which we omit here.
The large difference in the values of trace anomaly at chemical FO and at the stage of matter formation can be explained by the complicated behavior of the trace anomaly along the Poisson adiabat, but its detailed analysis is out of the scope of the present work and it will be published elsewhere. Here we would like to stress that the found relation between the trace-anomaly peaks tells one that its peak seen at chemical FO is, probably, the most direct and physically most intuitive signal for QGP formation.
At the same time there always remains the question whether the results obtained above are model independent. In particular, it is rather important to understand whether the plateaus found in the entropy per baryon can be obtained by other models of chemical FO. It is clear that the situation with the total number of charged pions per baryon is much simpler because the total number of charged pions is measured in experiment. Hence, only the model which correctly reproduces such an experimentally measured ratio should be considered to be valid. A similar situation exists for the number of thermal pions per baryon because all viable thermal models use more or less the same data on the properties of hadrons and hadronic resonances and, therefore, if two models correctly reproduce the total number of charged pions per baryon, then it is reasonable to expect that the number of thermal pions per baryon in these models will be also the same.
In order to demonstrate the model independence of the high-energy plateau in the entropy per baryon found here (see Fig. 11), we use an entirely different statistical model of chemical FO known as the generalized statistical hadronization model (GSHM) RafLet . A word of caution should be added regarding the GSHM framework, because the chemical FO volumes found within the GSHM are in most cases essentially larger than the kinetic FO volumes determined by Hanbury-Brown and Twiss (HBT) measurements (for a detailed comparison of chemical and kinetic FO volumes see Ref. KABAndronic:09 , while for a review on HBT measurements of kinetic FO volumes see Ref. HBT ). In other words, within the GSHM the chemical FO occurs too late, namely only after kinetic FO, when hadrons cease to scatter elastically and the momentum spectra of hadrons no longer changes, while physically it should occur prior to kinetic FO. Furthermore, very recently two successful models KAB:gs ; Gupta were suggested, which treat the chemical FO of strange and non-strange hadrons separately. These models not only allow one to extremely well reproduce hadronic multiplicities measured in A+A collisions without any deviation of strange charge from chemical equilibrium, but they also clearly demonstrate that the apparent chemical non-equilibrium introduced long ago in Ref. Rafelsky:gamma simply reflects the fact that the strange hadrons experience chemical FO at a different hypersurface than the non-strange ones.
Keeping these cautionary remarks in mind, we now compare the GSHM results for the entropy per baryon at chemical FO with the ones from our model. As one can see from the lower panel of Fig. 12, despite the principal differences between the HRGM KAB:13 and the GSHM RafLet , the extracted values of the entropy per baryon are very close to each other. Unfortunately, the authors of Ref. RafLet did not publish their error bars, but it is clear that the error bars of the GSHM should be similar to the error bars of the HRGM. In this case, as one can see from the lower panel of Fig. 12, these two different models yield, within error bars, very similar values for the entropy per baryon.
One may wonder why, despite the differences between the GSHM and the HRGM, the values for the entropy per baryon found within these models are the same within error bars. The point is that the GSHM, like the HRGM, correctly reproduces the multiplicity ratios of many hadrons, including pions and baryons. Since at low collision energies and, hence, at low freeze-out temperatures, the entropy is simply proportional to the thermal number of pions, one should not be surprised by the agreement of the entropy per baryon between these two models. Therefore, it seems that the GSHM, despite its marked differences to our version of the HRGM, indeed also produces a plateau in the entropy per baryon at GeV. Unfortunately, the GSHM RafLet does not describe the data at laboratory energies below 11 GeV.
An immediate conclusion from the comparison of the entropy per baryon for the HRGM KAB:13 and the GSHM RafLet is that, if a statistical model with or without chemical equilibrium very well reproduces all hadronic ratios, then one can safely extract from it both the entropy per baryon and the number of thermal pions per baryon. Using these quantities, one can also verify the existence of plateaus in their energy dependence with high confidence. We hope that more precise experimental data will help us to maximize this confidence in the future.
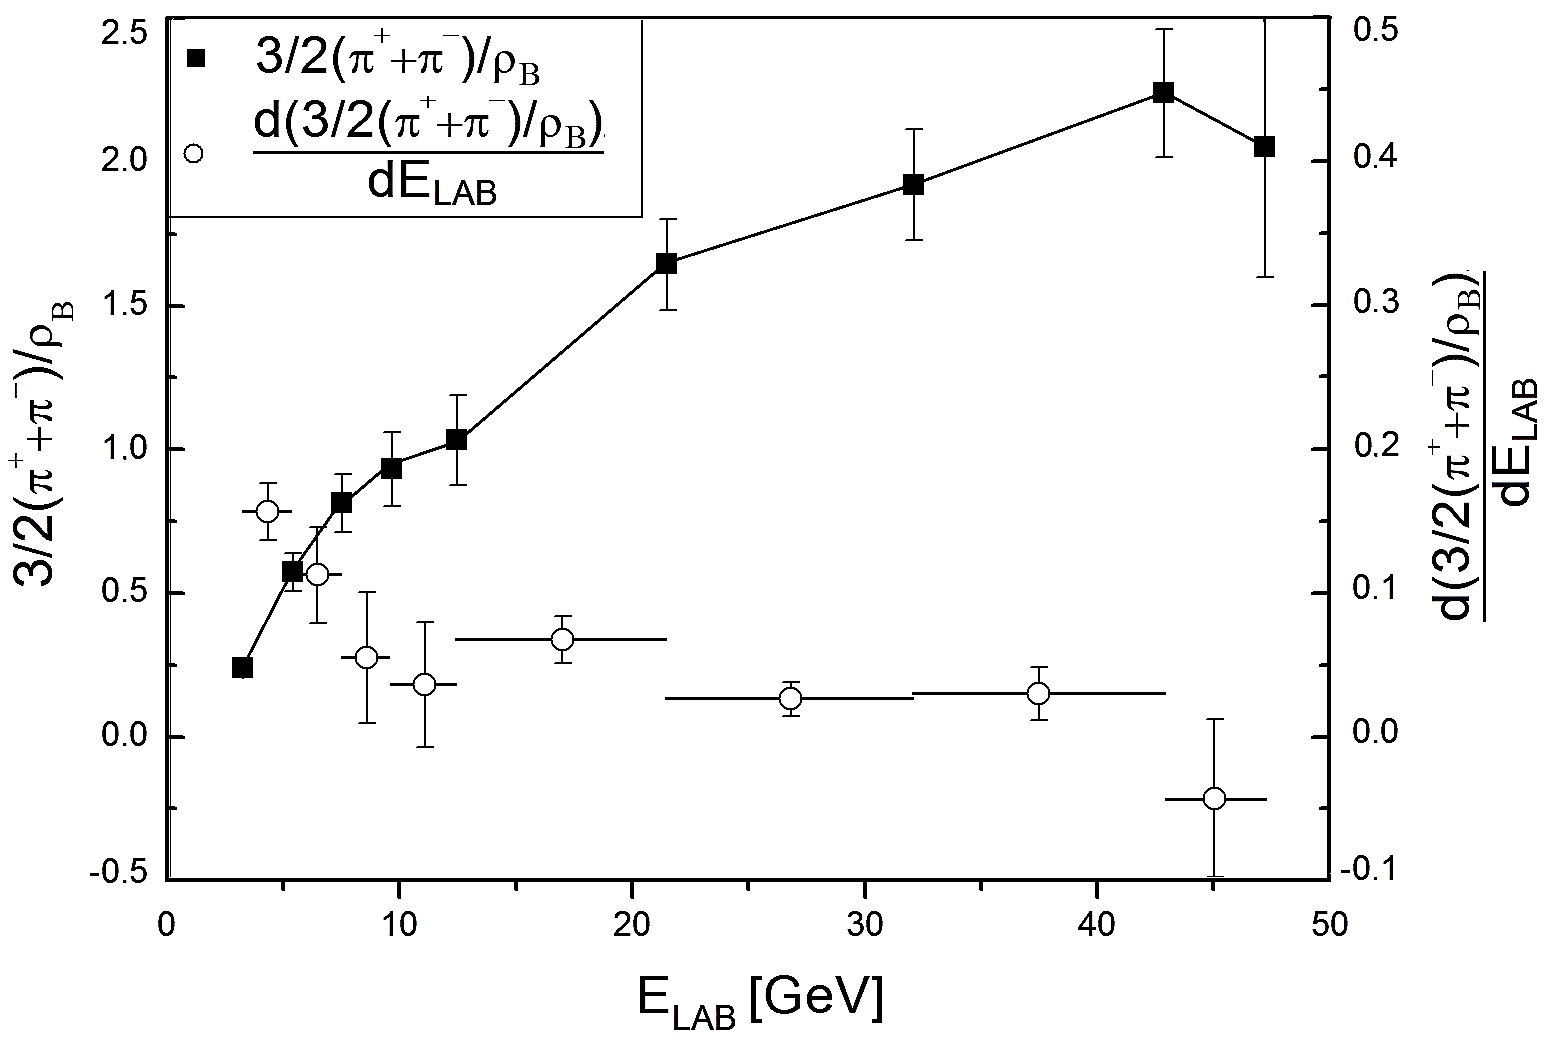
In order to give further indications for the plateaus discussed above, in the following we discuss additional irregularities which can be obtained directly from the data. The first is the behavior of the derivative of the total number of charged pions per baryon, or more precisly, the quantity , with respect to laboratory energy, which is shown in Fig. 13. In order to find it we used cubic splines and then calculated the corresponding derivative. In Fig. 13 the horizontal bars correspond to the values of the derivative found in the middle between two neighboring energy points. The local minimum at GeV in the derivative of the total pion number per baryon corresponds to the lower sets of plateaus found in Fig. 11. One could wonder why for large error bars of this ratio its derivative, seemingly, has smaller errors. The procedure of calculating the error bars shown in Fig. 13 is given in the Appendix.
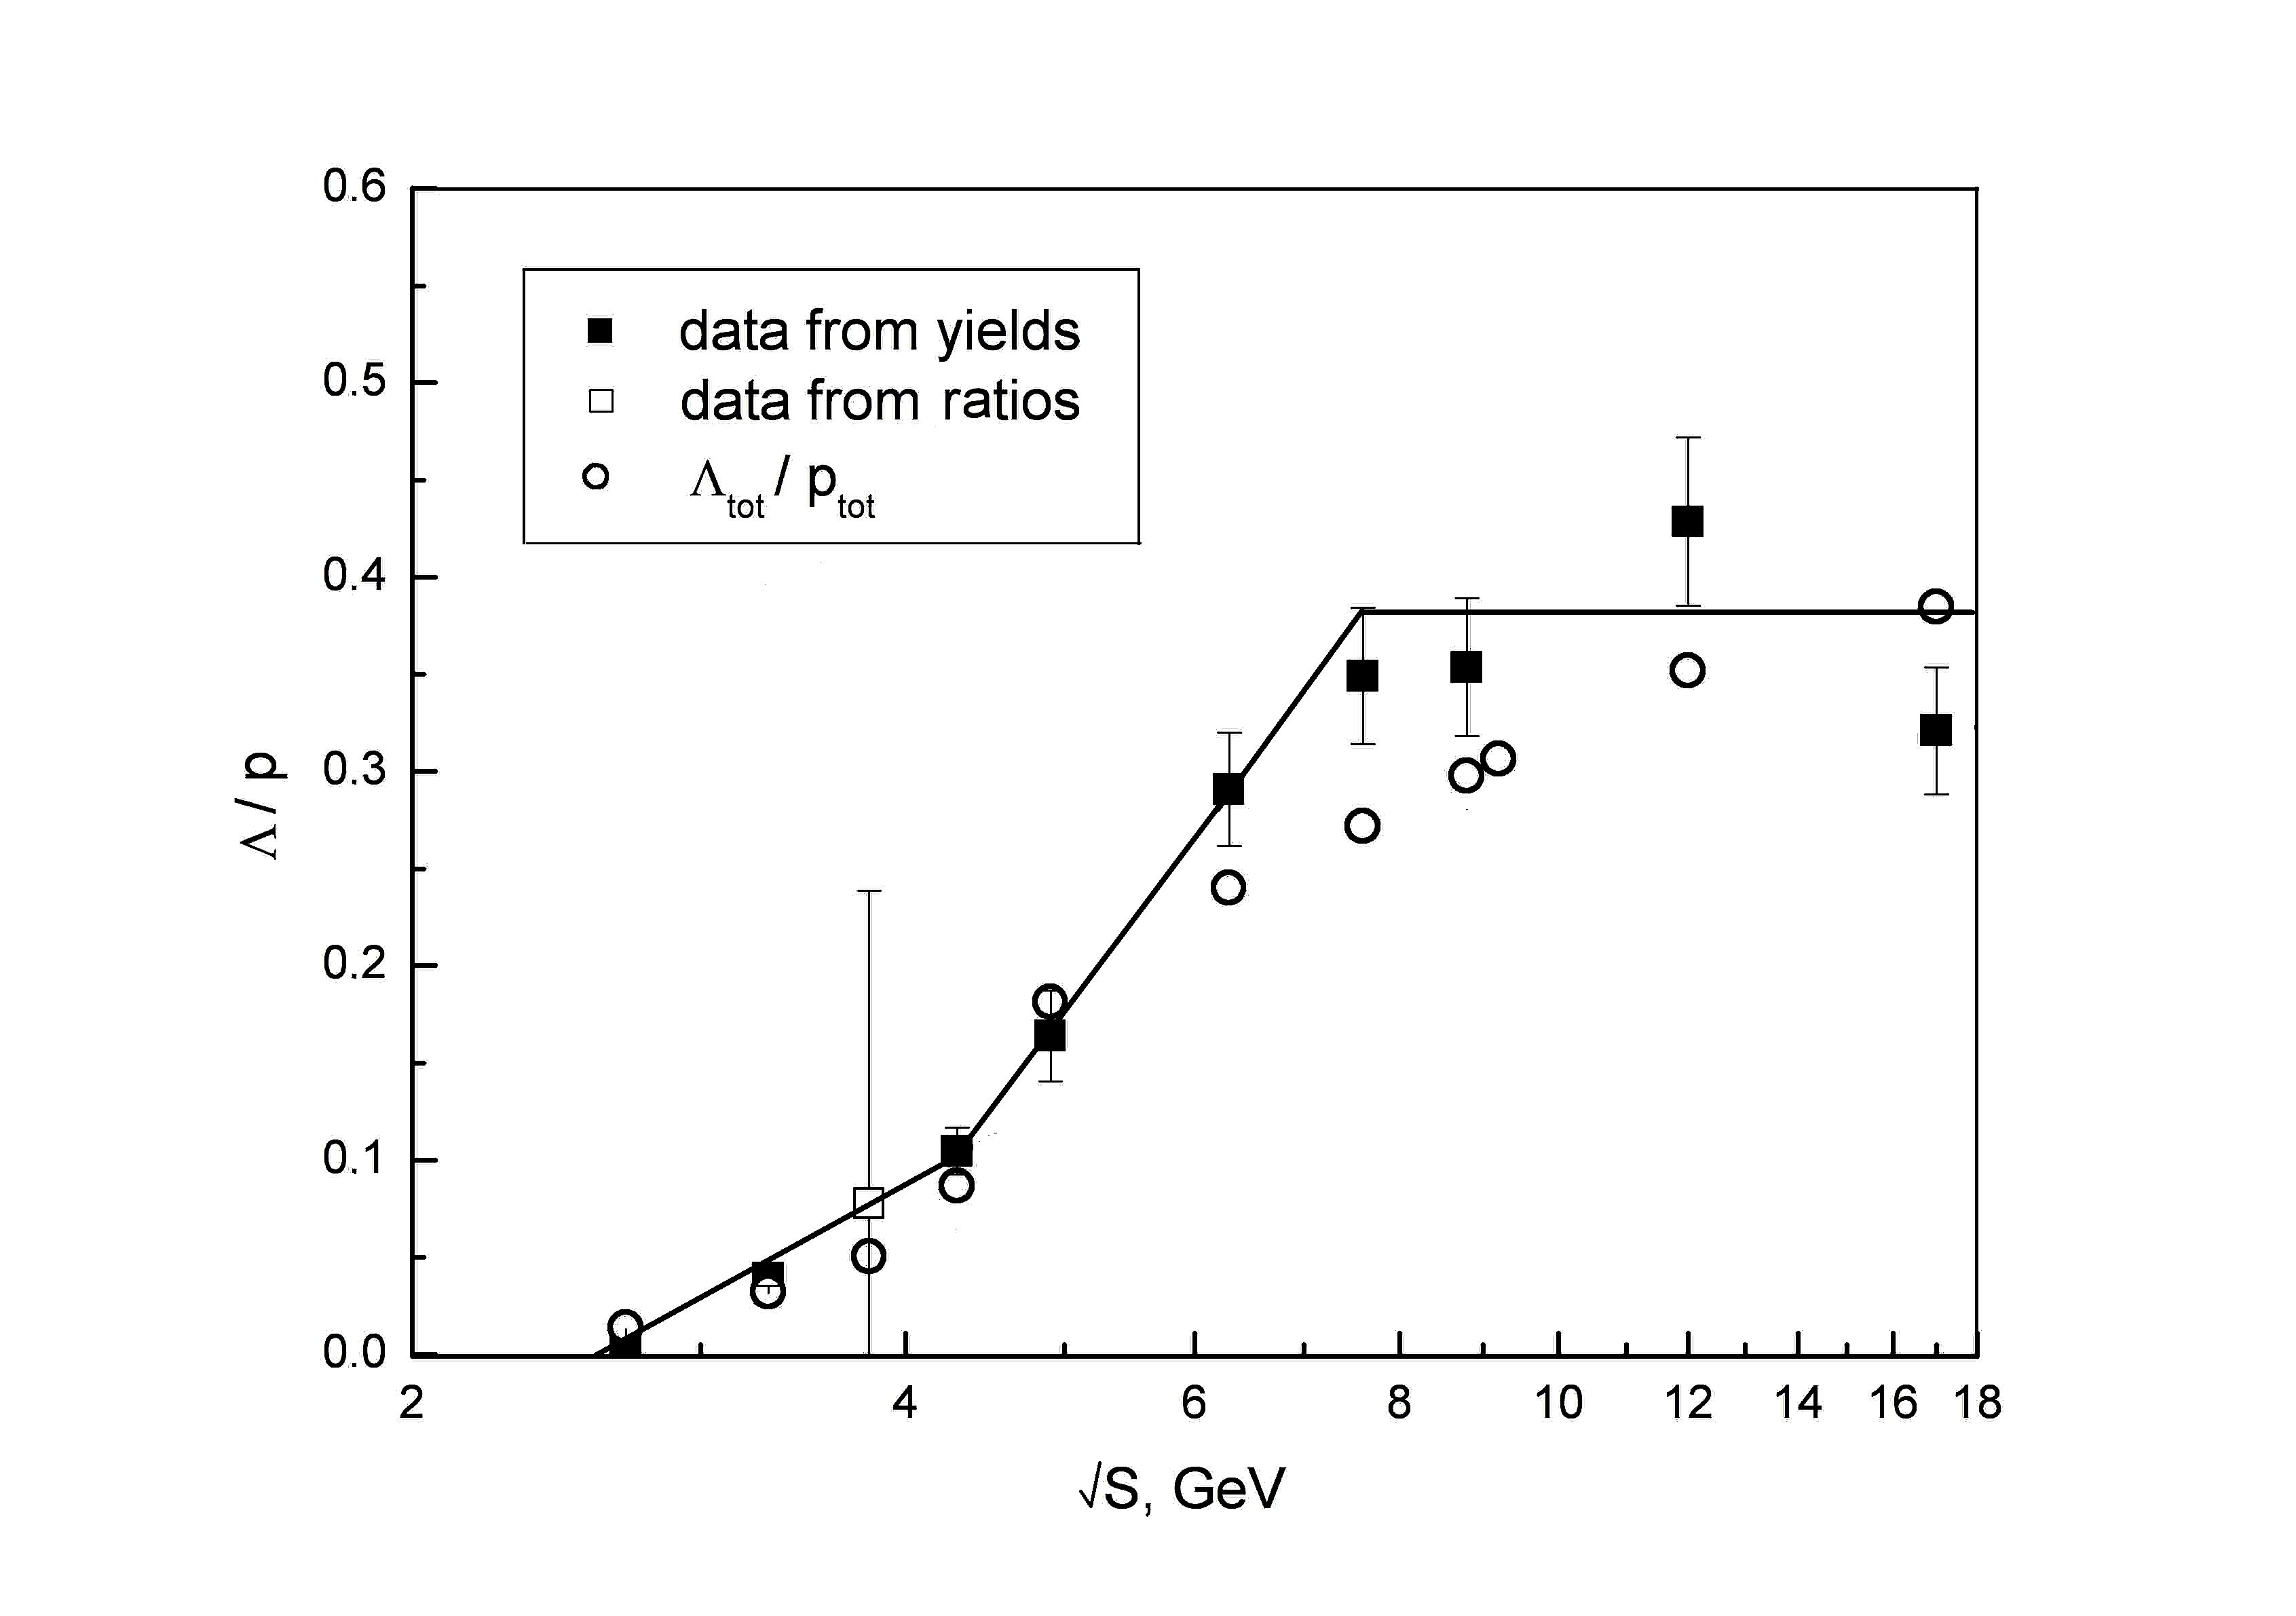
The second irregularity appears in the experimental number of hyperons per proton, as shown in Fig. 14. It is necessary to say few words about the experimental data of hadron yields shown in Fig. 14. For the AGS collision energies 2.7, 3.3, and 4.3 GeV the yields of protons and hyperons were taken, respectively, from Refs. AGS_p2 ; AGS_p1 and AGS_L . Experimental yields measured at the highest AGS energy 4.9 GeV for protons were taken from Ref. AGSpi2 ; AGS_p1 , while for they were given in Ref. AGS_L2 . The mid-rapidity yields of protons and lambdas measured at the SPS energies 6.3, 7.6, 8.8, 12, and 17.3 GeV are given by the NA49 collaboration in Refs. KABNA49:17a ; KABNA49:17b ; KABNA49:17Ha ; KABNA49:17Hb ; KABNA49:17Hc ; KABNA49:17phi .
For a comparison, in Fig. 14 we also show the value found from other two ratios, and , for GeV. This figure clearly demonstrates that there are three regimes in the energy dependence of the ratio: at GeV the slope of this ratio visibly increases, while above GeV it approximately saturates. The change of slope at GeV is very similar to the prediction of Ref. Rafelski:82 that the mixed-phase formation can be identified by a rapid increase in the number of strange quarks per light quarks. The present ratio is convenient since at low collision energies hyperons are generated in collisions of nucleons. As it seems, this mechanism works up to GeV, while an appearance of the mixed phase should lead to an increase in the number of strange quarks and antiquarks due to the annihilation of light quark-antiquark and gluon pairs. This is exactly seen from Fig. 14. Moreover, the present model predicting the mixed-phase formation at GeV naturally explains the change of the experimental ratio slope at this energy on the basis of the idea of Ref. Rafelski:82 .
It is necessary to make a remark on the origin of the high-energy plateaus seen in Fig. 11. The main question is whether such plateaus provide evidence for another crossover or phase transition, with an associated instability of the shock adiabat. A close inspection of Figs. 3, 4, and 5 reveals that at RHIC energy GeV (or GeV) KABstar:9.2 there may be a hint of irregularities similar to the ones associated with the low-energy plateaus. Unfortunately, their small amplitude compared to the neighboring points and very large error bars do, at least at the moment, not allow us to safely interpret them as clear signals of some instability related to a crossover or phase transition.
However, if we assume that these high-energies plateaus indeed exist, at present we see the following three possibilities for their origin. The first possibility is that they are, in fact, quasiplateaus which are similar to the ones that were found for a pure QGP EOS in the case of Z-kind models KAB:90 . They are not associated with a crossover or phase transition, but may appear at high energy density due to specific features of the QGP EOS. In this case only the low-energy plateaus correspond to the quark-gluon-hadron mixed phase.
The second possibility is that the quasiplateaus at GeV correspond to the same crossover or phase transition which exists at lower energies. The initial states of the system lie in the pure QGP phase between the lower and the higher sets of plateaus, but return to the phase boundary at the higher end of this range of collision energies. This idea is further elaborated in Ref. Kizka2015 . Support for this interpretation comes from the PHENIX collaboration which concluded from the acoustic scaling of the elliptic flow that the critical endpoint may exist at center-of-mass energies GeV PHENIX14 ; PHENIX14b .
Finally, in the third case, if both sets of plateaus are due to instabilities caused by two separate phase-transition regions, the traditional irregularities Kink ; Horn ; Step may reflect the second phase transition. But even in this case it is unclear whether the onset of deconfinement begins at GeV ( GeV) as suggested in Ref. Gazd_rev:10 or whether it can appear at GeV as suggested in the work on quarkyonic matter QYON . At the moment it is absolutely unclear whether the second phase transition is a deconfinement or a chiral-symmetry restoring transition. Moreover, it is an open question whether this is a second-order phase transition, a first-order one, or a crossover. From the current state of the art one can speculate that the local minimum of and the small peak of the trace anomaly seen at GeV could, probably, signal a very weak first-order phase transition or a second-order one, but the error bars of the quantities measured at this energy range are very large and, hence, to make a more definite conclusion we need about ten more data points and an experimental accuracy that is one order of magnitude better.
V Conclusions
In this work we have presented irregularities at chemical FO elucidated via a high-quality fit of experimental particle ratios obtained by the advanced version of the hadron resonance gas model. The fit quality achieved, , lends our results high confidence. Among these irregularities we observed a dramatic jump of the effective number of degrees of freedom at center-of-mass collision energies GeV. At GeV we also found a local minimum of the generalized specific volume and a sharp peak of the trace anomaly .
Furthermore, at chemical FO we found two sets of plateaus in the collision-energy dependence of the entropy per baryon, and of the total and the thermal numbers of pions per baryon, which were predicted a long time ago KAB:89a ; KAB:90 ; KAB:91 . We discussed in some detail the generalized shock-adiabat model for low-energy central nuclear collisions and argued that the plateaus and the minimum of found at low collision energies are generated by the RHT-adiabat instabilities existing at the boundary between the mixed phase and the QGP. A numerical calculation of the RHT adiabat for a realistic EOS of the hadronic phase allowed us to reproduce the plateau and to fix the parameters of the QGP EOS. Moreover, the trace anomaly calculated along the RHT adiabat exhibits a sharp peak at the boundary of QGP and mixed phase, which is l ocated at a center-of-mass collision energy GeV. Our numerical analysis shows a one-to-one correspondence between the trace-anomaly peaks found on the RHT adiabat and at chemical FO. Therefore, it is quite possible that the trace-anomaly peak found at chemical FO in combination with other irregularities provide evidence of the phase transition to the QGP in nucleus-nucleus collisions. Such a conclusion would also naturally explain the change of the slope of the experimental ratio at GeV, due to the enhanced production of strange quarks and antiquarks as suggested in Ref. Rafelski:82 .
Also, at chemical FO we found a second set of plateaus at GeV, which, however, might not correspond to a phase transition or to the discussed instabilities. Since the generalized shock-adiabat model is not applicable at this energy range we cannot make definite conclusions about the origin of this set of plateaus. However, a remarkable fact is that a similar plateau in the collision-energy dependence of the entropy per baryon occurs in the same energy range within an entirely different model known as GSHM RafLet . This example demonstrates that any statistical model of chemical FO which correctly reproduces the multiplicities of the most abundant hadrons such as pions and baryons should be able to generate similar values of the entropy per baryon because at chemical FO the main contribution to the entropy is provided by pions. Therefore, at chemical FO we may expect a model-independent behavior of the entropy per baryon as function of collision energy.
In order to make more definite conclusions about the plateaus found at laboratory energies GeV one needs more precise data measured in steps of of about 100-200 MeV and a more realistic model of heavy-ion collisions in this range of collision energies. However, now it is already clear that, if an additional phase transition indeed exists at laboratory energies GeV, then both sets of plateaus found here may be considered as the first evidence of two phase transitions in QCD.
Acknowledgments. The authors are thankful to E.V. Shuryak and I. P. Yakimenko for important comments. K.A.B., D.R.O., A.I.I., V.V.S., and G.M.Z. acknowledge support from the National Academy of Sciences of Ukraine. D.R.O. acknowledges funding from the Helmholtz Young Investigator Group VH-NG-822 of the Helmholtz Association and GSI, and thanks HGS-HIRe for support. Partial support by the grant NSH-932.2014.2 is acknowledged by I.N.M. and L.M.S.
VI Appendix
In this Appendix we present a derivation of the errors for the derivative of the quadratic spline function , which approximates the experimental data points given at the points , with . Here, denotes the error of experimental data point . The derivation of errors for the cubic splines is very similar but technically more involved. We checked numerically that the errors for the data points for the charged pions per baryon (see Fig. 13) given by either the quadratic or the cubic splines are indistinguishable. The reason is the very smooth behavior of the approximated function.
To approximate three successive points , , and by a second-order polynomial , we determine the set of coefficients , and for each interval as a solution of
| (10) | |||||
| (11) | |||||
| (12) |
Solving the system (10)–(12) for the coefficients and , one has
| (13) | |||||
| (14) |
Using Eqs. (13) and (14) one can determine the function for each considered interval and its error in the same interval via the formula Taylor82
| (15) | |||||
This expression was used to calculate the error for the derivative of the total pion number per baryon with respect to laboratory energy, see Fig. 13. The expression (15) greatly simplifies, if one chooses
| (16) | |||||
Already this formula shows that, if the wide intervals and contain a large error, say , then the resulting error of the derivative is the smaller the wider the intervals and are. This qualitatively explains, why the errors of the derivative of the total pion number per baryon shown in Fig. 13 sometimes strongly differ from the errors .
References
- (1) M. Gazdzicki, Z. Phys. C 66, 659 (1995).
- (2) M. Gazdzicki and M.I. Gorenstein, Acta Phys. Polon. B 30, 2705 (1999).
- (3) M.I. Gorenstein, M. Gazdzicki and K.A. Bugaev, Phys. Lett. B 567, (2003) 175
- (4) M. Gazdzicki, M.I. Gorenstein and P. Seyboth, Acta Phys. Polon. B 42, 307 (2011).
- (5) D.R. Oliinychenko, K.A. Bugaev and A.S. Sorin, Ukr. J. Phys. 58, 211 (2013).
- (6) K.A. Bugaev, D.R. Oliinychenko, A.S. Sorin and G.M. Zinovjev, Eur. Phys. J. A 49, 30 (2013).
- (7) K.A. Bugaev et al., Europhys. Lett. 104, 22002 (2013).
- (8) K.A. Bugaev et al., Ukr. J. Phys. 60, 181 (2015).
- (9) J. Cleymans and H. Satz, Zeit. Phys. C 57, 135 (1993).
- (10) J. Cleymans, K. Redlich, Phys. Rev. Lett. 81, 5284 (1998).
- (11) P. Braun-Munzinger, I. Heppe, J. Stachel, Phys. Lett. B 465, 15 (1999).
- (12) P. Braun-Munzinger, J. Cleymans, H. Oeschler, K. Redlich, Nucl. Phys. A 697, 902 (2002).
- (13) A. Andronic, P. Braun-Munzinger and J. Stachel, Nucl. Phys. A 772, 167 (2006) and references therein.
- (14) A. Andronic, P. Braun-Munzinger and J. Stachel, Phys. Lett. B 673, 142 (2009) and references therein.
- (15) K.A. Bugaev, M.I. Gorenstein, B. Kämpfer and V. I. Zhdanov, Phys. Rev. D 40, 2903 (1989).
- (16) K.A. Bugaev, M.I. Gorenstein and D.H. Rischke, JETP Lett. 52, 1121 (1990).
- (17) K.A. Bugaev, M.I. Gorenstein and D.H. Rischke, Phys. Lett. B 255, 18 (1991) and references therein.
- (18) J. Letessier and J. Rafelski, Eur. Phys. J. A 35 (2008) 221.
- (19) S. Wheaton, J. Cleymans and M. Hauer, Comput. Phys. Commun. 180, 84 (2009).
- (20) J.L. Klay et al., Phys. Rev. C 68, 054905 (2003).
- (21) L. Ahle et al., Phys. Lett. B 476, 1 (2000).
- (22) B.B. Back et al., Phys. Rev. Lett. 86, 1970 (2001).
- (23) J.L. Klay et al., Phys. Rev. Lett. 88, 102301 (2002).
- (24) C. Pinkenburg et al., Nucl. Phys. A 698, 495c (2002).
- (25) S. Albergo, R. Bellwied, M. Bennett, D. Boemi, B. Bonner, H. Caines, W. Christie and S. Costa et al., Phys. Rev. Lett. 88, 062301 (2002).
- (26) P. Chung et al., Phys. Rev. Lett. 91, 202301 (2003).
- (27) S.V. Afanasiev et al., Phys. Rev. C 66, 054902 (2002).
- (28) S.V. Afanasiev et al., Phys. Rev. C 69, 024902 (2004).
- (29) T. Anticic et al., Phys. Rev. Lett. 93, 022302 (2004).
- (30) S.V. Afanasiev et al., Phys. Lett. B 538, 275 (2002).
- (31) C. Alt et al., Phys. Rev. Lett. 94, 192301 (2005).
- (32) S.V. Afanasiev et al., Phys. Lett. B 491, 59 (2000).
- (33) B. Abelev et al., Phys. Rev. C 81, 024911 (2010).
- (34) B. Abelev et al., Phys. Rev. C 79, 034909 (2009).
- (35) J. Adams et al., Phys. Rev. Lett. 92, 182301 (2004).
- (36) J. Adams et al., Phys. Lett. B 567, 167 (2003).
- (37) C. Adler et al., Phys. Rev. C 65, 041901(R) (2002).
- (38) J. Adams et al., Phys. Rev. Lett. 92, 112301 (2004).
- (39) J. Adams et al., Phys. Lett. B 612, (2005) 181.
- (40) A. Billmeier et al., J. Phys. G 30, S363 (2004).
- (41) K.A. Bugaev and M.I. Gorenstein, Z. Phys. C 43, 261 (1989) and references therein.
- (42) K.A. Bugaev, M.I. Gorenstein and V.I. Zhdanov, Teor. Mat. Fizika (in Russian) 80, 138 (1989).
- (43) Sz. Borsanyi et al., JHEP 1208 (2012) 053.
- (44) V.M. Galitskij and I.N. Mishustin, Phys. Lett. B 72, 285 (1978).
- (45) H. Stöcker, G. Graebner, J.A. Maruhn and W. Greiner, Phys. Lett. B 95, 192 (1980).
- (46) B. Kämpfer, J. Phys. G 9, 1487 (1983).
- (47) H. Stöcker and W. Greiner, Phys. Rep. 137, 277 (1986) and references therein.
- (48) H.W Barz., L.P. Csernai, B. Kämpfer and B. Lukacs, Phys. Rev. D 32, 115 (1985).
- (49) L.D. Landau and E.M. Lifshitz, Fluid Mechanics, Pergamon, New York, (1979).
- (50) Y.B. Zel’dovich and Y.P. Raiser, Physics of shock waves and high temperature hydrodynamic phenomena, Academic, New York, (1967).
- (51) B.L. Rozhdestvensky and N.N. Yanenko, Systems of Quasi-Linear Equations, Nauka, Moscow, (1978).
- (52) A.V. Merdeev, L.M. Satarov and I.N. Mishustin, Phys. Rev. C 84, 014907 (2011).
- (53) Yu.B. Ivanov, V.N. Russkikh and V.D. Toneev, Phys. Rev. C 73, 044904 (2006).
- (54) J.D. Walecka, Ann. Phys. 83, 491 (1974).
- (55) J. Zimanyi et al., Nucl. Phys. A 484, 647 (1988).
- (56) H.A. Bethe, Office of Scientific Research and Development Report No. 545, 25 (1942).
- (57) K.A. Bugaev, Nucl. Phys. A 606, 559 (1996).
- (58) K.A. Bugaev, M.I. Gorenstein and W. Greiner, J. Phys. G 25, 2147 (1999).
- (59) A. Chodos et. al., Phys. Rev. D 9, 3471 (1974).
- (60) K.A. Bugaev et al., PoS Baldin ISHEPP XXI 2012, 017 (2012).
- (61) Y. Aoki et al., Phys. Lett. B 643, 46 (2006).
- (62) K. A. Bugaev, V. K. Petrov and G. M. Zinovjev, Europhys. Lett. 85, 22002 (2009).
- (63) K. A. Bugaev, V. K. Petrov and G. M. Zinovjev, Phys. Rev. C. 79, 054913 (2009).
- (64) M. Lisa, S. Pratt, R. Soltz, U. Wiedemann, Ann. Rev. Nucl. Part. Sci. 55 (2005) 357.
- (65) S. Chatterjee, R. M. Godbole and S. Gupta, Phys. Lett. B 727, 554 (2013).
- (66) V. V. Sagun, Ukr. J. Phys. 59, 755 (2014).
- (67) J. Rafelski, Phys. Lett. B 62, 333 (1991).
- (68) J. Rafelski and B. Müller, Phys. Rev. Lett. 48, 1066 (1982).
- (69) V. A. Kizka, V. S. Trubnikov, K. A. Bugaev and D. R. Oliinychenko, arXiv:1504.06483 [hep-ph] (2015).
- (70) R. Lacey et. al, Phys. Rev. Lett. 112, 082302 (2014).
- (71) R. A. Lacey, Talk at 24-th International Conference on Ultra-Relativistic Nucleus-Nucleus Collisions “Quark Matter 2014”, 19-24 May, 2014, Darmstadt, Germany; arXiv:1408.1343 [nucl-ex].
- (72) A. Andronic et. al, Nucl. Phys. A 837, 65 (2010).
- (73) J. R. Taylor, “An introduction to error analysis”, University Science Book Mill Valley, California (1982).