The Extreme Ultraviolet Deficit and Magnetically Arrested Accretion in Radio Loud Quasars
Abstract
The Hubble Space Telescope composite quasar spectra presented in Telfer et al. show a significant deficit of emission in the extreme ultraviolet (EUV) for the radio loud component of the quasar population (RLQs), compared to the radio quiet component of the quasar population (RQQs). The composite quasar continuum emission between 1100 Å and 580 Å is generally considered to be associated with the innermost regions of the accretion flow onto the central black hole. The deficit between 1100 Å and 580 Å in RLQs has a straightforward interpretation as a missing or a suppressed innermost region of local energy dissipation in the accretion flow. It is proposed that this can be the result of islands of large scale magnetic flux in RLQs that are located close to the central black hole that remove energy from the accretion flow as Poynting flux (sometimes called magnetically arrested accretion). These magnetic islands are natural sites for launching relativistic jets. Based on the Telfer et al. data and the numerical simulations of accretion flows in Penna et al., the magnetic islands are concentrated between the event horizon and an outer boundary of (in geometrized units) for rapidly rotating black holes and for modestly rotating black holes.
1 Introduction
The nature of the causative agent that makes some quasars radio loud (RLQs) has challenged astrophysicists for more than 50 years. It became clear early on that the optical/ultraviolet (UV) spectra of RLQs and radio quiet quasars (RQs) are very similar (Steidel and Sargent, 1991)111There are notable small subclasses of objects that are distinct. Some RLQs have relativistic jets that propagate close to the line of sight (blazars) and the Doppler enhanced power law continuum can be significant. There are also rare objects with very broad ultraviolet absorption lines, these are almost exclusively RQs. However, in both classes these effects obfuscate a background thermal component that is very similar to other quasars.. Attempts to look for subtle differences involved statistical studies of optical and UV emission line strengths and widths (Boroson and Green, 1992; Boroson, 2002; Corbin and Francis, 1994; Corbin and Boroson, 1996; Brotherton et al, 1994). These emission regions are far from the central engine, - larger than the central black hole radius, so it is not clear what they tell us as a second order indicator of conditions in the jet launching region (Guerras et al., 2013). Are they related to the fueling mechanism for radio loudness, the ionization continuum or jet propagation? Consequently, this research path has provided very little understanding of the jet launching mechanism. Seemingly more relevant to the physics of jet launching, the extreme ultraviolet (EUV) continuum, Å , is created orders of magnitude closer to the central engine and RLQs display a significant EUV continuum deficit relative to RQs (Telfer et al., 2002), T02 hereafter.
In the following, evidence is presented that connects the EUV deficit to magnetically arrested accretion (MAA) in the innermost accretion flow of RLQs. The motivation for exploring this interpretation is that it not only explains the second order effect of an EUV deficit, but it also provides a mechanism for the first order difference between RLQs and RQs; namely arresting the flow with large scale magnetic flux is a natural way to launch the jets responsible for the radio emission. This argument is laid out as follows. Section 2 considers the EUV emission in the context in the standard interpretation of a quasar as emission from an optically thick thermal gas that accretes onto a black hole. Section 3 reviews the notion of MAA. Based on the assumption that the EUV deficit is a consequence of thermal gas being displaced by islands of large scale magnetic flux, the distribution of said islands is determined from both numerical and theoretical models of accretion flows.
2 The Thermal Interpretation of Quasar Spectra
It was convincingly demonstrated in Lynden-Bell and Rees (1971); Shakura and Sunayev (1973); Novikov and Thorne (1973) that the intense blue/UV light associated with the quasar phenomenon was likely the optically thick thermal emission from viscous dissipation of accreting gas onto a supermassive black hole. The connection between these accretion models and observation was made in Malkan (1983); Szuszkiewicz et al. (1996) where quasar spectra in the the optical to far UV were approximated by accretion disks spectra.
Our understanding of accretion disks around black holes is far from complete. Thus, this effort strives to reach conclusions that do not depend on a particular accretion model. Determination of the EUV spectrum beyond the far UV turnover had to await space-based observations of intermediate redshift quasars since ground-based observations of high redshift objects, in which the EUV is redshifted into the optical band, are unsuitable due to contamination by the Ly forrest (Zheng et al., 1997).
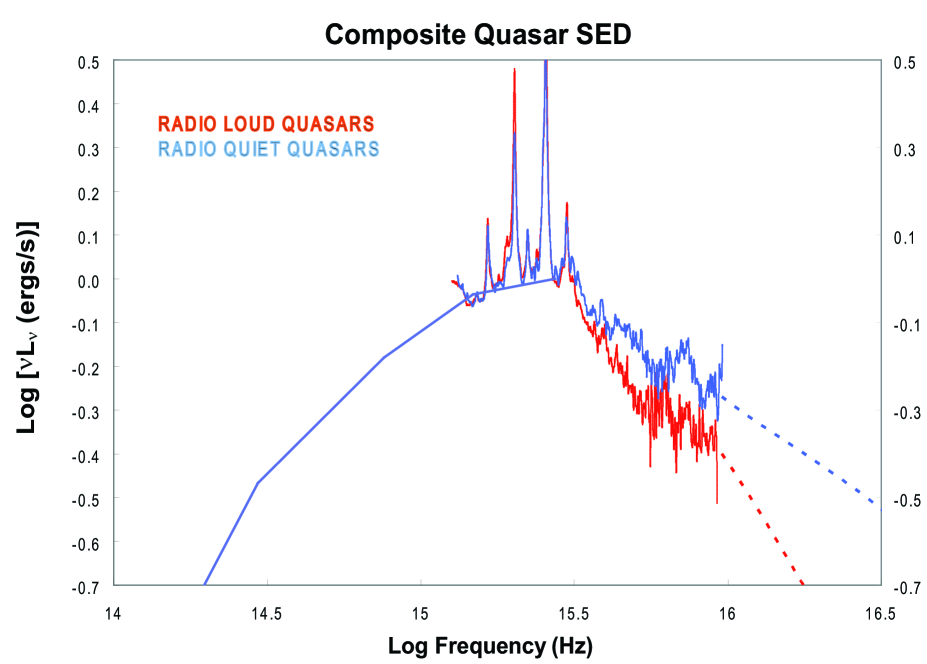
The EUV deficit in RLQs was originally found in Zheng et al. (1997) and confirmed with a much larger sample of spectra in T02. Figure 1 shows the composite RLQ (red) and RQ (blue) EUV spectra, 1100 Å to 300 Å , from Hubble Space Telescope (HST) observations of 332 spectra of 184 objects with redshift, T02222The newer HST spectra in Stevans et al. (2014) have a span of the G160L spectra (that was commonly used in T02 to bridge the far UV and EUV) and are not wide enough to use in Figure 2. The small number (8) of narrow span RLQ spectra entirely within the EUV, above the noisy spectral break at of Figure 1 (), render statistical comparison to RQs insignificant. The FUSE composite in Scott et al. (20004) has only two RLQs with coverage below 700 Å .. The quasar accretion disk composite in Figure 1 is based on the Laor et al. (1997) composite, but it is updated with the optical and IR composite quasar estimates in Davis and Laor (2011). They note the important point that the IR (dust) local maximum should be neglected in estimates of the accretion flow SED because it is likely to be the result of accretion disk emission that is reprocessed on larger scales. The UV composite is updated based on the data and discussion in T02. The small difference in the UV continuum between the RLQ and RQ composites in Laor et al. (1997) does not exist (see Figure 10 of T02) in the larger HST sample. The common continuum at frequencies below the far UV for the accretion disk composite of RQs and RLQs is represented by a black piecewise power-law fit. The EUV is the data of interest, so it is plotted explicitly as opposed to the piecewise power-law estimates elsewhere. The EUV data is normalized to 0 at 1100 Å as in T02. The SEDs above Hz show a spectral break, but they are very noisy and are not considered reliable in this region. At frequencies above Hz, where the T02 data ends, the SED is very uncertain and is indicated by faint dotted lines. These extend to the soft X-ray values (relative to the peak of the SED) from Laor et al. (1997). Since the X-ray luminosity is not considered optically thick thermal emission from the accretion flow and its value relative to the EUV is quite uncertain, it will not be plotted or considered in detail in the following.
It should be noted that both numerical and analytic models of optically thick accretion flows contain the following elements: the effective temperature increases as the radius decreases and the luminosity from each annular ring reaches a maxima near the black hole and decreases inward of this, i.e., the luminosity of the accreting gas fades before being swallowed by the black hole (Zhu et al., 2012). Thus, we expect that the maximum of the SED is not representative of the maximum temperature of the accretion flow, but there are higher temperature contributions to the SED beyond the far UV turnover from optically thick thermal gas. Thus, the rapidly falling SED in the EUV band is the electromagnetic signal of the innermost optically thick region. Consider this in the context of the broadband composite of Figure 1. The continuum of the thermal component (frequencies below Hz) of RLQs and RQs are indistinguishable except for emission from the innermost accreting optically thick gas. Thus, the difference in the EUV emission between RLQs and RQs likely arises from suppressed emission in the innermost region of the accretion flow in RLQs of what is otherwise a similar accretion flow to that found in RQs.
3 The EUV Deficit and Magnetically Arrested Accretion
The viscous dissipation that heats the plasma in accretion flows (and therefore the source of modified black body radiation) is produced as a consequence of the magneto-rotational instability (MRI) in 3-D numerical simulations (Penna et al, 2010; De Villiers et al., 2003). The discussion of the last section begs the question, what physical process in the innermost accretion flow can suppress MRI in RLQs? The answer might be MAA, Igumenshchev et al (2003); Igumenshchev (2008), or its variants MCAFs (magnetically choked accretion flows), McKinney et al (2012) and MADs (magnetically arrested disks), Tchekhovskoy et al. (2011, 2012). The accretion flow in these simulations is perforated by large scale magnetic flux tubes, magnetic islands. The islands of magnetic flux that arrest the accretion flow also suppress the MRI induced dissipation in these regions. The magnetic flux tubes torque the plasma and enhance the overall mass accretion rate. The angular momentum is converted to electromagnetic form and removed vertically from the accretion flow as a jet (Igumenshchev, 2008). Without loss of generality, consider an annular ring in the Shakura and Sunayev (1973) accretion disk, . Angular momentum is removed by viscous stress in the fluid element at a rate
| (1) |
where is the viscous stress, is the accretion rate and is the angular velocity. Now consider the existence of magnetic islands that fill a fraction, , of the volume of the ring, , and penetrate a fraction, , of the top and bottom surface areas of the annular volume, . The volume of magnetic islands is and its complement in is , . The surface area elements of the top and bottom faces are, and , respectively. The angular momentum equation becomes
| (2) |
where, and are the azimuthal and vertical magnetic field components, respectively. For fixed in Equations (2) and (3), even though the volume of plasma experiencing viscous dissipation is reduced, accretion proceeds at an equal rate in the magnetically arrested state.
Simulated MAD accretion flows are subsonic and therefore do not produce significant gas heating from shocks (McKinney et al, 2012; Punsly and Rodriguez, 2013). Thus, the reconnection of the locally tangled field driven by the MRI is the primary source of heat creation at the boundary of the magnetic islands and in the accreting gas. However, the interior of the magnetic islands are not regions of local MRI driven heating. The total volume available for MRI induced viscous heating is reduced by the magnetic islands. Therefore, the MRI suppression in magnetically arrested flows indicate states of lower radiative efficiency relative to standard accretion states without magnetic islands. The magnetic islands radiate Poynting flux along the magnetic field lines. Again consider the annular ring above. The total energy flux, , has two components, where is the flux of radiation as in a standard accretion disk and is primarily poloidal Poynting flux along the magnetic field direction, (Igumenshchev, 2008). Similarly, the total luminosity of the ring also has two components:
| (3) |
The first term on the RHS of Equation (3) is the usual term from standard accretion theory that gives rise to the radiation (such as EUV). The second term is the vertical jet emission. For any approximately axisymmetric MHD Poynting flux dominated jet, regardless of the source, the total integrated electromagnetic poloidal energy flux is
| (4) |
where is the total magnetic flux enclosed within the jet, is the cross-sectional area element and is a geometrical factor that equals 1 for a uniform highly collimated jet (Punsly, 2008). Thus, not only do the magnetic islands of large scale poloidal flux in the inner accretion flow suppress radiation from this region, but they provide a source of Poynting flux (power for the jet) as they orbit around the black hole with an angular velocity, . The local physics that produces the turbulent viscosity, , in is unchanged from standard accretion and therefore so is . Thus, from Equations (1) - (4), in the magnetically arrested case, the radiative luminosity is of what it would be for standard accretion with the same mass accretion rate.
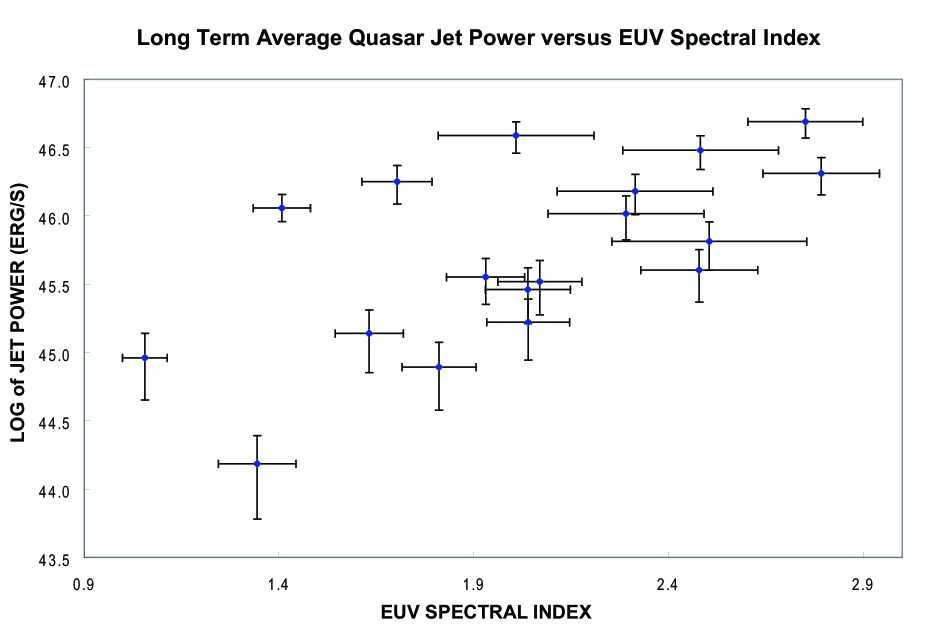
If MAA is the source of the EUV deficit, one would expect a correlation (perhaps weak) between the EUV spectral index, , and jet power within the RLQ population. In Figure 2, () derived from individual spectra in the HST archives (downloaded through MAST) is plotted against estimates of the long term time average of the jet power, . In order to get a meaningful estimate of , a range of at least 700 Å to 1100 Å in the quasar rest frame was needed to extract the continuum from the numerous broad emission lines documented in T02. Therefore, a redshift of is required. Troughs from Lyman limit systems (LLS) were removed by assuming a single cloud with a opacity. This was considered acceptable if the power law above the LLS could be continued smoothly through the corrected region. If there were many strong absorption systems or an LLS that compromised a broad emission line, this simple procedure was deemed inadequate for continuum extraction with the available data and the spectrum was eliminated from the sample. A small correction for the Lyman valley was also made per the methods of Zheng et al. (1997). Additionally, if there was evidence of a blazar synchrotron component contribution to the continuum (high optical polarization or variability, superluminal motion or gamma ray activity), the underlying accretion disk continuum was considered too uncertain for the sample.
The most reliable methods of estimating are based on the the optically thin emission from relaxed radio lobes (Willott et al., 1999). Thus, all sources in the sample needed proof of extended emission on scales larger than the host galaxy so that the lobes can relax ( kpc). The proof was derived from archival high resolution interferometry images made between 0.408 GHz and 5 GHz. The HST and radio selection criteria resulted in a total of 18 sources for the sample. The optically thin emission was estimated based on 151 MHz - 178 MHz flux densities (if available) and the lobe fluxes from the radio images. The largest spread in the estimates of , based on optically thin extended emission, are bounded on the high side by the Willott et al. (1999) estimate for their parameter, f = 20, and on the low side by Punsly (2005), which assumes that the lobes are inertially dominated. These two extremes are used to generate the errors bars on in Figure 2 (Punsly and Rodriguez, 2013). The correlation in the scatter in Figure 2 is statistically significant at the 0.987 level by a Spearman rank correlation test, while the correlations of with z and spectral luminosity, , are significant at the 0.842 and 0.720 levels, respectively for the same sample. The large scatter in Figure 2 is expected on many grounds: the ejections producing are not contemporaneous with the the HST spectrum, as well as variations in the quasar host EUV absorption, , black hole masses, (), and spins ().
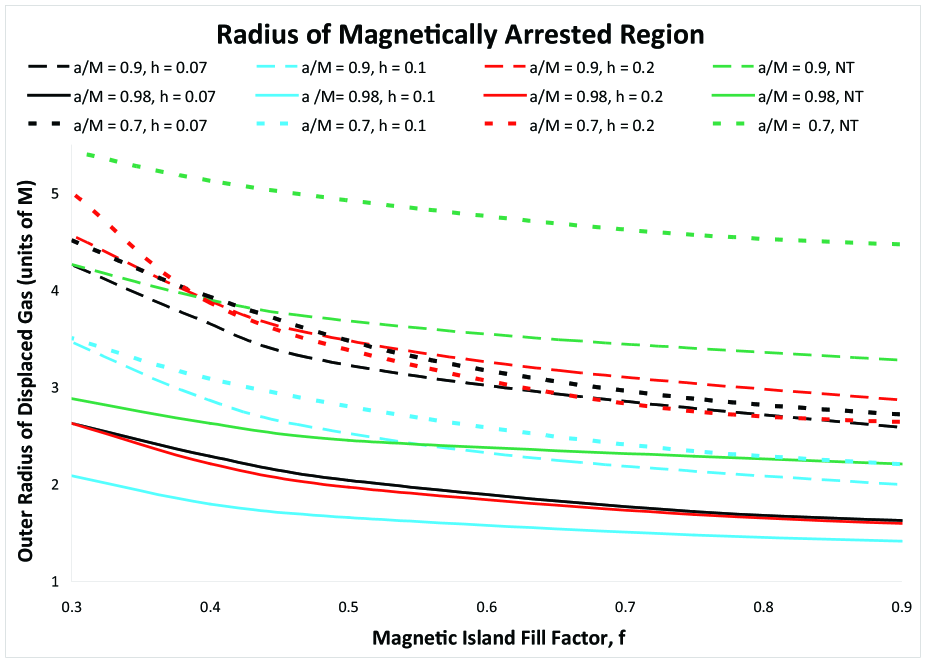
Since a magnetically arrested innermost accretion flow naturally explains the suppressed EUV and jet production, it is of interest to estimate the size of the region of suppressed radiation. From, the composites in Figure 1, the EUV deficit in RLQs is of the optically thick accretion flow333The emission line contribution to is chosen to be 25% of the optical/UV luminosity (Zheng et al., 1997). The X-ray contribution to is ignored as discussed in Section 2. Ignoring the X-ray luminosity of the accretion flow proper will affect the estimates by 10% (Laor et al., 1997; Davis and Laor, 2011).. Consider excising a fraction, , of the innermost accretion flow in various models of accretion disks in Figure 3. The simulations of accretion disks in Penna et al (2010) include luminosity from the plunge region inside of the innermost stable orbit (ISCO) and are parameterized by and the disk thickness defined by their parameter, . The Novikov and Thorne (1973), NT, models do not include a plunge region. Note that the putative magnetically arrested region must be concentrated at the smallest radii, since the EUV is suppressed in RLQ composite of Figure 1, but not the UV and optical. The plausible range of, , near the black hole is based on the simulations presented in Igumenshchev (2008); Punsly et al (2009). The putative magnetic islands would have to be concentrated between the event horizon and an outer boundary of if and if to account for the 4.5% luminosity suppression in RLQs.
It should be noted that, unlike the simulations in Igumenshchev (2008); Punsly et al (2009), the simulations in McKinney et al (2012); Tchekhovskoy et al. (2011, 2012) that are heavily seeded with large scale magnetic flux are devoid of magnetic islands this close to the event horizon. This is evidenced by the claim in McKinney et al (2012) that no significant Poynting flux emerges from this region (see Equation 4, above) as well as the linked online videos of the simulations. The videos show the innermost significant magnetic island concentrations are around and they are extremely transient. This either means that the interpretation of the EUV deficit presented here is wrong or the simulations do not represent the magnetic flux evolution accurately. Using fusion and solar physics as a guide, the latter seems quite likely since these simulations are based on simple single fluid ideal MHD (Yamada, 2007; Malakit, 2009; Bauman et al, 2013; Threlfall et al., 2012). Even more important, the two most relevant dynamic elements for large scale, poloidal, magnetic flux evolution near the black hole, reconnection and diffusion of mass onto the field lines, occur as a consequence of numerical diffusion in the simulations and not an actual physical process.
4 Discussion
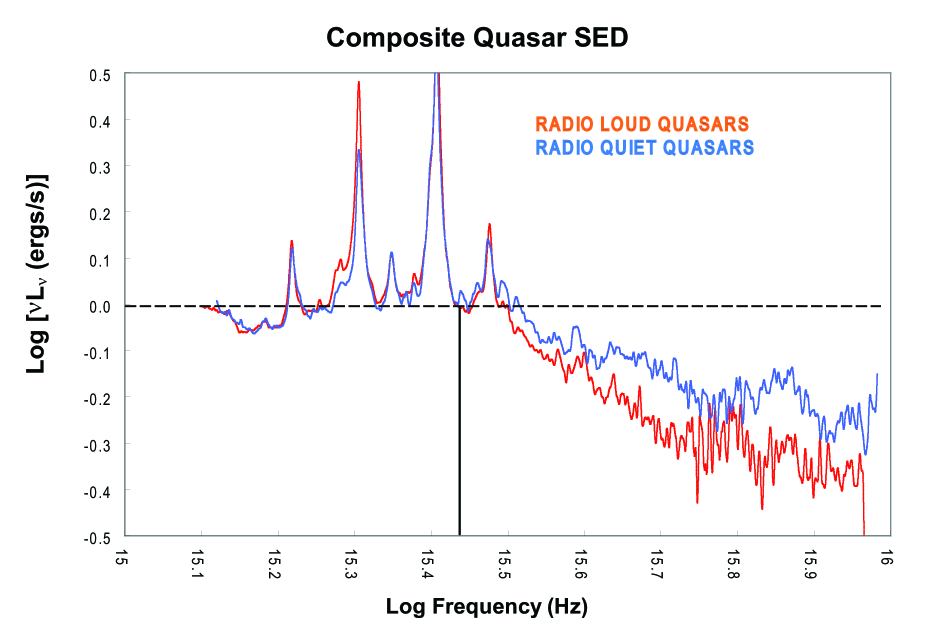
In this paper, the EUV deficit in RLQ SEDs was argued to arise from a deficit of optically thick thermal gas in the innermost accretion flow. It was posited that islands of large scale magnetic flux near the black hole, like those that occur in some numerical simulations, would explain this missing volume of optically thick thermal gas and also explain the radio jet launching mechanism. As a further consequence it was argued in Punsly (1999) that the presence of magnetic flux in the inner accretion disk will diminish the power of radiation driven winds that appear to be common in RQs. It is not claimed that this is the only explanation of the EUV deficit. However, none of the alternatives naturally produce a radio jet. Other explanations based on numerical and theoretical models include, lower in RLQs (larger ISCO), a stronger quenching wind in RLQs per the model of Laor and Davis (2014) or higher and lower in RLQs. Using a sample of QSOs McLure and Jarvis (2004) found that the mean of RLQs is 1.45 that of of RQs with large scatter. In disk models, larger M shifts the peak of the SED to lower frequency, therefore causing a decrease in the EUV. However, it was shown in Davis and Laor (2011); Laor and Davis (2014), based on PG quasars, that black hole mass variations produce much smaller changes in the far UV turnover region of the spectrum than expected from accretion disk models. Thus the issue needs to be addressed empirically. In Figure 4, the T02 composites are overlayed. The location of the SED peak and the curvature of the continuum long-ward of the peak are indistinguishable contrary to the notion that a disk temperature shift results in the EUV deficit. Furthermore, if the mass difference is the source of the EUV deficit, the correlation in Figure 2 would be a coincidence.
The basic idea presented here does not depend on any particular accretion model. The observational data indicates that the only significant difference in the optically thick thermal continuum between the RQ and RLQ composite spectra is a deficit of the highest temperature gas (the EUV) in RLQs. This must be created by the innermost optically thick gas independent of the model. A plausible explanation is the displacement of this gas by the large scale magnetic flux of the radio jet at its launch site.
References
- Bauman et al (2013) Baumann, G., Galsgaard, K. & Norlund, A., 2013 Solar Physics 284 467
- Boroson and Green (1992) Boroson, T. and Green, R. 1992, ApJS 80 109
- Boroson (2002) Boroson, T. 2002, ApJ 565 78
- Brotherton et al (1994) Brotherton, M., Wills, B. Steidel, C. and Sargent, W. 1994, ApJ 423 131
- Corbin and Francis (1994) Corbin, M. and Francis, P. 1994, AJ 108 2016
- Corbin and Boroson (1996) Corbin, M. and Boroson, T. 1996, ApJS 107 69
- Czerny and Elvis (1987) Czerny, B. and Elvis, M. 1987, ApJ 321 305
- Davis and Laor (2011) Davis, S., Laor, A. 2011, ApJ 728 98
- De Villiers et al. (2003) De Villiers, J-P., Hawley, J., Krolik, 2003, ApJ 599 1238
- Guerras et al. (2013) Guerras, E. et al. 2013, ApJ 764 160
- Igumenshchev (2008) Igumenshchev, I. V. 2008, ApJ 677 317
- Igumenshchev et al (2003) Igumenshchev, I. V., Narayan, R. and Abramowicz, M. A. 2003, ApJ 592 1042
- Laor et al. (1997) Laor, A. et al 1997, ApJ 477 93
- Laor and Davis (2014) Laor, A., Davis, S. 2014, ApJ 428 3024
- Lynden-Bell and Rees (1971) Lynden-Bell, D., Rees, M. 1971, MNRAS 152 461
- Malakit (2009) Malakit, K., Cassak, P., Shav, M., Drake, F. 2009, Geosphysical Research Letter 36 L07107
- Malkan (1983) Malkan, M. 1983, ApJ 268, 582
- McLure and Jarvis (2004) McLure, R. and Jarvis, M. 2004, MNRAS 353, L45
- McKinney et al (2012) McKinney, J., Tchekhovskoy, A., Blandford, R. 2012, MNRAS 423 3083
- Novikov and Thorne (1973) Novikov, I. and Thorne, K. 1973, in Black Holes: Les Astres Occlus, eds. C. de Witt and B. de Witt (Gordon and Breach, New York), 344
- Penna et al (2010) Penna, R. et al 2010, MNRAS 408 752
- Punsly (1999) Punsly, B. 1999, ApJ 527 609
- Punsly (2005) Punsly, B. 2005, ApJL 623 9
- Punsly (2008) Punsly, B. 2008, Black Hole Gravitohydromagnetics, second edition (Springer-Verlag, New York)
- Punsly et al (2009) Punsly, B., Igumenshchev, I. V., Hirose, S. 2009, ApJ 704, 1065
- Punsly and Rodriguez (2013) Punsly, B., Rodriguez J. 2014, ApJ 783, 113
- Scott et al. (20004) Scott, J. et al. 2004, ApJ 615, 135
- Shakura and Sunayev (1973) Shakura, N., Sunayev, R. 1973, A& A 24 337
- Steidel and Sargent (1991) Steidel, C. and Sargent, W., 1991 ApJ 383 433
- Stevans et al. (2014) Stevans, M., Shull, M., Danforth, C., Tilton, E. 2014, ApJ 794 75
- Szuszkiewicz et al. (1996) Szuszkiewicz, E., Malkan, A., and Abramowicz, M. A. 1996, ApJ 458 474
- Tchekhovskoy et al. (2011) Tchekhovskoy, A., Narayan, R. and McKinney, J. 2011, MNRAS Letters 418 79
- Tchekhovskoy et al. (2012) Tchekhovskoy, A.,McKinney, J. 2012, MNRAS Letters 423 55
- Telfer et al. (2002) Telfer, R., Zheng, W., Kriss, G., Davidsen, A. 2002, ApJ 565 773 T02
- Threlfall et al. (2012) Threlfall, J. et al 2012, A & A 544 24
- Yamada (2007) Yamada, M.2007, Physics of Plasmas 14 058102
- Zheng et al. (1997) Zheng, W. et al. 1997, ApJ 475 469
- Zhu et al. (2012) Zhu, Y. et al. 2012, MNRAS 424 2504
- Willott et al. (1999) Willott, C., Rawlings, S., Blundell, K., Lacy, M. 1999, MNRAS 309 1017