Microwave pinning modes near Landau filling in two-dimensional electron systems with alloy disorder
Abstract
We report measurements of microwave spectra of two-dimensional electron systems hosted in dilute Al alloy, AlxGa1-xAs, for a range of Landau level fillings, , around 1. For or , the samples exhibit a microwave resonance whose frequency decreases as moves away from 1. A resonance with this behavior is the signature of solids of quasiparticles or -holes in the partially occupied Landau level, which was previously seen in ultralow disorder samples. For down to as low as , a resonance in the spectra is still present in the Al alloy-disordered samples, though it is partially or completely suppressed at and , and is strongly damped over much of this range. The resonance also shows a striking enhancement in peak frequency for just below 3/4. We discuss possible explanations of the resonance behavior for in terms of the composite fermion picture.
pacs:
73.43.Jn,71.70.Di,73.43.LpIn two-dimensional electron systems (2DES) in high magnetic field, , Wigner solidslozo ; lamgirvin ; kunwc ; narevichfertig ; jaincfwc ; archer1 ; archer2 ; reentrant ; vgwc ; buhmann ; kukushkinwctri ; ee ; williams91 ; willett1 ; willett2 ; lessc ; clibdens ; yewc ; murthyrvw ; msreview pinned by residual disorder occur for sufficiently small Landau level filling factor, . At the low termination of the fractional quantum Hall effect (FQHE) series, such a solid can appear in dc transport as an insulating phase. By means of microwave spectroscopy like that employed to obtain the data in this paper, Wigner solids of dilute quasiparticles or quasiholes in the presence of one or more filled Landau levels have also been foundyongiqhwc ; hanskyrme ; ruperti3 , in extremely high mobility, low disorder 2DES. This type of solid has been named an integer quantum Hall effect Wigner solid (IQHEWS) since the vanishing diagonal conductivity in the wings of the integer quantum Hall effect (IQHE) diagonal conductivity minimum is due to the pinning of the solid. An analogous solid composed of quasiparticles and -holes of the 1/3 fractional quantum Hall liquid has also been reportedhanfqhe .
Microwave spectroscopy is known to directly measure pinned solids in high magnetic field, since these solids exhibit resonances in their microwave spectra ee ; williams91 ; yewc ; yongiqhwc ; bubres ; ruperti3 ; hanfqhe ; hanskyrme . The resonances are understood as pinning modeswilliams91 ; willett1 ; willett2 ; lessc ; clibdens ; yewc ; flr , in which pieces of the solid oscillate within the disorder potential. The frequency, , of the pinning mode is determined by the disorder in the sample and by the stiffness of the solid. always increases when the disorder strength is increased, but in weak pinning theoryflr ; chitra ; fertig ; foglerhuse when the solid is made stiffer, decreases. This behavior, verified experimentallyclibdens ; yewc ; yongiqhwc , occurs because for a stiffer crystal the carrier is less closely associated with disorder potential features. In the case of the IQHEWSyongiqhwc ; hanskyrme , near the quasiparticle or -hole density is where , and is the carrier density of the 2DES. Hence the generic behavior of the IQHEWS is that is largest near the integer , and the resonance initially increases in strength as one moves away from integer and increases. At still larger , above 0.15 in low disorder samplesyongiqhwc near , the resonance fades away as the carriers become dense enough for the solid to melt.
Earlier reports of IQHEWS have been on quantum well samples of the highest quality. These includehanskyrme a 50 nm well, with mobility cm2/V-s, and a 30 nm well with cm2/V-s. Here we report IQHEWS, identified from microwave spectroscopy, in samples with far lower mobility, and cm2/V-s. The samples used in this work contain the 2DES in dilute Al alloy, AlxGa1-xAs, so the isoelectronic Al impurities provide an additional component of the overall disorder. The length scales of this scattering potential are much less than the magnetic length, , under all conditions in this paper.
This paper shows that even with the Al alloy disorder, for the resonances mainly follow the behavior expected of an IQHEWS resonance, with increasing as is approached. vs , also shows inflections likely due to skyrmion crystallizationhanskyrme . Furthermore, more detailed study of the pinning resonance also shows that relative to samples without Al, the resonance range is greatly extended on the hole side () down to . In this extended range, the behavior of the resonances is more complex than was reportedyongiqhwc in Al-free samples, and the interpretation may require phase transitions within the solid. As decreases below 0.8, the trend of decreasing reverses, and vs develops a strongly disorder-dependent maximum for just below . The resonance also is suppressed or partly suppressed at and . Particularly away from and from the maximum in vs , the resonance is highly damped with a rapid rise at low frequency, , in real diagonal conductivity, . We observed such a highly damped resonance in the ranges of between and reportedwanlireentrant to exhibit insulating behavior in the partially filled Landau level in dc transport
We present data from two samples with AlxGa1-xAs channels. Samples from the same wafers were used in earlier work in dc transport wanliscatt ; wanlisclg ; wanlisclganderson ; wanlisclgcross ; wanlireentrant . Characterizationwanliscatt of the samples at showed that the spatial distribution of the Al is random. Both samples are single heterojunctions with the 2DES approximately 180 nm below the top surface of the sample. One sample has %, density cm-2 and as cooled mobility about cm2/V-s; the other sample has %, cm-2 and cm2/V-s. A previous paperbyounglonu showed that samples from this series exhibit pinning mode resonances at the low termination of the FQHE series, which for these disordered samples occurred for below that of the 1/3 FQHE. The presence of disorder is known to raise the at which the FQHE series is terminated in an insulator. At least for samples grown in the same series, for which the component of disorder not due to the Al was the same, additional Al raised , as one would expect for a pinning mode.
Microwave spectra of the complex diagonal conductivity , were obtained from the propagation characteristics of a transmission lineee that is capacitively coupled to the 2DES. The transmission line we used is shown schematically in Fig. 1a. The lines are of the coplanar waveguide (CPW) type clibdens ; yewc ; yongiqhwc ; bubres ; ruperti3 ; hanfqhe ; hanskyrme ; zhwimbal , with a center conductor separated from two broad ground planes by slots of width m, and are patterned directly onto the top of the sample. We present complex diagonal conductivity calculated from the model of ref. zhwimbal, for the CPW coupled to the 2DES. The results are within about 25% of those from the high frequency low loss approximation, , where is a complex transmission coefficient, is the characteristic impedance calculated from the transmission line geometry for , and is the length of the coplanar waveguide ( mm). is normalized to the transmission at , at which vanishes due to the IQHE. For all measurements, the 2DES temperature was approximately 60 mK, as read by nearby resistance thermometers. Slight broadening of the resonance could be discerned on increasing the temperature above that value. We verify that the data were taken in the low microwave power limit, in which further decrease of power does not affect the measured spectrum.
Figure 1b shows Re vs for the two samples, both taken at 100 MHz. Re for the sample shows a broad minimum at the IQHE, and FQHE minima at and . The curve is composed of points read off from spectra taken at discrete , and the density of points gives the traces an artifactual jagged appearance near and . The width of the IQHE minimum is about 0.3 in , measured from halfway up the rises on either side. The trace from the sample shows a much wider IQHE around , with -width measured the same way of 0.56. The FQHE at 2/3 or 3/5 is not apparent, though there are minima near 4/3 and 5/3. For both traces, the IQHE minimum is well-developed but appears at Re slightly elevated from that at ; we ascribe this to weak, -dependent parallel conduction in the wafers.
Figure 2a is an image plot of spectra, Re vs , for between 0.6 and 1.4 for the sample. The trace in Fig. 1b is a 0.1 GHz cut of this image. There are clear resonances on each side on , which decrease in as moves farther from 1. As goes above 1.2, the resonance fades into a flat spectrum. In contrast, as goes below , Re vs continue to exhibit maxima.
Re spectra for all and are shown in Fig. 3a. For between 0.8 and 2/3, Re shows a strongly asymmetric peak, with rapid rise at low and a high tail, whose extent is dependent. At 2/3 the spectrum becomes flat. The asymmetric peak reappears for , but weakens for the lowest trace at 0.61.
The color image in Fig. 2b gives an overview of the Re spectra for the sample, and the spectra for are plotted as curves in Fig. 4a. Between and , and also between between and there is a resonance whose increases as is approached. As goes below 0.8, the resonance moves to higher , with a maximum around . As 2/3 is approached from higher the resonance decreases in frequency and gradually becomes asymmetric. A resonance is present at 2/3 and 3/5, which lie within the low- IQHE plateau, but these rational fractional are easily distinguished in Fig. 2b by their reduced overall Re.
To characterize the spectra it is useful to perform fits to extract resonance parameters, particularly when the resonances are asymmetric and broad. Figures 3b and 4b show Im vs at several fillings as marked. The Im spectra can be fit to the imaginary part of the response of a Drude-Lorentz harmonic oscillator aandm , , a form commonly used aandm for dielectrics, where the parameters and are the amplitude and line width. The corresponding real part, with the same fit parameters, fit the Re spectra to within frequency-independent additive constants. The fit, common for lossy dielectrics aandm was chosen empirically, and is not readily connected to theoretically derived formschitra of pinning modes for weak disorder in high , possibly since these existing theories are specific to the weak disorder limit.
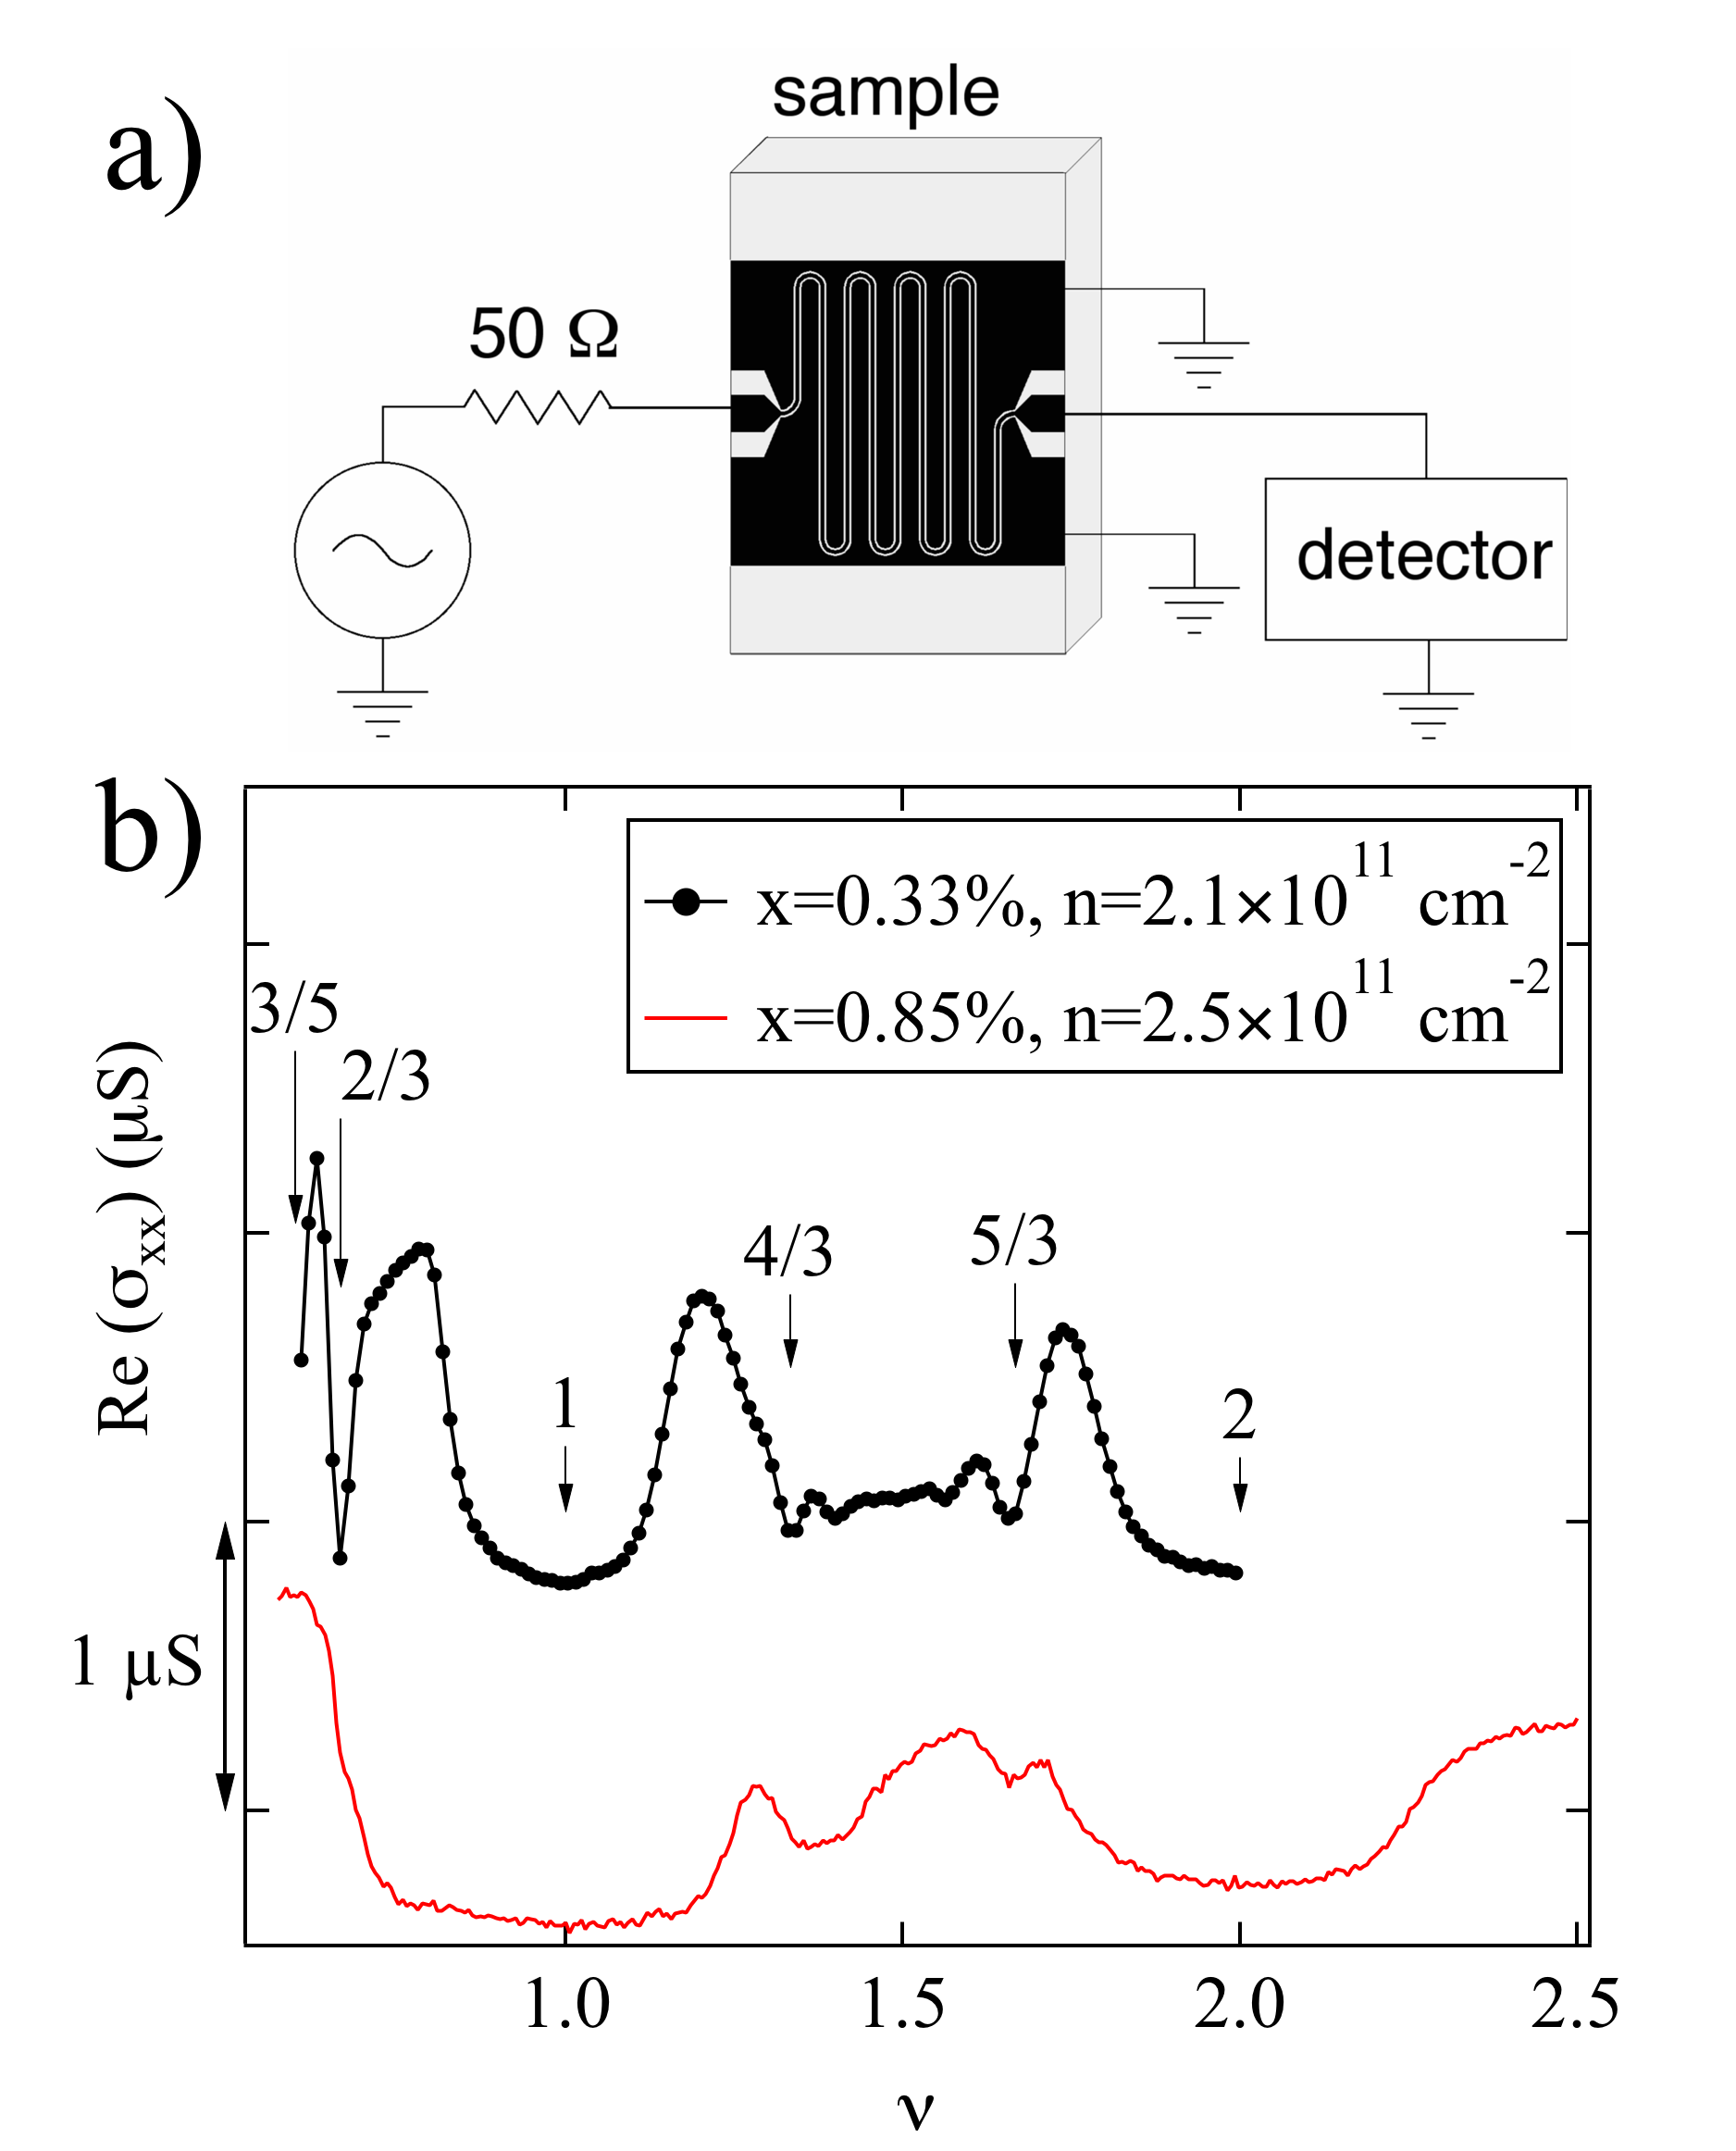
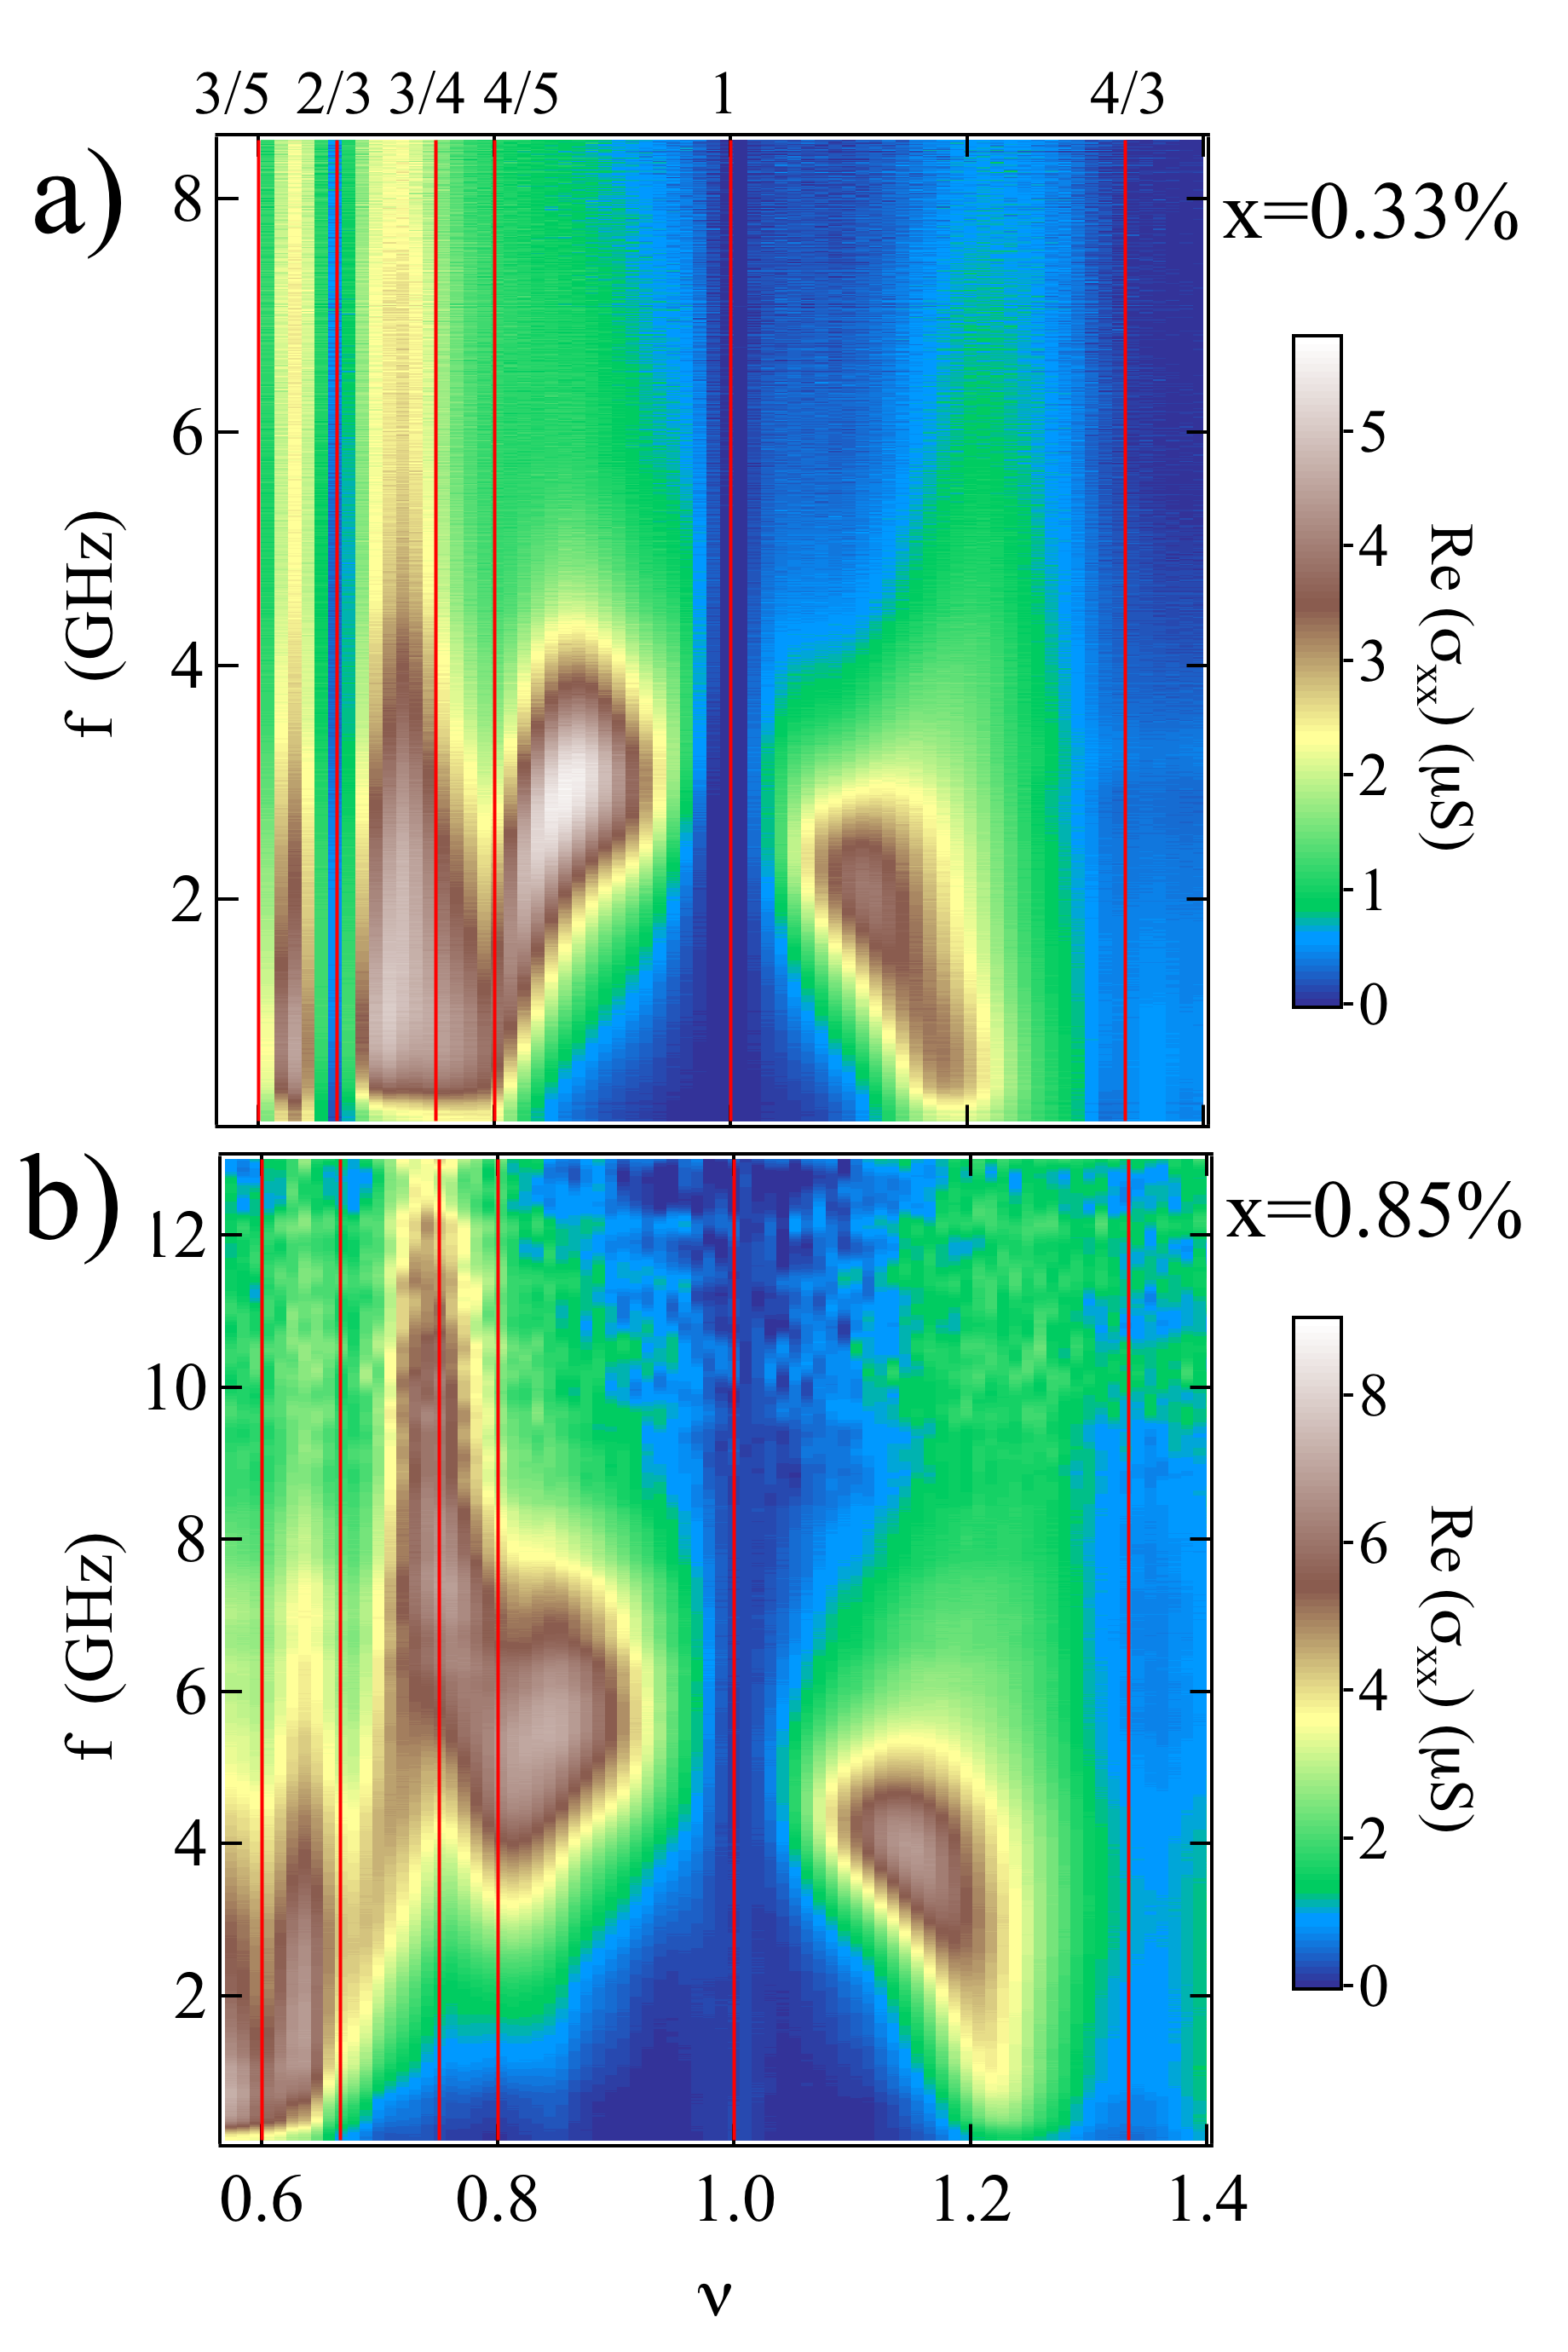
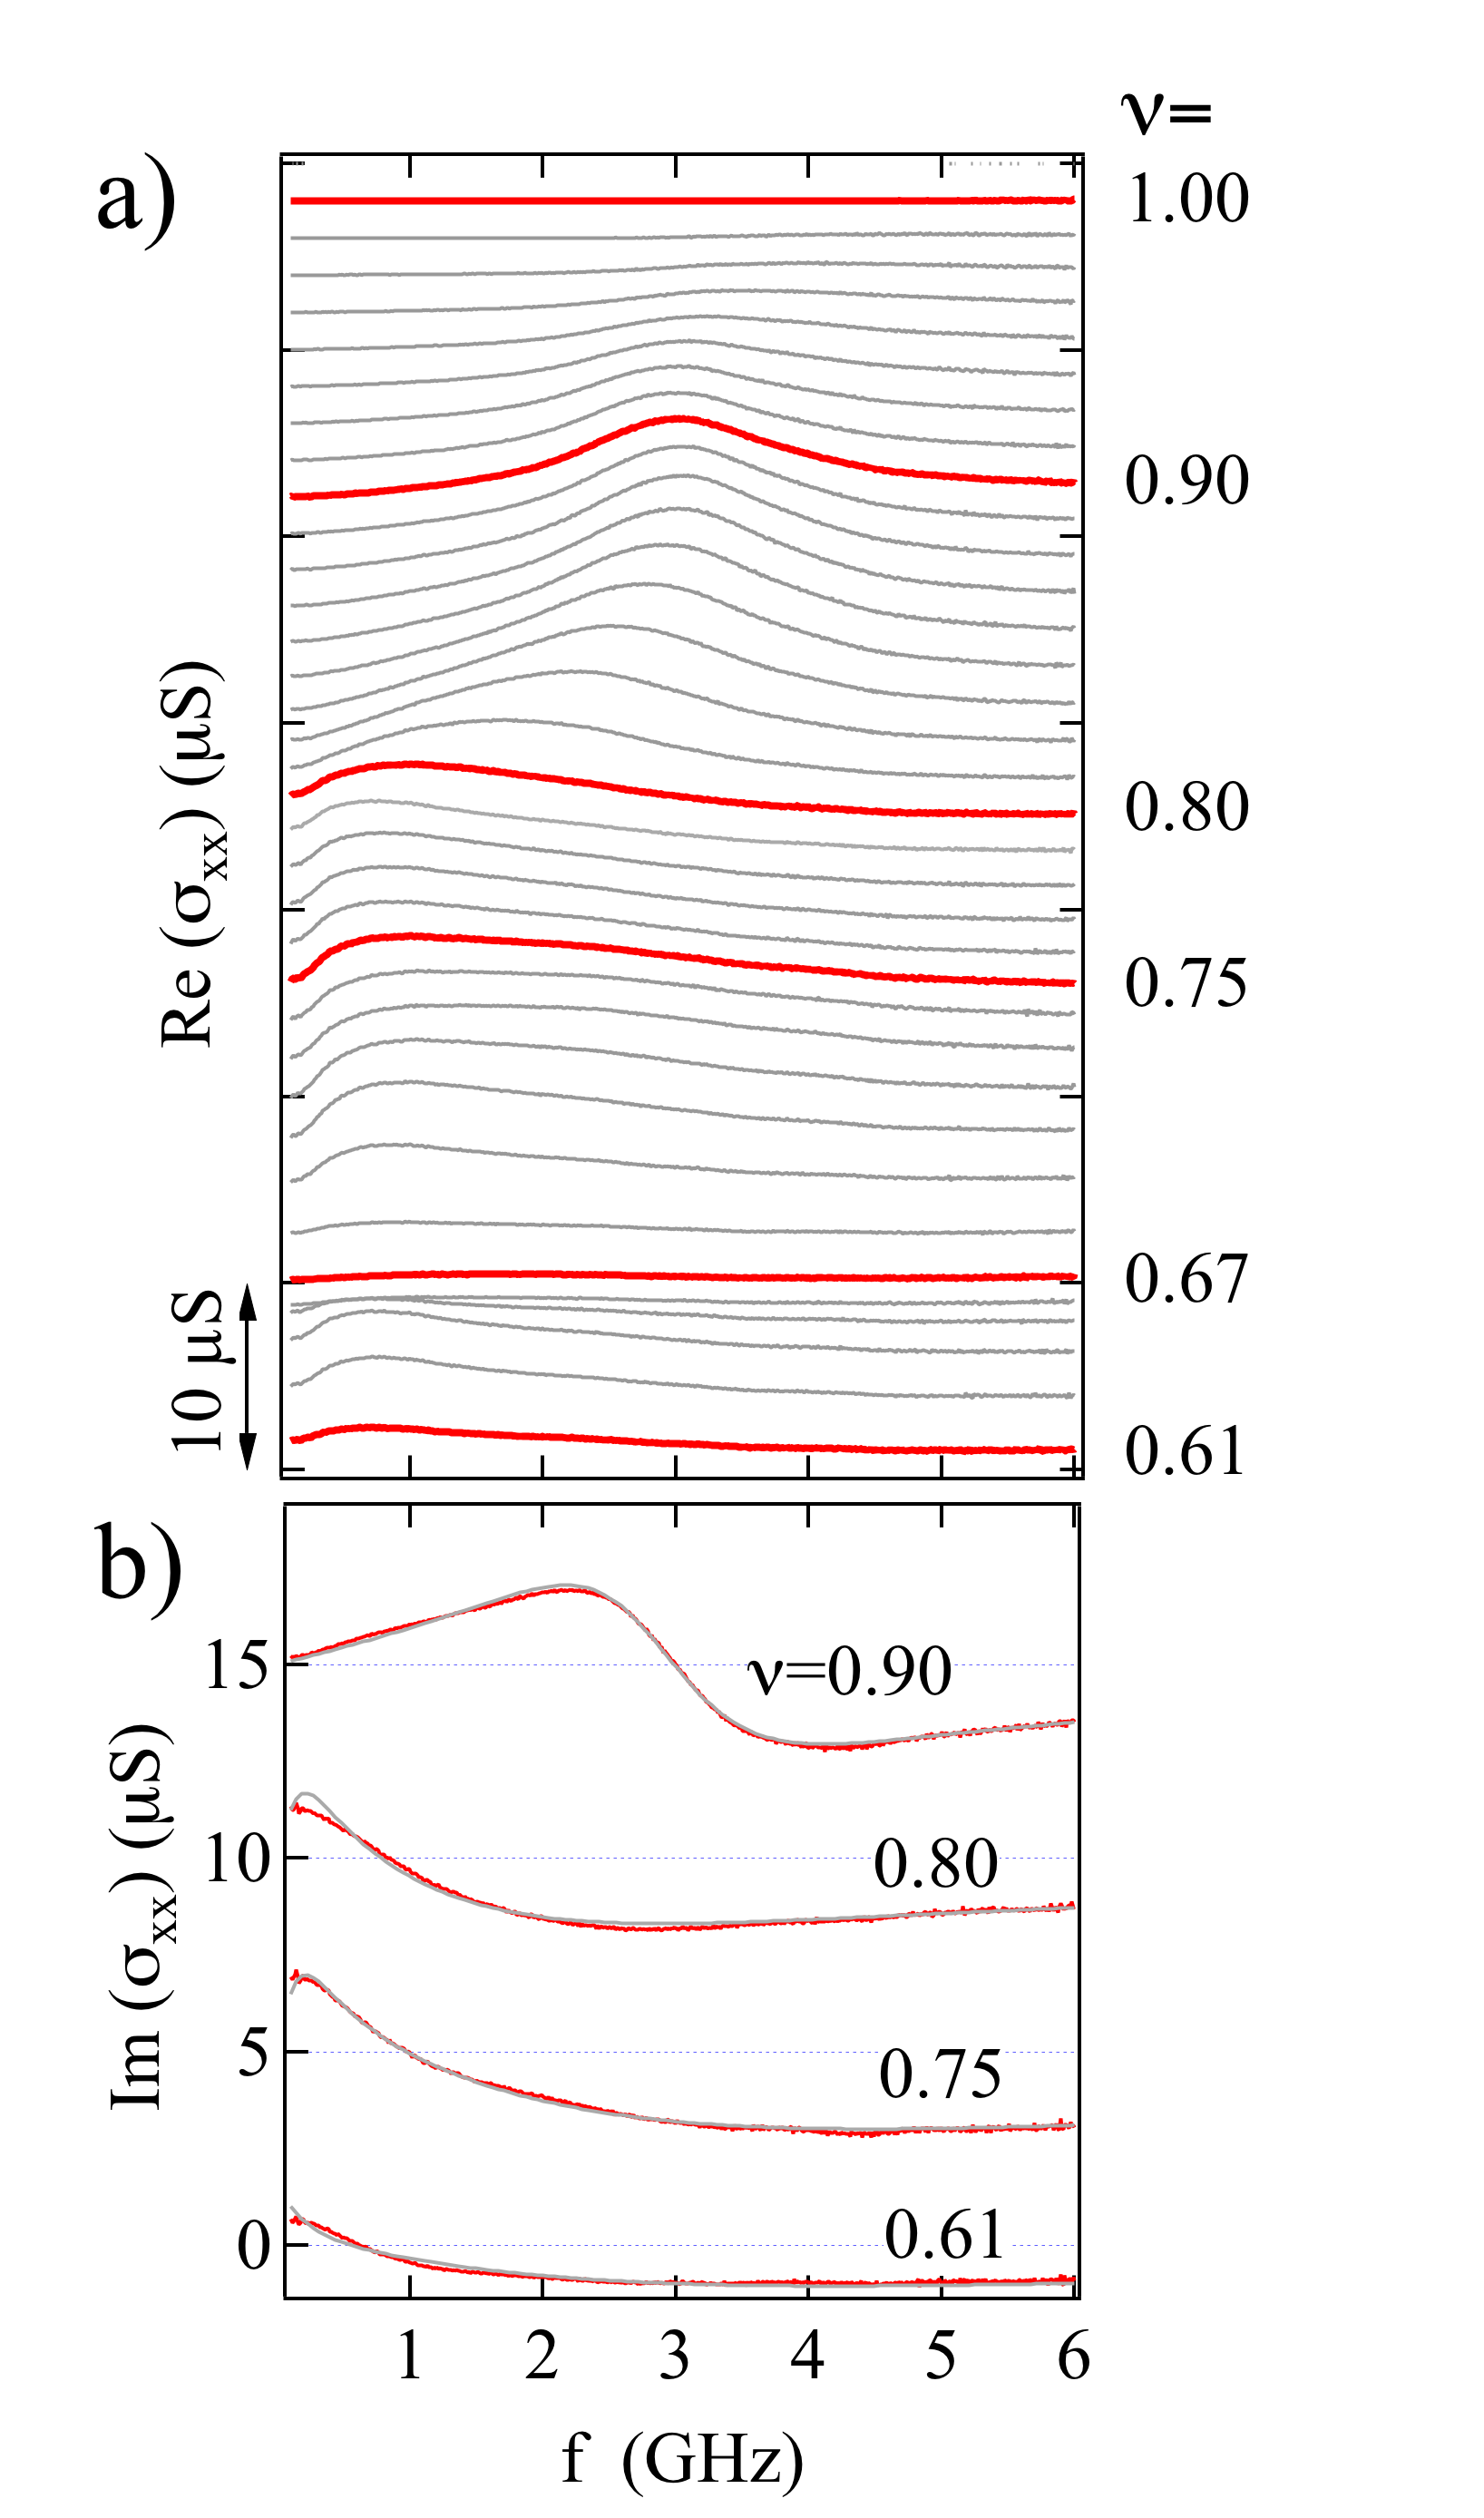
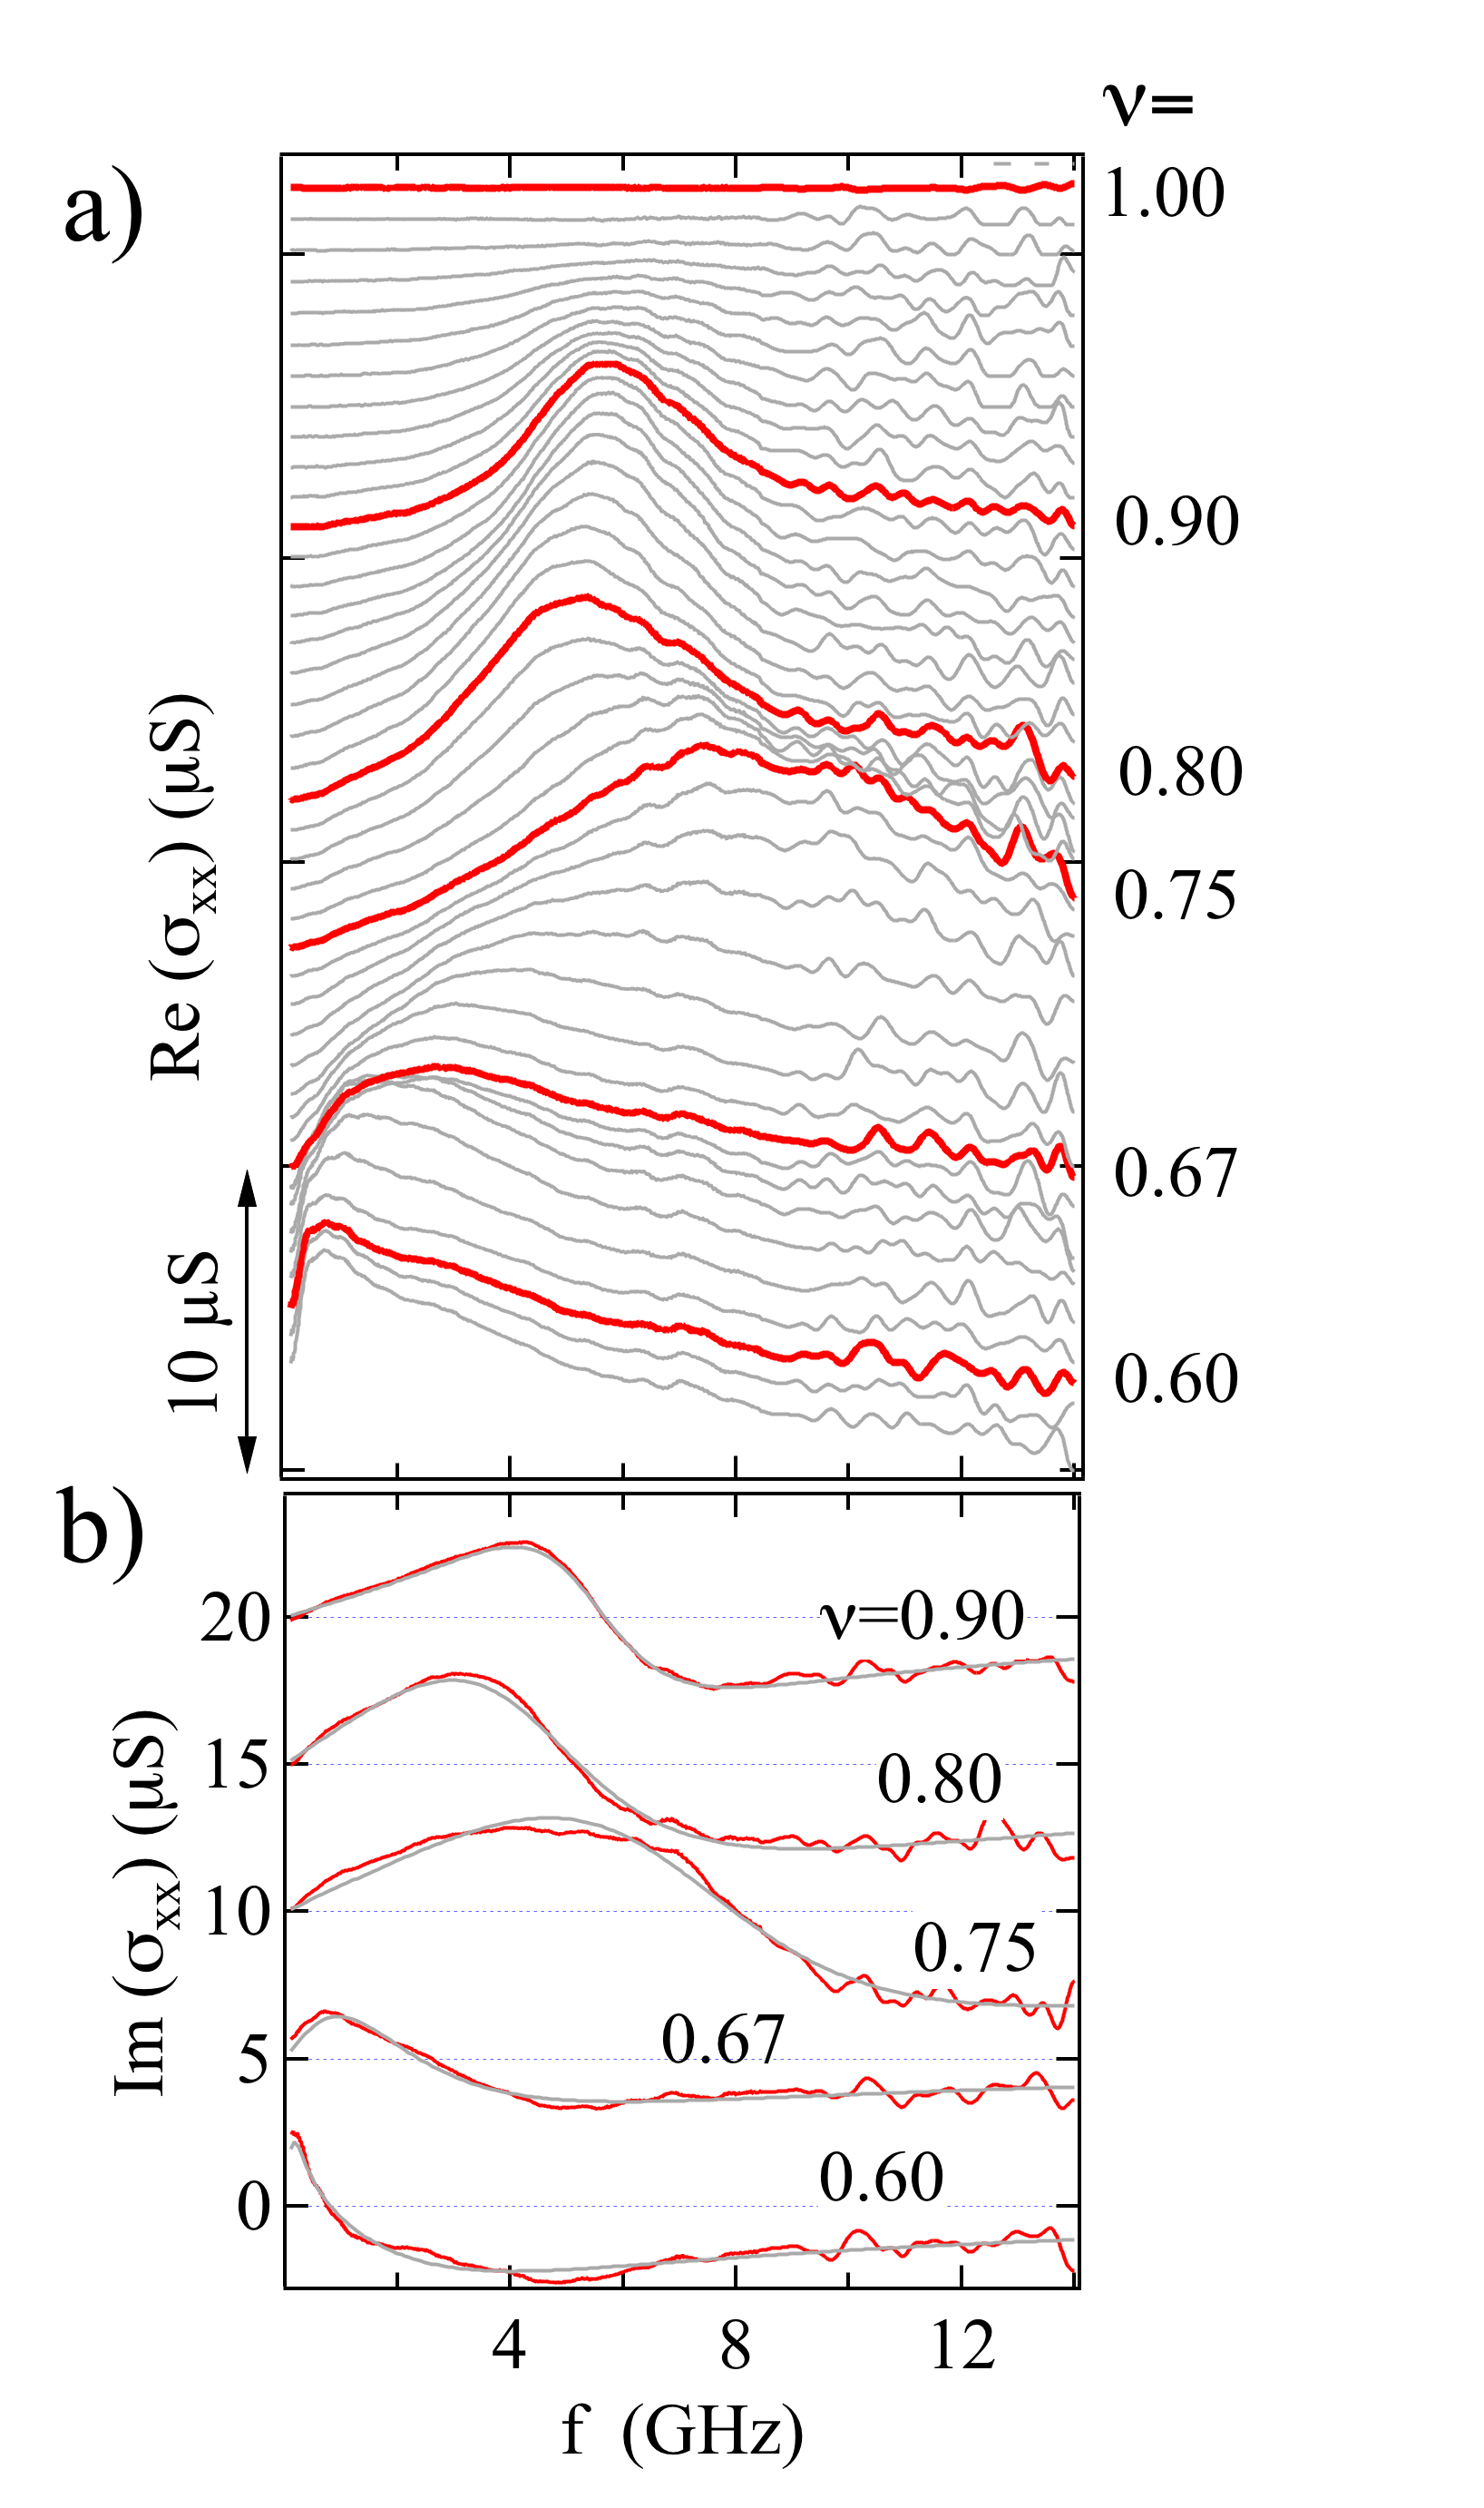
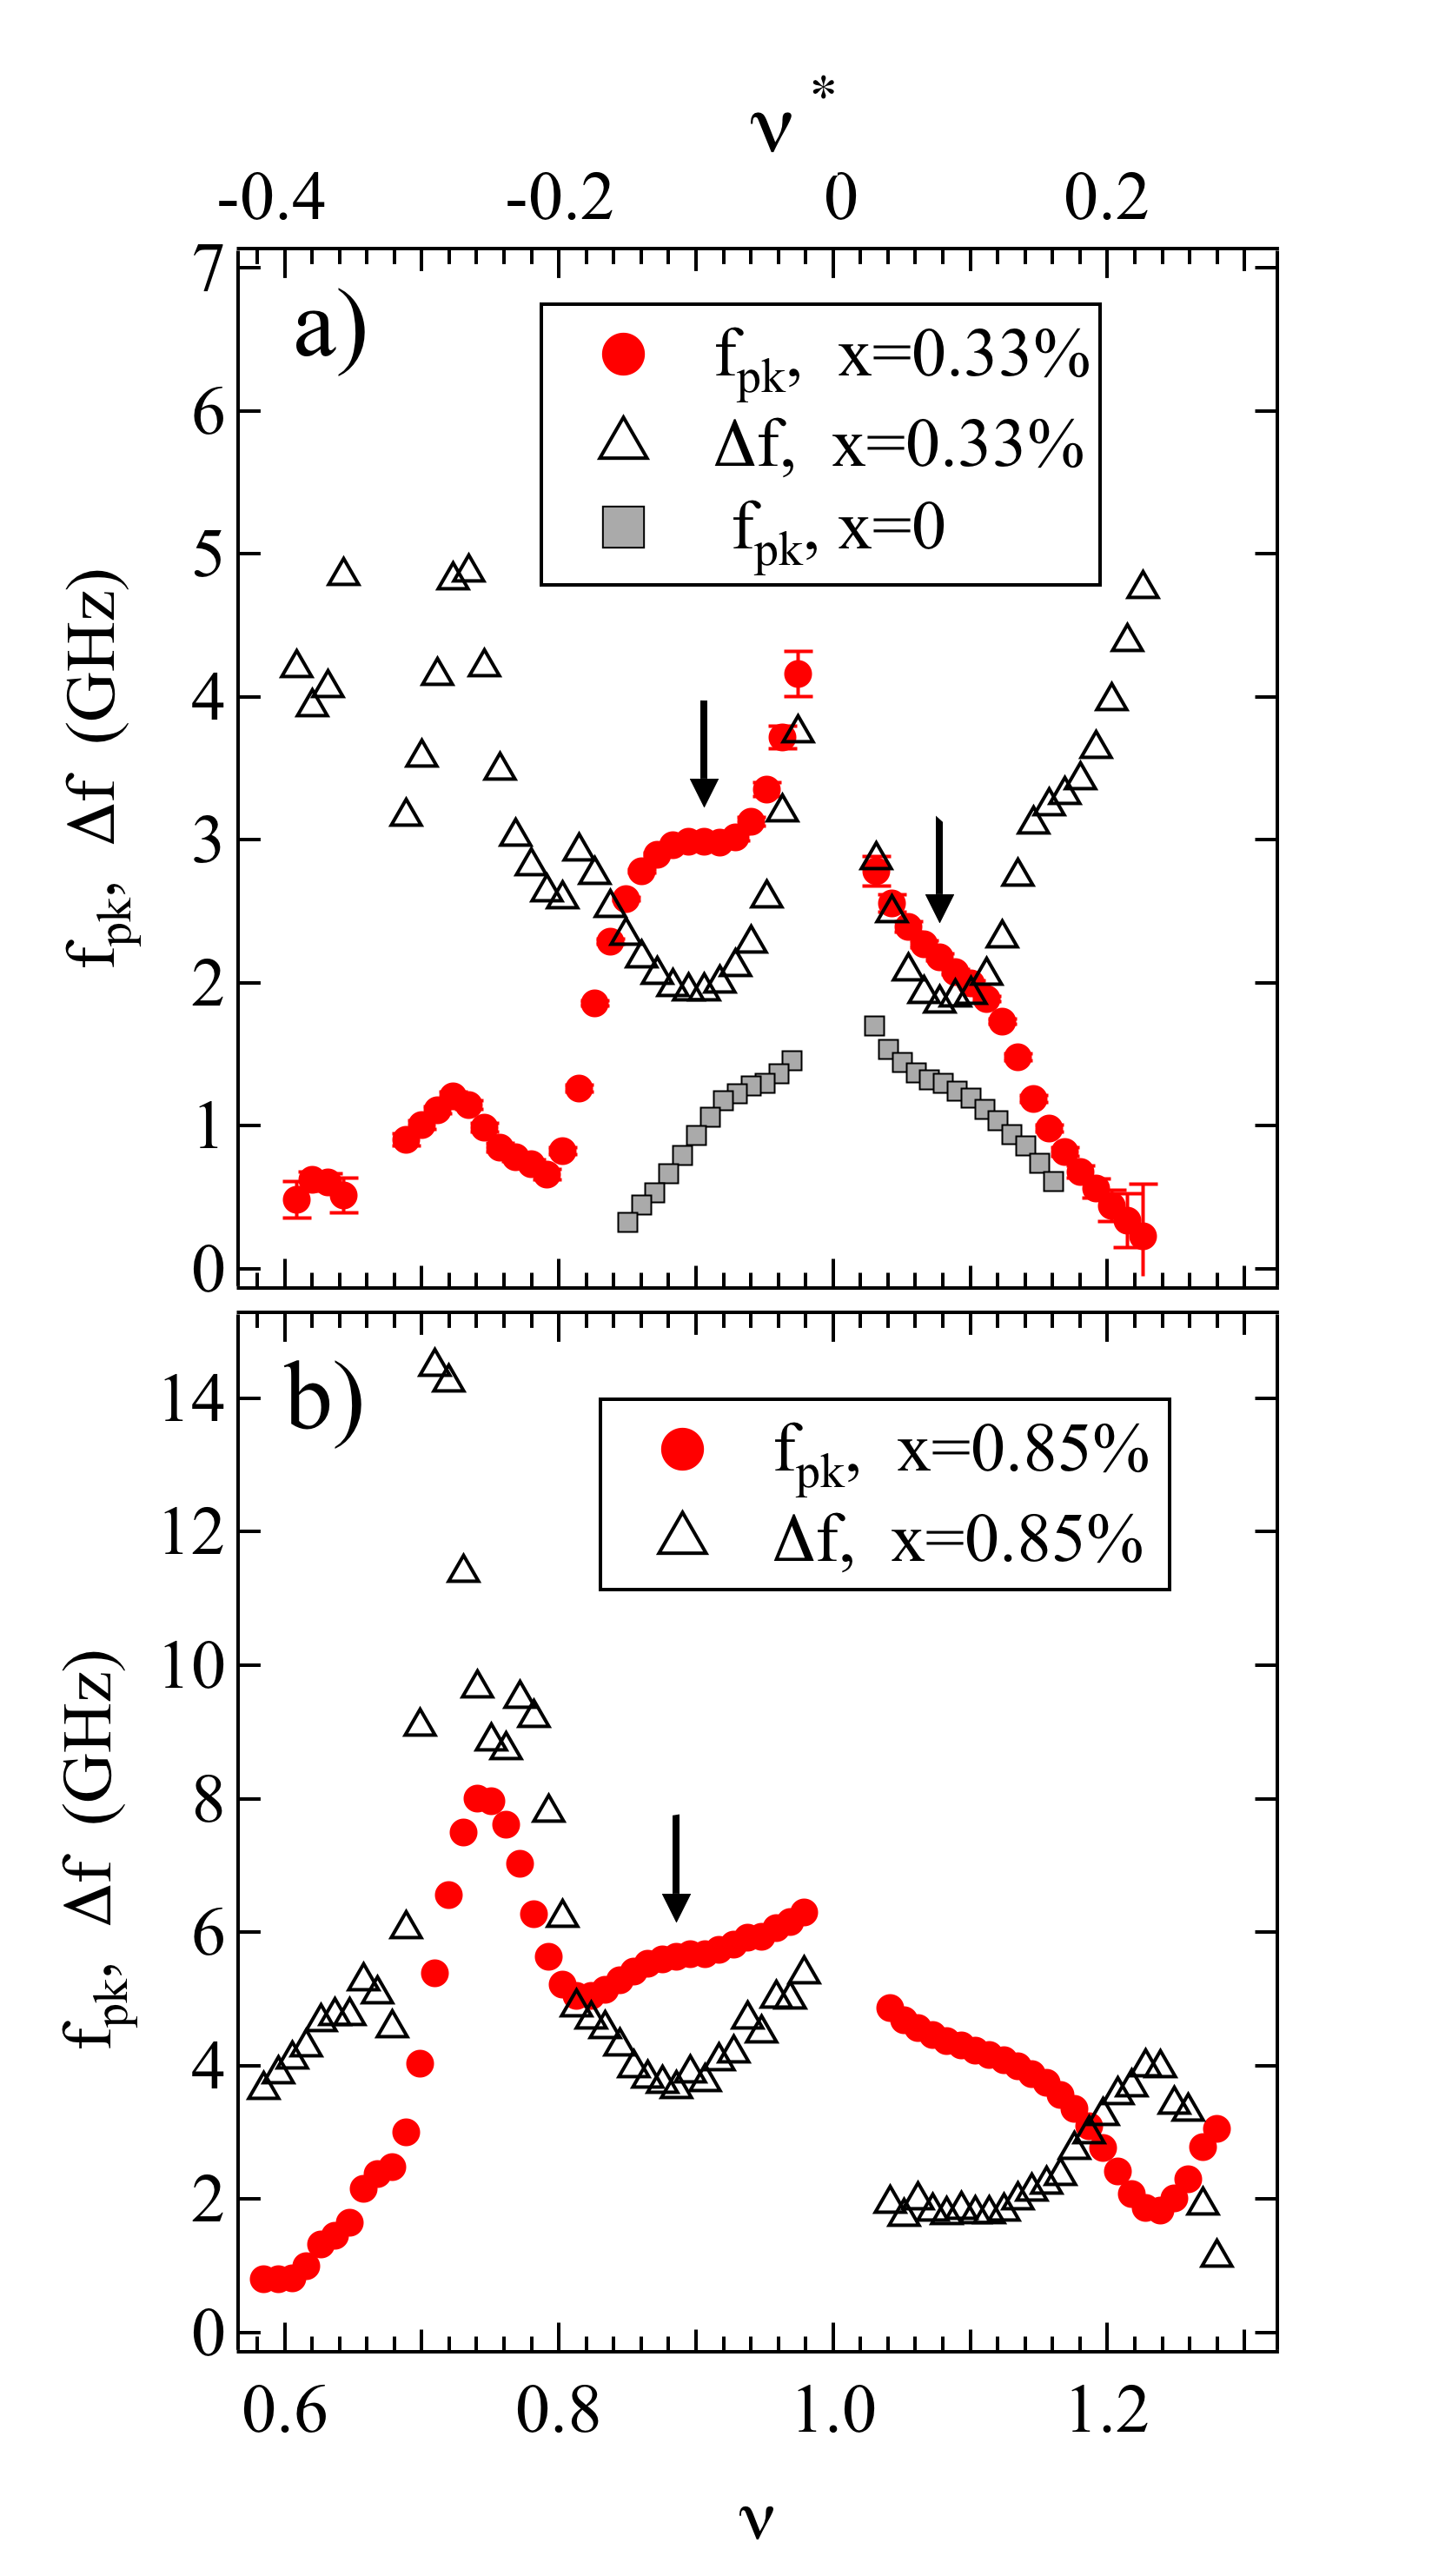
Figure 5 shows and the linewidth, , vs and for both the samples. Both and come from fits of Im vs , like those shown in Fig. 3 and Fig. 4. Figure 5a also shows vs from ref. hanskyrme, , on an ultralow disorder quantum well sample, with , cm-2 and m2/V-s. The and traces are decreasing as moves away from 1, out to . vs for the ultralow disorder sample likewise decreases on moving away from 1, though the range of for that data is less. Inflections are marked with arrows for the vs traces for and for , but are also visible in the data, for slightly smaller . Inflections are marked by down arrows for the vs data in Fig. 5a, at and . Inflections are also visible in the vs , for slightly smaller . A similar but much weaker feature in is marked in Fig. 5b as well.
The main point of this paper is that the behavior of the resonance for , with monotonic decrease of as is evidence for an IQHEWS, much like that found in ultralow disorder samples. The decrease in is due to the increase in , which results in a stiffer solid that avoids features of the disorder which increase pinning. is larger than the ultralow disorder sample, as expected for larger disorder, but the disorder, possibly because of its homogenous distribution and short range, still allows IQHEWS formation.
The inflections in the vs traces of Fig. 5 are also similar to effects in the ultralow disorder sample. The inflections can be regarded as due to a sudden decrease in the pinning as approaches 1, superposed on the pinning increase engendered by the reduction in quasiparticle density. Based on ref. hanskyrme, we interpret this as due to formation of skyrmionsbarret ; sondhi ; schmeller containing multiple spins. Crystalsbayotmelinte ; fertigsk of such skyrmions can form near state when 1) sufficiently close to 1 and 2) when Zeeman energy is sufficiently small relative to Coulomb energy, that is, for sufficiently small ,where is total magnetic field. For the present samples respectively for the , using . The sample that produced the trace of Fig. 5a had in perpendicular magnetic field; the inflections in vs of this sample were shownhanskyrme to disappear on applying in-plane magnetic field to increase . In-plane field experiments on the alloy-disordered samples would verify the skyrmion based interpretation. The disorder at the level actually appears to make the skyrmion effect more prominent than in the ultralow disorder sample. A skyrmion effect in the Al disordered sample also indicates a remarkable robustness of this interaction-driven phenomenon in the presence of homogenous short-range disorder.
As goes below (and also above 1.2 in a small range for ), the decrease of with reverses, and the interpretation of the resonance is less clear. For , increases with decreasing and develops a peak around for , and a much more pronounced peak around for . The behavior seen for is clearly enabled by the disorder, since the disorder extends the resonant range into that region. Disorder stabilizes a solid vs an FQHE liquid since the solid optimizes its energy in the disorder potential, gaining its pinning energypricezhulouie , and the transition to insulator at the low termination of the FQHE series occurs around in Al alloy-disordered sampleswanlireentrant ; byounglonu .
Except for a small range near for , the overdamped ( on Fig. 5) regions have . The most strongly overdamped resonance spectra are for well below , for for and for . Their spectra are characterized by a sharp rise in Re at low . In the regions where these spectra occur, the brown color in Fig. 2 comes to within 0.1 GHz of the lower axis. The spectra are qualitatively different from the better-developed resonances seen closer to integer , or in the low insulator, both in the present samples byounglonu and in low-disorder Al-free quantum wells yongiqhwc ; hanskyrme .
Earlier dc transport measurements wanlireentrant particularly on a sample from the same wafer showed a reentrant integer quantum Hall effect (RIQHE), between the and FQHEs. The RIQHE has vanishing diagonal resistance and Hall resistance quantized to , and indicates that quasiholes of the partially occupied Landau level are insulating. In the RIQHE range of ref. wanlireentrant, we find resonances of the strongly overdamped type in both samples. Possibly because of sample processing, variation within the wafer, or cooldown procedure, we do not find a 2/3 FQHE in the present sample. There is a 2/3 FQHE in the present sample, so in that sample the insulator between 2/3 and 3/5 is reentrant.
While the interpretation of the resonance for is unclear, we present different possibilities, involving the composite fermion (CF) picture jainbook . At rational fractional of FQHE states the resonance can be suppressed, hence it is reasonable to assume that the CF picture, which has explained many aspects of the FQHE, will be of value even in the presence of the disorder potential. There has been recent detailed theoretical treatment archer1 ; archer2 of composite fermion (CF) Wigner crystals in disorder-free systems. A CF Wigner crystal, denoted 2pCFWC, is composed of CFs with flux bound to an electron. The theory, presented in ref. archer2, for , predicts a series of transitions between different 2pCFWC with increasing as decreases, in particular a change from a 2CFWC to 4CFWC as decreases from 1/5 to 1/6. Since the disorder extends for the resonance well beyond where solid in a low-disorder system is expected, the theory does not cover the presently observed resonance range. It may be that CF vortex number transitions, if present in these samples, are strongly affected by the disorder, so that the where it occurs is different than predicted.
One of the most striking features of the data are the peaks around to , not far from where CFs form a Fermi surface, and move in a zero effective magnetic field. It may be that this region is characterized by a CF solid more like that considered for chitragiamarchiB0 , in which the particle size is determined by competition between kinetic energy and interaction; such a solid would need to be stabilized by the dense homogenous disorder.
One possible cause of the large damping would be pockets of FQH liquid within the insulating phase. It is unlikely the pockets are localized in the Al disorder, though it may be that the much weaker, large length scale disorder associated with the remote ionized donors is containing liquid pockets, as described in ref. yac, . An inhomogeneous microemulsion phase of the sort proposed in refs. jameikivspiv, ; kivspiv, is also conceivable. If there are pockets of CF liquid, the additional damping for is explainable as due to dissipation in the liquid pockets. The increase of near that frequency could involve the pockets to be screening the Coulomb interaction between carriers of the solid, reducing its effective stiffness at long range.
In summary we have found that Al-alloy disordered samples exhibit the signature of an IQHEWS for below about 0.2. The IQHEWS is remarkably similar to that in ultralow disorder samples, and shows some likely effects of skyrmions. For , where resonances are not seen for ultralow disorder samples, the resonance has an evolution that is more complex than that seen in low disorder samples. increases with decreasing as goes below , and a maximum in vs occurs for just below . The CF picture provides possible explanations of the features. The disorder extends the range of the existence of the resonance, so that there is reentrance at least of a highly damped resonance, around FQHE states.
We thank Kun Yang and J. K. Jain for helpful discussions and A. T. Hatke for his comments on the manuscript. The work at Princeton was funded through the NSF through MRSEC DMR-0819860 and the Keck Foundation and the Gordon and Betty Moore Foundation (grant GBMF4420). The microwave spectroscopy work at NHMFL was supported through DOE grant DE-FG02-05-ER46212 at NHMFL/FSU. NHMFL is supported by NSF Cooperative Agreement No. DMR-0084173, the State of Florida and the DOE.
References
- (1) Y. E. Lozovik and V. I. Yudson, JETP Lett., 22, 11 (1975).
- (2) P. K. Lam and S. M. Girvin, Phys. Rev. B 30, 473 (1984).
- (3) Kun Yang, F. D. M. Haldane, and E. H. Rezayi Phys. Rev. B 64, 081301 (2001).
- (4) R. Narevich, Ganpathy Murthy, and H. A. Fertig, Phys. Rev. B 64, 245326 (2001).
- (5) Chia-Chen Chang, Csaba Töke, Gun Sang Jeon, and Jainendra K. Jain Phys. Rev. B 73, 155323 (2006); Chia-Chen Chang, Gun Sang Jeon, and Jainendra K. Jain Phys. Rev. Lett.94, 016809 (2005).
- (6) Alexander C. Archer and Jainendra K. Jain Phys. Rev. B 84, 115139 (2011).
- (7) A. C. Archer, Kwon Park, Jainendra K. Jain, Phys. Rev. Lett., 111, 146804 (2013).
- (8) H. W. Jiang, R. L. Willett, H. L. Stormer, D. C. Tsui, L. N. Pfeiffer, and K. W. West, Phys. Rev. Lett., 65, 633 (1990).
- (9) V. J. Goldman, M Santos, M Shayegan, and J. E. Cunningham, Phys. Rev. Lett. 65, 2189 (1990).
- (10) E. Y. Andrei, G. Deville, D. C. Glattli, F. I. B. Williams. E. Paris, and B. Etienne, Phys. Rev. Lett. 60, 2765 (1988).
- (11) H. Buhmann, W. Joss, K. v. Klitzing, I. V. Kukushkin, A. S. Plaut, G. Martinez, K. Ploog, and V. B. Timofeev, Phys. Rev. Lett. 66, 926 (1991).
- (12) I. V. Kukushkin, Vladimir I. Fal ko, R. J. Haug, K. von Klitzing, K. Eberl, and K. T temayer Phys. Rev. Lett. 72, 3594(1994).
- (13) F. I. B. Williams, P. A. Wright, R. G. Clark, E. Y. Andrei, G. Deville, D. C. Glattli, O. Probst, B. Etienne, C. Dorin, C. T. Foxon, and J. J. Harris, Phys. Rev. Lett. 66, 3285 (1991).
- (14) M. A. Paalanen, R. L. Willett, R. R. Ruel, P. B. Littlewood, K. W. West, L. N. Pfeiffer and D. J. Bishop, Phys. Rev. B 45, 11342 (1992).
- (15) M. A. Paalanen, R. L. Willett, R. R. Ruel, P. B. Littlewood, K. W. West, L. N. Pfeiffer and D. J. Bishop, Phys. Rev. B45, 13784 (1992).
- (16) L. W. Engel, C.-C. Li, D. Shahar, D. C. Tsui and M. Shayegan, Solid State Commun., 104 167-171 (1997).
- (17) C.-C. Li, J. Yoon,L. W. Engel D. Shahar, D. C. Tsui and M. Shayegan, Phys. Rev. B 61, 10905 (2000).
- (18) P. D. Ye, L. W. Engel, D. C. Tsui, R. M. Lewis, L. N. Pfeiffer, and K. West, Phys. Rev. Lett. 89, 176802 (2002).
- (19) G. Sambandamurthy, Zhihai Wang, R. M. Lewis, Yong P. Chen, L. W. Engel, D. C. Tsui, L. N. Pfeiffer and K. W. West, Solid State Commun. 140, 100 (2006) contains a brief review.
- (20) M. Shayegan, in Perspectives in Quantum Hall Effects, edited by S. Das Sarma and A. Pinczuk (Wiley-Interscience, New York, 1997), p. 343.
- (21) Yong Chen, R. M. Lewis , L. W. Engel , D. C. Tsui , P. D. Ye , L. N. Pfeiffer and K. W. West, Phys. Rev. Lett. 91, 016801 (2003).
- (22) Han Zhu, G. Sambandamurthy, Yong P. Chen, P. Jiang, L. W. Engel, D. C. Tsui, L. N. Pfeiffer, and K. W. West, Phys. Rev. Lett. 104, 226801 (2010).
- (23) R. M. Lewis, Yong Chen, L. W. Engel, D. C. Tsui, P. D. Ye, L. N. Pfeiffer and K. W. West, Physica E 22, 104 (2004).
- (24) Han Zhu, Yong P. Chen, P. Jiang, L. W. Engel, D. C. Tsui, L. N. Pfeiffer, and K. W. West Phys. Rev. Lett. 105, 126803 (2010).
- (25) R. M. Lewis, P. D. Ye, L. W. Engel, D. C. Tsui, L. Pfeiffer, and K. W. West, Phys. Rev. Lett. 89, 136804 (2002).
- (26) Hidetoshi Fukuyama and Patrick A. Lee, Phys. Rev. B 18, 6245 (1978).
- (27) R. Chitra, T. Giamarchi, and P. Le Doussal, Phys. Rev. Lett. 80, 3827 (1998); R. Chitra, T. Giamarchi, and P. Le Doussal, Phys. Rev. B 65, 035312 (2001).
- (28) H. A. Fertig, Phys. Rev. B 59, 2120 (1999).
- (29) M. M. Fogler, and D. A. Huse, Phys. Rev. B 62, 7553 (2000).
- (30) Wanli Li, D. R. Luhman, D. C. Tsui, L. N. Pfeiffer, and K. W. West, Phys. Rev. Lett. 105, 076803 (2010).
- (31) Wanli Li, G. A. Csáthy, D. C. Tsui, L. N. Pfeiffer, and K. W. West, Appl. Phys. Lett. 83, 2832 (2003).
- (32) Wanli Li, G. A. Csáthy, D. C. Tsui, L. N. Pfeiffer, and K. W. West, Phys. Rev. Lett. 94, 206807 (2005).
- (33) Wanli Li, C. L. Vicente, J. S. Xia, W. Pan, D. C. Tsui, L. N. Pfeiffer, and K. W. West, Phys. Rev. Lett. 102, 216801 (2009).
- (34) Wanli Li, J. S. Xia, C. Vicente, N. S. Sullivan, W. Pan, D. C. Tsui, L. N. Pfeiffer, and K. W. West, Phys. Rev. B 81, 033305 (2010).
- (35) B.-H. Moon, L. W. Engel, D. C. Tsui, L. N. Pfeiffer, and K. W. West, Phys. Rev. B 89, 075310 (2014).
- (36) Zhihai Wang, Yong P. Chen, Han Zhu, L. W. Engel, D. C. Tsui, E. Tutuc, and M. Shayegan, Phys. Rev. B 85, 195408 (2012)
- (37) N. W. Ashcroft and N. D. Mermin, Solid State Physics , (Saunders, Philadelphia, 1976).
- (38) S. E. Barrett, G. Dabbagh, L. N. Pfeiffer, K. W. West, and R. Tycko, Phys. Rev. Lett 74, 5112 (1995).
- (39) S. L. Sondhi, A. Karlhede, S. A. Kivelson, and E. H. Rezayi, Phys. Rev. B 47, 16419 (1993).
- (40) A. Schmeller et al., Phys. Rev. Lett. 75, 4290 (1995).
- (41) V. Bayot, E. Grivei, S. Melinte, M. B. Santos, and M. Shayegan, Phys. Rev. Lett. 76, 4584 (1996); 79, 1718 (1997); S. Melinte,E. Grivei, V. Bayot, and M. Shayegan, ibid. 82, 2764 (1999).
- (42) R. Côté, A. H. MacDonald, Luis Brey, H. A. Fertig, S. M. Girvin, and H. T. C. Stoof, Phys. Rev. Lett. 78, 4825 (1997).
- (43) R. Price, Xuejun Zhu, P. M. Platzman, and Steven G. Louie, Phys. Rev. B 48, 11473 (1993).
- (44) J. K. Jain, Composite Fermions. Cambridge University Press, Cambridge, 2007.
- (45) R. Chitra and T. Giamarchi Eur. Phys. J. B 44, 455 467 (2005).
- (46) S. Ilani, J. Martin, E. Teitelbaum, J. H. Smet, and D. Mahalu, Nature 427, 328 (2004).
- (47) Reza Jamei, Steven Kivelson, and Boris Spivak, Phys. Rev. Lett. 94, 056805 (2005).
- (48) Boris Spivak and Steven A. Kivelson Phys. Rev. B 70, 155114 (2004).