Holographic laser Doppler imaging of microvascular blood flow
Abstract
We report on local superficial blood flow monitoring in biological tissue from laser Doppler holographic imaging. In time-averaging recording conditions, holography acts as a narrowband bandpass filter, which, combined with a frequency-shifted reference beam, permits frequency-selective imaging in the radiofrequency range. These Doppler images are acquired with an off-axis Mach–Zehnder interferometer. Microvascular hemodynamic components mapping is performed in the cerebral cortex of the mouse and the eye fundus of the rat with near-infrared laser light without any exogenous marker. These measures are made from a basic inverse-method analysis of local first-order optical fluctuation spectra at low radiofrequencies, from 0 Hz to 100 kHz. Local quadratic velocity is derived from Doppler broadenings induced by fluid flows, with elementary diffusing wave spectroscopy formalism in backscattering configuration. We demonstrate quadratic mean velocity assessment in the 0.1-10 mm/s range in vitro and imaging of superficial blood perfusion with a spatial resolution of about 10 micrometers in rodent models of cortical and retinal blood flow.
OCIS codes : 090.0090, 040.2840, 170.1470, 170.3340.
I Introduction
I.1 Motivations
The role of the microcirculation is increasingly being recognized in the pathophysiology of cardiovascular diseases; eg. hypertension Gooding2010 ; StruijkerBoudier2012 ; Book_StruijkerBoudier2012 and diabetes Rendell1989 ; Schlager2012 ; VasGreen2012 . In particular, assessing retinal blood flow can be potentially useful for understanding diabetic retinopathies Grunwald1993 , and study the relationships between vascularization and glaucoma Koseki2008 ; Venkataraman2010 ; Sugiyama2011 ; Schmidl2012 ; HwangKonduru2012 . Moreover, extensive use of optical methods is made for monitoring skin microvascular endothelial (dys)function Kubli2000 ; CracowskiMinson2006 ; Holowatz2008 ; KhanPatterson2008 ; Turner2008 ; VanHerptDraijer2010 . Prevalent optical techniques to monitor microvascular blood flow in clinical studies are laser Doppler probes and spatial speckle contrast imaging. The former is characterized by its high temporal resolution and the latter enables wide-field imaging of superficial microvascular networks. Superficial blood flow monitoring require sensitivity in low light, high temporal resolution, high spatial resolution, and the ability to perform quantitative flow measurements. Most current techniques are limited in their spatial resolution or temporal resolution or both. Hence wide-field optical imaging techniques using laser light and sensor arrays to probe local dynamics with potentially high spatial and temporal resolution are attracting attention for the measurement of blood flow HumeauHeurtier2013 .
I.2 Relationship between local motion and optical fluctuations
The radiofrequency (RF) spectrum of dynamic light fluctuations is affected by microvascular hemodynamics and hence a subject of great interest for blood flow imaging applications. The laser Doppler technique measures Doppler-shifts and broadenings of quasi-elastically scattered light. Depending on the detection configuration, single scattering or multiple scattering can be targeted to yield Doppler spectra. The observation and interpretation of Doppler broadening of a scattered laser light beam by a fluid in motion in vitro YehCummins1964 and in vivo Stern1975 has led to the physical modeling of laser Doppler velocimetry BonnerNossal1981 ; HeckmeierSkipetrov1997 . Mapping retinal hemodynamics in vivo has many biomedical applications such as diagnosis of retinal microvasculature disorders Feke1978 ; Schmetterer1999 ; SatoFeke2006 . Optical instrumentation is well adapted to non-invasive retinal blood flow imaging, because the eye fundus vascular tree is visible through the cornea and is thus potentially accessible for light imaging. The Doppler shift of a monochromatic optical radiation scattered by a moving target is the scalar product of the optical momentum transfer with the target velocity. Doppler shifts are cumulative. In the case of multiple scattering, Algebraic Doppler shifts add-up throughout each optical path, and the broadening of the backscattered radiation still carries a highly valuable information, for velocity assessment Riva1972 ; BonnerNossal1981 . Under coherent illumination, the local motion of scatterers can be probed either by the analysis of local spatial contrast, the local temporal fluctuations, or the local RF Doppler spectrum of the speckle pattern Briers1996 . Single point laser Doppler detection schemes in heterodyne Riva1979 ; Michelson1996 ; Ferguson2004 ; RajanVarghese2009 or self-mixing NilssonTenland1980 ; DeMulVanSpijker1984 ; Bosch2001 ; NikolicHicks2013 configurations are prevalent in practical detection of blood flow from wideband temporal optical fluctuations analysis, for superficial blood flow sensing. The design of depth-resolved Doppler-contrast optical coherence tomography schemes Izatt1997 ; LeitgebSchmetterer2003 ; AnWang2008 ; AnLiLan2013 is also an active field of research with applications in vascular imaging of the posterior segment of the eye. In this article, we limit the description of state-of-the-art detection schemes based on sensor arrays.
I.3 Spatial speckle contrast analysis
Spatial intensity fluctuation analysis techniques Draijer2009R ; BoasDunn2010 ; Dunn2012 ; Basak2012 ; ValdesVarma2014 can be referred to as time-averaged speckle contrast imaging. These techniques have been adopted over the past decades for imaging of blood flow dynamics in real-time. Their rapid adoption for physiological studies is due to to the ability to quantify blood flow changes with good spatial and temporal resolution. Local motion imaging by the analysis of spatial contrast of laser speckle is a simple and robust method to achieve full-field imaging FercherBriers1981 ; Briers1995 ; Briers2001 . It is a widely used imaging technique to image blood flow in vivo, primarily due to advantages like ease of instrumentation, reproducibility Roustit2010 , and low cost RichardsKazmi2013 . It relies on local speckle contrast in time-averaged recording conditions to assess local motion of light scatterers. Motion of scattering particles, like the red blood cells, causes spatial and temporal blurring of the speckle pattern. In speckle contrast imaging, the interference pattern is recorded with a camera, and the blurring of the pattern is quantified to obtain a measure of relative change in flow. Spatial contrast analysis techniques improved to assessment of quantitative relative changes in local blood perfusion with exposure-control of the recorded frames Bandyopadhyay2005 ; ParthasarathyTom2008 and consideration of the non-fluctuating light component in contrast analysis models ZakharovVolker2006 . Speckle contrast analysis schemes were used to generate images of blood flow in the rat retina in traditional configuration ChengDuong2007 ; SriencKurthNelson2010 , and via an endoscope PonticorvoCardenas2013 . Speckle contrast imaging is now being routinely applied to cerebral blood flow assessment, providing valuable vascular perfusion information in vivo DunnBolay2001 ; DunnDevor2003 ; DunnDevor2005 ; DuncanKirkpatrick2008 ; Zakharov2009 ; in particular with the advent of multi-exposure speckle imaging ParthasarathyTom2008 ; ParthasarathyKazmi2010 . Recently, the technique was used with success to monitor cerebral blood flow during neurosurgery in the human brain ParthasarathyWeber2010 ; Klijn2013 .
I.4 Temporal speckle contrast analysis with sensor arrays
Full-field laser Doppler imaging techniques from time-domain optical intensity fluctuations measurements on sensor arrays can enable monitoring of blood perfusion changes Serov2002 ; Serov2005 ; Serov2005 ; ChengYan2008 ; Draijer2009 ; WangMoyer2012 ; ZengWangFeng2013 ; WangZengLiangFeng2013 . In these approaches, laser Doppler signal processing is performed off-chip, which means that large digital data transfers have to be handled from the sensor array to the processing unit of a computer. Recently, image-plane laser Doppler recordings with a high throughput complementary metal–oxide–semiconductor (CMOS) camera in conjunction with short-time discrete Fourier transform calculations by a field programmable gate array (FPGA) reportedly enabled continuous monitoring of blood perfusion in the mm/s range. Full-field flow maps of 480 480 pixels were rendered at a rate of 14 Hz, obtained from image recordings at a frame rate of 14.9 kHz Leutenegger2011 . However, cameras capable of frame rates of up to several kilohertz and data transfer rates still larger than the commercially available ones are a requirement in this approach. Locally processing the laser Doppler signal within the sensor array can prevent large data throughputs off-chip, which is presently a technological bottleneck. To circumvent data transfer issues, fully-integrated CMOS sensor arrays with Doppler signal processing were developed GuHayesGill2008 , which have the advantage of enabling not only digital but also analog signal processing, which permits capacitive coupling to cancel DC contributions and low-pass filtering of the analog signal to process. Such sensors were demonstrated to achieve 64 64 pixel blood flow images at 1 frame per second HeNguyen2012 ; NguyenHayesGill2011 ; HeNguyen2013 , with a sampling bandwidth of 40 kHz. On-chip laser Doppler signal processing is one of the most promising approaches for the temporal analysis of optical fluctuations for blood flow imaging. It alleviates the technical issue of unmet data throughput required in time-resolved parallel sensing with sensor arrays.
I.5 Laser Doppler imaging by holography
Early experimental demonstrations of holographic ophthalmoscopy of the eye fundus in vivo Calkins1970 ; Wiggins1972 ; Rosen1975 ; OhzuKawara1979 ; Tokuda1980 have shown the potential of this modality for retinal vessels imaging, before the advent of digital acquisition schemes with sensor arrays. A convenient way to perform optical heterodyne detection with video frame rate sensor arrays is to have recourse to holography. For instance, blood flow contrasts were imaged by holography in the cerebral cortex AtlanGrossVitalis2006 and in the eye fundus SimonuttiPaquesSahel2010 of rodents with a standard camera. Time-averaged holography with a frequency-shifted reference beam was shown to enable narrow band detection and imaging of local Doppler broadenings AtlanGrossLeng2006 ; AtlanGross2006 ; VerrierAlexandreGross2014 . Blood flow contrasts were also successfully rendered with wideband detection of optical fluctuations in holographic configuration AtlanGrossVitalis2008 . Laser Doppler holography enables narrowband optical heterodyne detection with the benefit of canceling laser amplitude noise, which can be efficiently filtered spatially in off-axis recording configuration AtlanGross2007JOSAA at the price of a reduction of the available spatial bandwidth. Hence holographic schemes have a major advantage in comparison with direct image recording schemes, especially for narrowband Doppler detection with video-rate cameras.
I.6 Presented results
We report on quantitative fluid flow assessment in vitro and in vivo from holographic interferometry, which enables wide-field imaging of a Doppler-shifted radiation with an array detector. Time-averaged holography acts as a narrowband bandpass filter, described in section II, which permits frequency-selective Doppler imaging in the radiofrequency range, in combination with a frequency-shifted reference beam. These Doppler images are acquired with an off-axis Mach-Zehnder interferometer, in reflection configuration AtlanGrossVitalis2006 ; SimonuttiPaquesSahel2010 . The signal obtained with narrowband, frequency-tunable holographic interferometry is the first-order power spectrum of the optical field scattered by the object, recorded in heterodyne configuration BoasYodh1997 . Multiply-scattered light yields Doppler spectra from which the directional information is lost because of wave vector randomization during scattering. Nevertheless, it has the advantage of providing spatially-resolved wide-field hemodynamic contrast. Our strategy is to use an inverse-problem approach to derive velocity maps of blood flow from optically-acquired Doppler maps; we make use of elementary results from the diffusing-wave spectroscopy formalism Pine1988 in backscattering configuration in order to retrieve local root mean square velocities GandjbakhcheNossal1993 . The measured heterodyne signal described in section II is modeled with the diffusing-wave spectroscopy formalism for flowing and diffusing scatterers in sections IV, V, and VI. In vitro flow measurements in a calibrated sample are reported in section IV. In vivo microvascular blood flow mapping in the cerebral cortex of the mouse and the eye fundus of the rat are reported in section V, and section VI, respectively.
II Narrowband heterodyne detection of light by frequency-tunable holography
II.1 Optical fields
In this section, we use a scalar, deterministic representation of light to highlight the temporal filtering features of time-averaged heterodyne holography. The single-frequency laser light wave can be modeled by a complex number , which represents the oscillating electric field. This field oscillates at the angular frequency . Polarization properties are neglected in this representation. The amplitude and phase of the field are the absolute value and angle of . The optical field illuminating the object under investigation is of the form , where is a complex constant and is the imaginary unit. The probe optical field, backscattered by the preparation under investigation is noted
| (1) |
where the envelope carries the RF temporal fluctuations of the field. It is decomposed in discrete frequency components
| (2) |
With these notations, the discrete first-order RF power spectrum of the object light is
| (3) |
The optical local oscillator (LO) field is a monochromatic wave, coherent with the illumination beam, frequency-shifted by
| (4) |
The irradiance of the light wave, in terms of its electric field , is , where is the permittivity and is the speed of light in vacuum, with a relative permittivity and a magnetic permeability of 1. At time , the optical power (irradiance integrated over the surface of a pixel) integrated during the exposure time by the square-law sensor array yields the recorded interferogram
| (5) |
where is the quantum efficiency of a pixel.
II.2 Bandpass filtering properties of time-averaged holograms
The object field beats against the LO field and yields the following cross-terms contribution in an off-axis region of the spatial frequency spectrum of the interferograms AtlanGross2007JOSAA
| (6) |
To calculate an image, the recorded interferograms have to be demodulated spatially. To this end, numerical image rendering in the object plane is performed with a discrete Fresnel transform involving one fast Fourier transform of the recorded interferograms SchnarsJuptner1994 ; Schnars2002 ; KimYuMann2006 ; PicartLeval2008 ; VerrierAtlan2011 . Once this operation is performed, Eq. 6 represents quantities back-propagated to the object plane. The integration of the interference pattern over the exposure time acts as a temporal frequency filter. In the Fourier domain, it corresponds to a low bandpass filter centered at and whose bandwidth is .
| (7) |
where and is the angular frequency detuning between the local oscillator and the -th spectral component. Two-phase temporal signal demodulation is performed by calculating the squared magnitude of the difference of two consecutive holograms in order to filter-off stray LO intensity fluctuations from the interferometric cross-terms. The resulting signal is
| (8) |
Optical phase fluctuations of the probe field are considered a stationary process at the time scale of the acquisition of a few frames, such that the signal temporal dependency can be dropped : . Using Eq. 7, Eq. 8 can be rewritten as
| (9) |
The right member of equation 9 is proportional to the squared magnitude of the discrete convolution of with the response function , assessed at the frequency . Besides a constant phase factor, this response is AtlanDesbiolles2010
| (10) |
The response for the probe field’s irradiance is a bandpass filter of width . Its line shape is reported in Fig. 4 (dotted line) in typical recording conditions, for = 30 ms and = 12 Hz.
II.3 First-order spectrum assessment
If is much smaller than the typical cutoff frequency of the RF Doppler broadening of the probe beam, we can consider that only the component of the discrete spectral decomposition of the object field at is measured
| (11) |
The average number of probe photons reaching the pixels of size during the measurement time and collected by the filter tuned on , is noted ; it satisfies . The average number of photons of the local oscillator satisfies . In the off-axis region of the hologram, where the object-LO cross-term is separated from other interferometric contributions, the shot-noise is the dominating noise, even in low light GrossAtlan2007 . The shot-noise , in high heterodyne gain regime, scales up linearly with and the average number of photons in the LO channel WhitmanKorpel1969 ; UedaMiida1976 ; Monchalin1985 ; WagnerSpicer1987 ; RoyerDieulesaint1986 ; GrossAtlan2007 . It satisfies
| (12) |
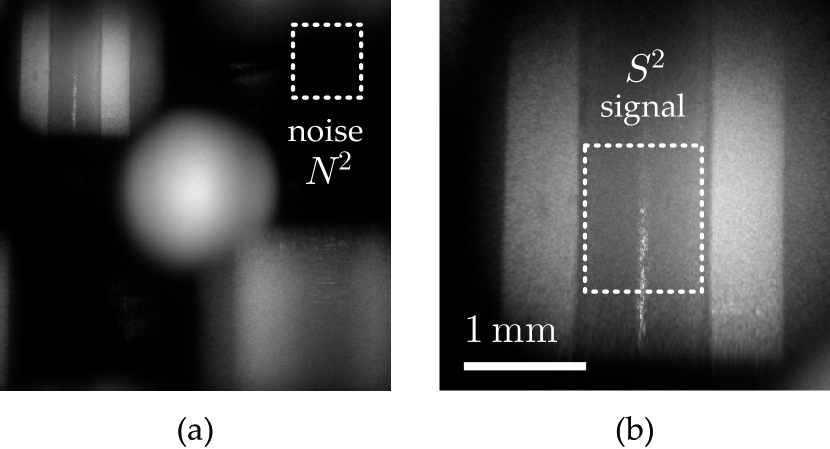
The domain where this quantity is averaged in practice is shown in Fig. 2. From Eq. 11, Eq. 12, and Eq. 3, a robust narrowband measurement of the RF power spectrum can be performed by forming the following ratio, which does not depend on the LO power
| (13) |
Where is the detuning angular frequency of the optical local oscillator. In the case of two-phase demodulation AtlanGross2007JOSAA ; AtlanDesbiolles2010 (Eq. 8), the detection frequency is equal to the detuning frequency of the local oscillator.
III Experimental setup
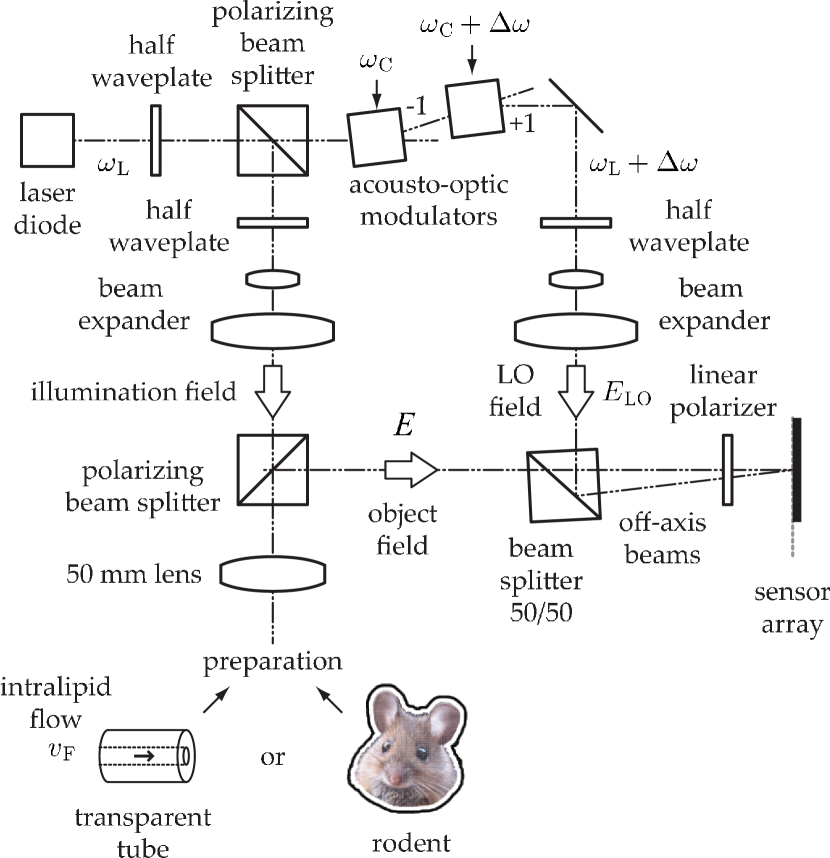
The experimental laser Doppler imaging scheme used for this study is sketched in Fig. 1. It is based on a heterodyne holographic arrangement previously reported AtlanGross2006 ; AtlanGross2007JOSAA ; AtlanGrossVitalis2006 ; SimonuttiPaquesSahel2010 , which consists of a modified Mach-Zehnder optical interferometer designed for off-axis and frequency-shifting holographic imaging in time-averaged recording conditions PicartLeval2003 . In vitro and in vivo flows are investigated. The in vitro preparation, reported in section IV, consists of a transparent tube of 1 mm diameter in which an emulsion is injected with a known average velocity. In vivo flow studies of cerebral and retinal blood flow are reported in section V, and section VI. In all these experiments, a continuous laser diode (Mitsubishi ML120G21) emits a monochromatic radiation of wavelength with an average power of 80 mW. The detection consists of wide-field illumination and collection of the cross-polarized backscattered light from the brain along the same optical axis. It is achieved with a polarizing beam splitter, in order to select photons which have undergone at least a few scattering events Schmitt1992 . This approach is chosen to increase the relative weight of multiply scattered Doppler-shifted photons with respect to photons scattered once. The incident light beam is expanded to form a plane wave and diaphragmed by a pupil. Its polarization angle is tuned with a half-wave plate to set the illumination power to 1 mW. In the reference arm, an attenuator, a half-wave plate, and a beam expander are used to control the LO beam power, polarization angle, and to ensure a flat illumination of the detector. Two acousto-optic modulators (AA Opto Electronic), driven with phase-locked signals at and , are used to shift the optical frequency of the laser beam from to , to form a frequency-shifted optical local oscillator. The carrier frequency is set at the peak response of the acousto-optic modulators, at 80 MHz. The backscattered field is mixed with the LO field with a non-polarizing beam splitter cube. The interference pattern is measured at time by a charge-coupled device array detector (PCO pixelfly QE camera, square pixels of = 6.7 , frame rate , exposure time , dynamic range 12 bit), set at a distance from the object plane. A small angular tilt ensures off-axis recording conditions. The temporal modulation of these fringes is controlled by the optical frequency shift between the reference and the illumination beam. In all the reported experiments, sets of 32 consecutive interferograms {, …, } are recorded for each detuning frequency , for signal averaging purposes. The measurement time of one frequency component is .
IV In vitro fluid flow imaging
From now on, throughout sections IV, V, VI), the optical probe field is described by a stochastic, random variable, as opposed to the model used to derive the temporal filter of the detection in section II. The power spectrum is related to the optical field autocorrelation degree . A quantitative derivation of local decay rates of this function can be made from diffusing-wave spectroscopy formalism in backscattering configuration for a semi-infinite medium Pine1988 ; RovatiCattini2007 ; LinHe2012 ; Cattini2013
| (14) |
where is the mean-square displacement of local light scattering particles, is a fitting parameter, and is the optical wave number. Under the assumption that the optical field undergoes a stationary random phase fluctuations, according to the Wiener–Khinchin theorem Wiener1930 ; bk_Saleh ; bk_Goodman_stat_1985 ; Kumar2006 , the first-order Doppler spectrum and the field autocorrelation function form a Fourier pair
| (15) |
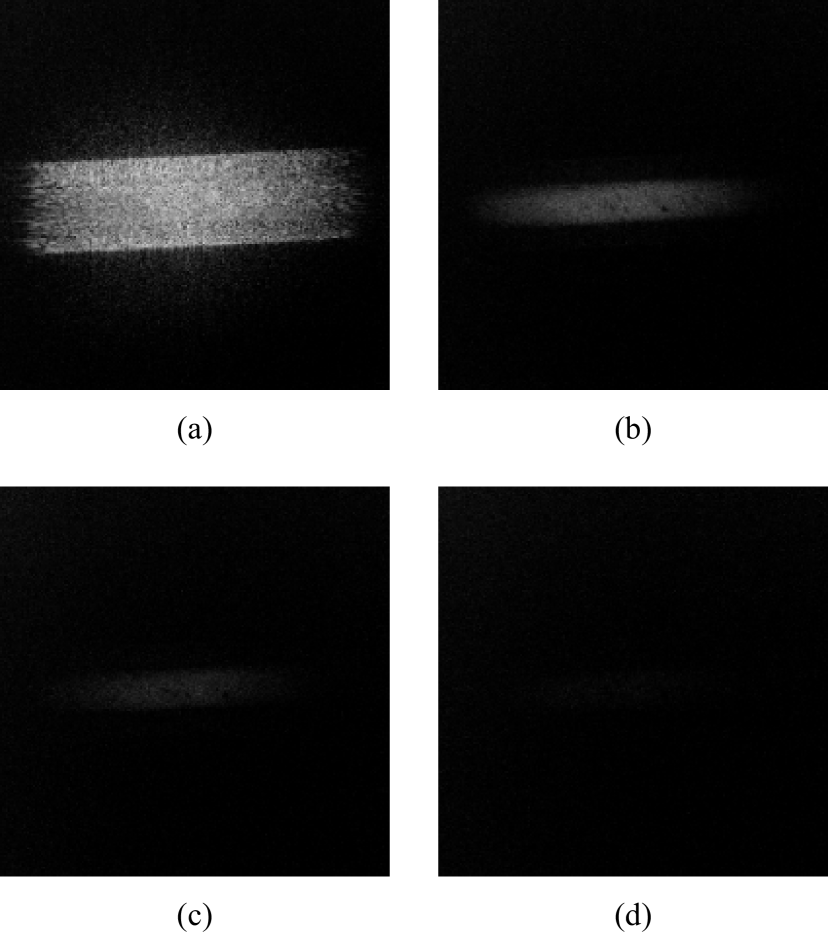
Detuning the LO frequency of the reference beam of the Mach-Zehnder interferometer by permits robust narrowband heterodyne imaging of a component of the first-order RF spectrum of the probe field, by forming the quantity (Eq.13). In practice, for a given detuning frequency , 32 consecutive interferograms are recorded {, …, }. Off-axis hologram rendering in the image plane is performed with discrete Fresnel transformation SchnarsJuptner1994 ; Schnars2002 ; KimYuMann2006 ; PicartLeval2008 ; VerrierAtlan2011 . The difference of consecutive off-axis holograms is then calculated in order to form the temporally-demodulated signal (Eq. 8). This signal is temporally averaged over 32 raw frames. The noise component (Eq. 12) is temporally averaged in the same manner. Moreover, the quantity is spatially averaged in the highlighted region of Fig. 2(a), and for the measurement of the Doppler lineshapes, the quantity is spatially-averaged in the intralipid flow region highlighted in Fig. 2(b). Representative Doppler maps at several detuning frequencies (0 Hz, 200 Hz, 1 kHz, and 2 kHz) for a flow speed of 0.1 mm/s are reported in Fig. 3.
IV.1 Brownian motion of scatterers
In the case of a suspension of diffusing particles for which the mean-square displacement is , the optical field autocorrelation function can be written as BernePecora2000
| (16) |
where , the parameter depends on the configuration and is the spatial diffusion coefficient of a light-scattering particle (diffusivity). For particles in brownian motion, the theoretical first-order optical power spectral density (reported in Fig. 4, for null flow ) is calculated numerically from Eq. 16 and Eq. 15.
IV.2 Convective motion of scatterers
Particles in deterministic (convective) motion with a quadratic mean velocity undergo a local mean-square displacement
| (17) |
The temporal autocorrelation function of the optical field backscattered from a suspension of flowing particles takes the form of an exponential decay; it scales as WuPine1990
| (18) |
where . For these particles in deterministic motion, the normalized first-order power spectral density of optical fluctuations is
| (19) |
The half-width at half-maximum of this Lorentzian line shape is proportional to the local quadratic mean velocity
| (20) |
This quantity is the decay rate of (Eq. 18). This line shape is the model against which the experimental Doppler measures are fitted, in vitro and in vivo, reported in Fig. 4 (for ) and Fig. 7.
IV.3 Measurement of Doppler line shapes
For the detected light composed of dynamic (subscript D) and static (subscript S) components it was shown BoasYodh1997 ; ZakharovVolker2006 that the autocorrelation function of the field will take the following form
| (21) |
where characterizes the relative weight of the dynamic part of the detected light intensity, referred to as pedestal wave Ogiwara1979 ; Agrawal1981 . In that case, the holographic measurement of the local RF spectrum of light, defined in Eq. 13, should exhibit the presence of the apparatus function (Eq. 10) in the non-shifted light component. At a given reconstructed pixel, at a detuning of the local oscillator, measurements can be described by the following expression
| (22) |
IV.4 Experimental measurements of in vitro flows
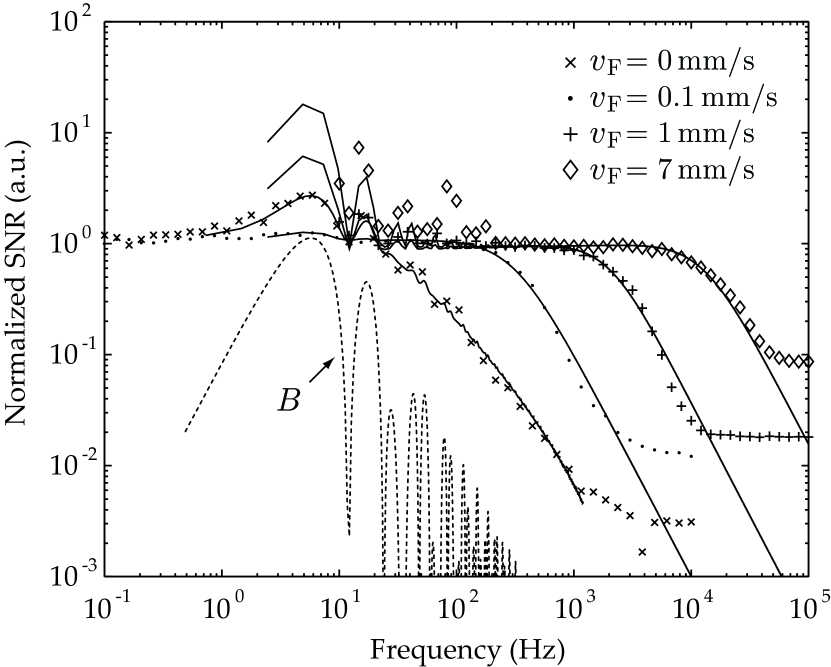
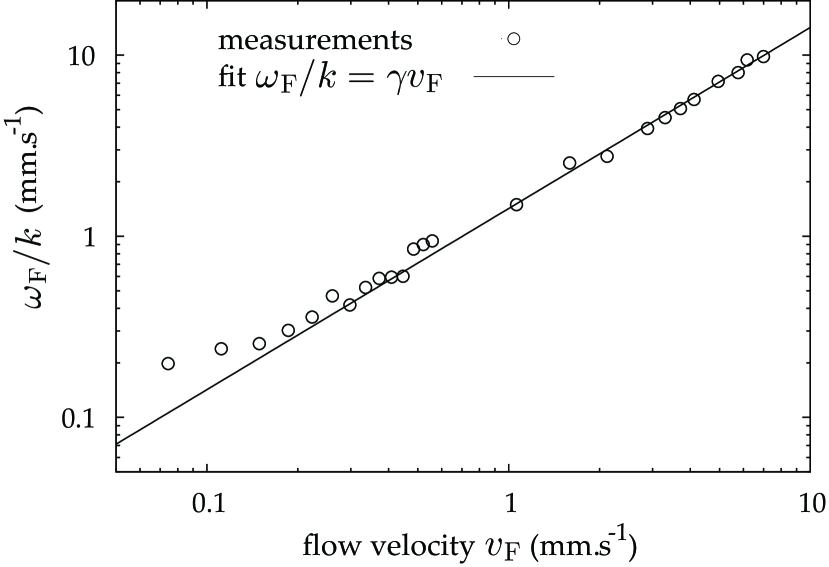
The setup for in vitro flow assessment consists of a tube of 1 mm diameter in which a 1 part in 10 dilute solution of 10% Intralipid in water is injected with a known average velocity by a calibrated syringe pump. The range of velocities studied with this set up varies from to . The experimental Doppler broadened lines measured for known velocities were fitted against expression 22. The results for RF spectra obtained for 3 velocities (symbols) are shown on Fig. 4 (black lines). The variation of the half width of the Doppler line with the flow velocity is investigated. We plotted against in Fig. 5 in order to verify experimentally whether the relation holds. This plot shows that the Doppler width scales linearly with the flow velocity for flows in the 100 m/s to 10 mm/s range, which is in agreement with previously reported results, in vitro Rousseau1971 ; Estes1971 ; Singh1992 . The coefficient evaluated from this procedure is
| (23) |
which is consistent with experimental diffusing wave spectroscopy results in semi-infinite scattering media Pine1988 . This value of is used to calculate flow maps in section V and section VI. For flow velocities below 100 microns per second, experimentally measured Doppler widths are systematically larger than , which can be explained by the fact that the dominating motion of the scatterers is diffusive. This is confirmed by fitting the measured spectrum of light scattered from particles undergoing only brownian motion with the discrete Fourier transform of Eq. 16, which yields the Doppler line for null flow velocity reported in Fig. 4. A spatial diffusivity is found for . It corresponds to a homogenous suspension of oil droplets of radius , in water of dynamic viscosity . The effect of residual motion on Doppler flow measurements is referred to as the biological zero problem ZhongSeifalian1998 ; KernickTooke1999 .
V Imaging of microvascular cerebral blood flow
Cerebral blood flow imaging in the mouse brain was conducted in strict compliance with approved institutional protocols and in accordance with the provisions for animal care and use described in the European Communities Council directive of 24 November 1986 (86-16-09/EEC). Two 26g C57BL6J mouses were anesthetized with urethane (1.75 mg/g). Paw withdrawal, whisker movement, and eyeblink reflexes were suppressed. The head of the mouse was fixed by using a stereotaxic frame (Stoelting). The skin overlying the right cerebral hemisphere was removed and the bone gently cleaned. A 3 3 mm craniotomy was made above the primary somatosensory cortex. Extreme care was taken at all times not to damage the cerebral cortex, especially during the removal of the dura. Physiological Ringers solution containing (in mM): 135 NaCl, 5 KCl, 5 HEPES, 1.8 CaCl2, and 1 MgCl2, was used during the surgery to prevent the exposed cortical area from drying out. At the end of this surgical procedure, the cortical surface was covered with agarose (1 % in Ringers), and a coverslip was placed on top.
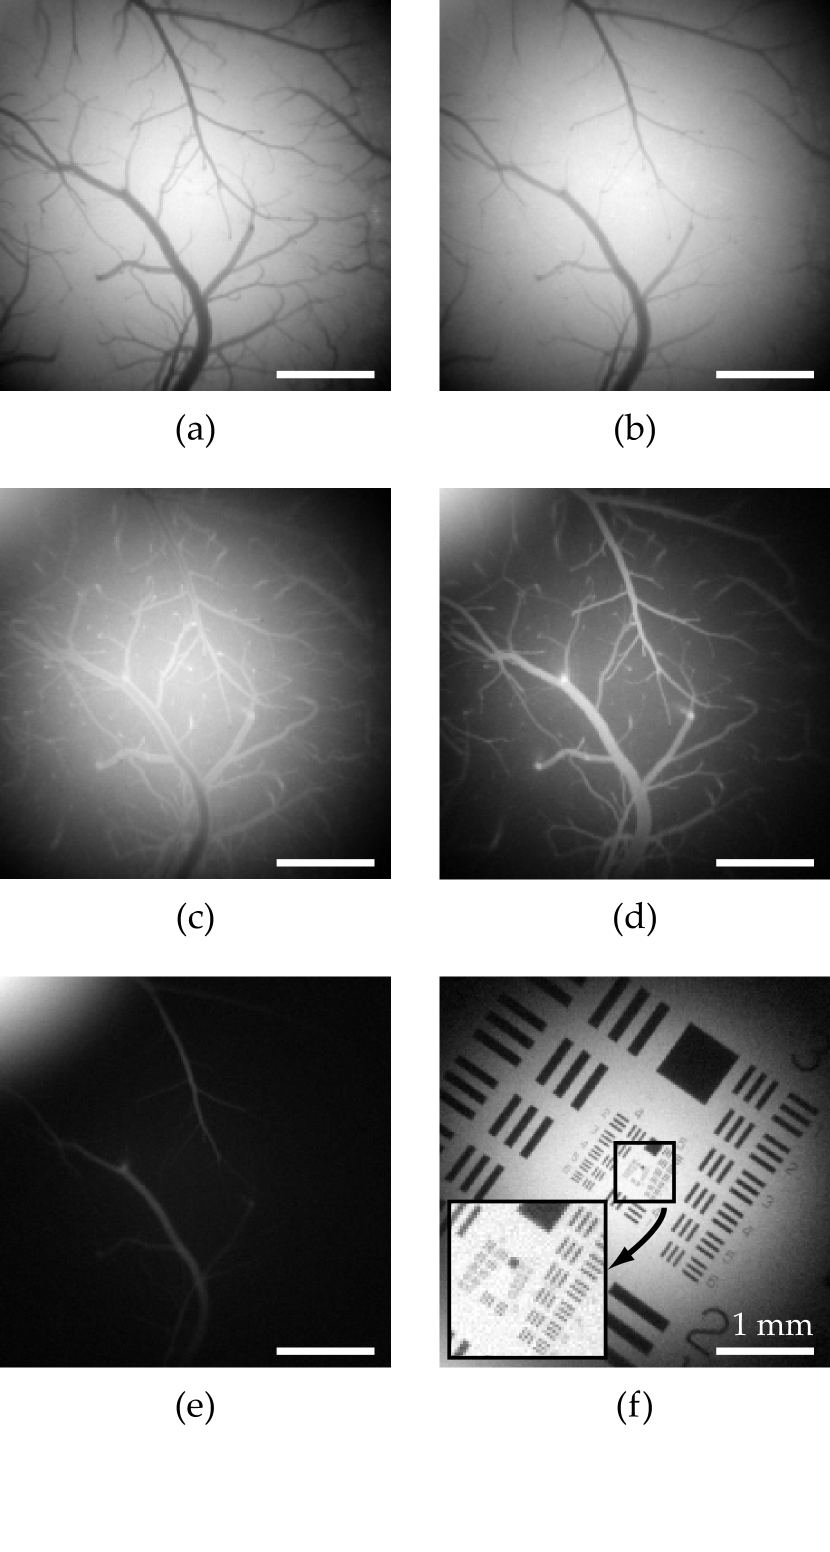
Doppler maps were acquired for logarithmically-spaced LO detunings from 1 Hz to 100 kHz, in order to observe the optical fluctuations due to the Doppler effect induced by blood flow. Fig. 6 shows representative Doppler images of the quantity (Eq. 13) in the cerebral cortex of a mouse, at five frequency shifts, 9 Hz (a), 167 Hz (b), 1.7 kHz (c), 5.5 kHz (d). 17.5 kHz (e). The speckle was attenuated by averaging Doppler maps over three consecutive frames. The comprehensive data obtained from the frequency sweep is reported in Media 1. At low frequency (a), the background (parenchyma) exhibits a higher signal than the vessels. At higher frequency, the contrast is reversed and vessels exhibit a higher Doppler signal than the background. As the detuning frequency increases (d, e), only the main vessels are revealed. The inhomogeneity of the illumination can also be observed in those figures. First-order RF spectral line shapes, normalized by their value at low frequency are reported in Fig. 7. They are measured and averaged over four regions of interest, labeled from 1 to 4, ranked by increasing blood flow, according to the image shown in the insert. They show the features described herein, i.e. narrow broadenings for slow flows and broader line shapes for larger flows.
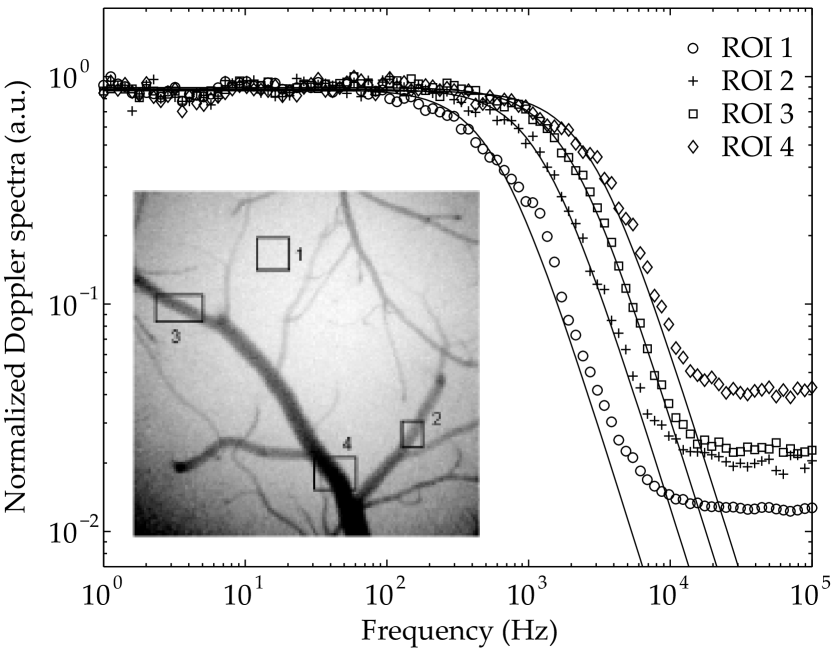
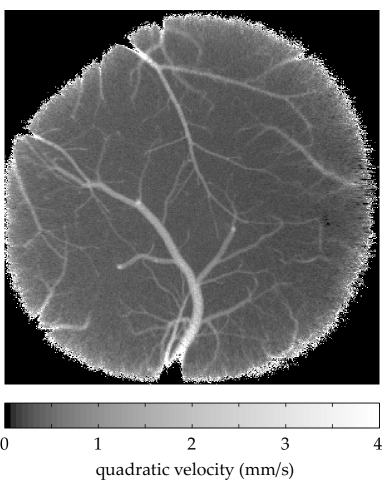
We assume that bioflows under investigation lead to convective scatterers’ motions much larger than the ones due to diffusive processes, so that the formalism of section IV.2 is valid. if the local mean square displacement of an elementary scattering volume in the tissue scales up quadratically with time , relationship 17 holds and we can derive a quadradic mean flow map from a fitting procedure of the measured signal against Eq. 22. The temporal correlation function of the backscattered optical field is of the form of Eq. 18, and the first-order fluctuation spectrum has a Lorentzian lineshape, described by Eq. 19. The first-order power spectral density of the fluctuating field backscattered by the cortex agrees well with a Lorentzian line shape Eq. 19 whose half-width at half maximum is . The parameter was assessed from the calibration procedure in vitro (Eq. 23), and is the mean refractive index of the blood at our studying wavelength Faber2004 , which is close to the refractive index of the brain, evaluated at 1.35 for =1.1 Binding2011 . A holographic image of a resolution target, acquired in the same experimental configuration, is reported in Fig. 6 (f), from which we can observe a lateral resolution limit of about 10 microns, which is compatible with the observation of the smallest vessels. Four spectra from the region of interest are reported in Fig. 7. They are normalized by their respective maximal value at low frequency. As we can see, the higher the blood flow velocity, the broader the spectra. Those spectra are fitted by Lorentzian lines from Eq. 19 with a robust nonlinear least squares algorithm (MathWorks Matlab Curve Fitting Toolbox) and plotted as solid lines on the same graph. These theoretical lines are in good agreement with the measurements. A map of the quadratic mean blood flow velocity can then be derived by fitting each pixel’s Doppler line shape with the Lorentzian line of Eq. 19 to assess local values of . The result is reported in Fig. 8. The inhomogeneity of the lighting seen in Fig. 6 is no longer observed. The resulting velocity map is thus independent on the local illumination level. The blood vessels are well resolved, even the smallest ones.
VI Imaging of microvascular retinal blood flow
Retinal blood flow imaging was conducted in strict compliance with approved institutional protocols. Three adult rats were used for the preparations. Anesthesia was induced by intraperitoneal injection of 100 mg/kg ketamine and 25 mg/kg xylazine (both from Sigma-Aldrich). Topical tropicamide (CibaVision) was administered for pupil dilation. Each rat was placed on its side in a clay bed, their right eyes under the illumination beam. The head was supported so that the iris was perpendicular to the illumination axis. After administration of topical oxybuprocaine (CibaVision), a coverslip was applied on a ring surrounding the globe in order to compensate for the cornea curvature SimonuttiPaquesSahel2010 . Methylcellulose (Goniosol) was applied as a contact medium.
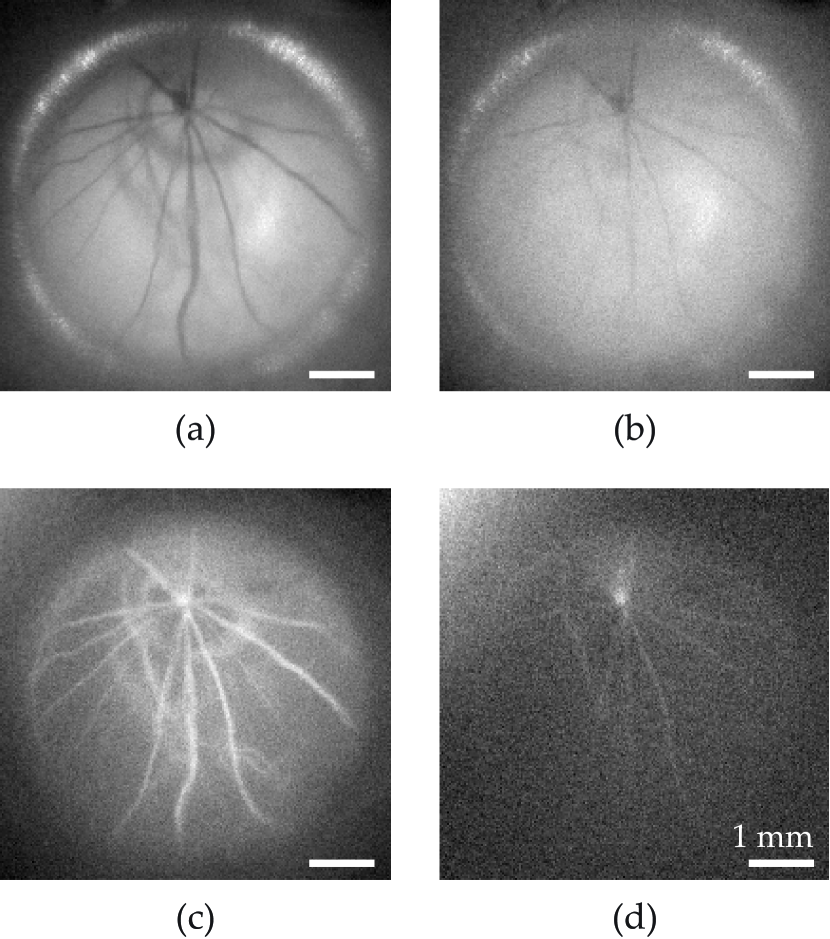
Doppler maps were acquired for logarithmically-spaced LO detunings from 10 Hz to 63 kHz, in order to observe the optical fluctuations due to the Doppler effect induced by blood flow in the eye fundus. Fig. 9 shows representative Doppler images of the quantity (Eq. 13) in the eye fundus of a mouse, at four frequency shifts : 10 Hz (a), 513 Hz (b), 3.0 kHz (c), 6.1 kHz (d). The speckle was attenuated by averaging Doppler maps over three consecutive frames. The comprehensive data obtained from the frequency sweep is reported in Media 2. The contrast reversal from low to high frequency is similar to the observations in the brain, reported in Fig. 6. First-order RF spectral line shapes, normalized by their value at low frequency are reported in Fig. 10. They are measured and averaged over five regions of interest, labeled from 1 to 5.
VI.1 Velocity composition
The global motion of the eye has to be taken into account while considering the velocity of the blood flow. Let be the global in-plane velocity of the retina that defines eye movement Riggs1954 ; Westheimer1975 . The scattering particles flowing in a vessel with an in-plane velocity have a total instant velocity
| (24) |
The local velocity outside a vessel is dominated by the global physiological motion at the quadratic mean velocity , where denotes averaging over the measurement time. We assume that the global physiological motion of the eye, induces a frequency broadening related to its quadratic mean velocity , where with the average refractive index of the eye fundus GrievePaques2004 . The local retinal blood flow induces a frequency broadening related to the quadratic mean velocity . In the neighborhood of a vessel, the local mean square displacement at time of an elementary scattering volume in the tissue is supposed to be, on average, over many realizations
| (25) |
under the hypothesis that the averaged cross-term is zero, because the blood flow direction and the global motion direction are independent, and is supposed to be a zero-mean random variable. Under these assumptions, the temporal correlation function of the optical field backscattered from the retina is the sum of two exponential decays
| (26) |
where is the weight of light component frequency-shifted by the blood flow and is the weight of light affected by the global motion of the eye only. The decay times satisfy the relationships , and . Eq. 26 yields a first-order power spectral density of the form
| (27) |
where and , from which the quadratic mean blood flow velocity can be derived with Eq. 20.
VI.2 Derivation of flow maps
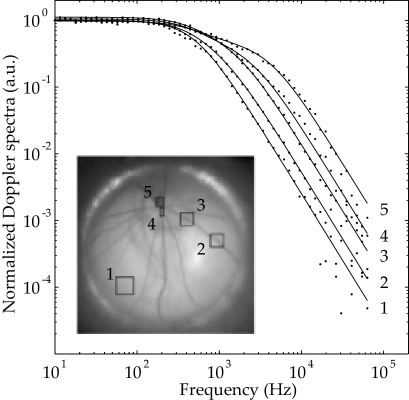
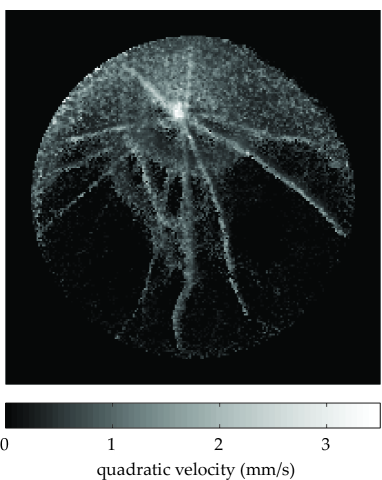
Experimental spectral lines reported in Fig. 10 were averaged over several regions of interest, labeled from 1 to 5, and were fitted by a least squares fitting algorithm with Eq. 27, with the robust nonlinear technique of MathWorks’ Matlab Curve Fitting Toolbox. An estimation of the average Doppler broadening at each point of the image is derived from the fitting parameters of Eq. 27. Once is assessed, an estimation of the local quadratic mean blood flow velocity can be derived, besides a factor , via Eq. 20. The characteristic angular frequency of the global physiological movements can be determined from a region showing no perfusion. In this case, only one Lorentzian line is needed to describe the first order optical power spectral density. A region is selected, labeled 1 in the insert of Fig. 10. The Doppler line averaged in region 1 is shown in Fig. 10. It leads to a global background Doppler broadening value of 500 Hz, and to a corresponding quadratic mean velocity of 0.2 mm/s, for a value of calibrated in vitro (Eq. 23). This velocity is the threshold value above which local flow quadratic mean velocities for retinal imaging in the reported experimental conditions can be assessed, for eye fundus imaging of anesthetized rats. The local quadratic mean blood flow velocity map derived from Eq. 27 is shown in Fig. 11. Some artifacts can be seen in the surrounding medium while no vessels are seen. Therefore, the local relative weight of the flow component can be used to wash-out fitting artifacts and enhance local flow maps. The quantity can be assessed from the fitting procedure. For the rms velocity map shown on Fig. 11, only the velocity corresponding to a weight greater than 35% is taken into account. Below the threshold value of 35%, the fitting procedure has the tendency to derive aberrant velocity values from noise.
VII Conclusions
We demonstrated that holographic laser Doppler imaging has the potential to enable quantitative assessment of hemodynamic parameters. Cerebral and retinal blood flow was mapped in the superficial microvasculature of rodents. Frequency-scanned narrowband detection of Doppler components with a spectral resolution of a few Hertz was performed; Doppler spectra at radiofrequencies up to 100 kHz for a radiation wavelength of 785 nm revealed contrasts of microvascular blood flow. We derived quantitative quadratic mean blood flow velocity maps by using the first-order power spectrum of optical fluctuations from a basic inverse-problem model involving the diffusing-wave spectroscopy formalism. In vitro validation of this method allowed steady-state rms assessment of fluid flow from to . The low speed limit being due either to the dependence of the signal on dynamic background flows or thermal motion. The lateral spatial resolution of about 10 microns is compatible with the visualization of the smallest superficial vessels and arteries, but because of random scattering of light in tissue, flow direction is lost, and no depth sectioning is demonstrated here, in contrast to optical Doppler tomography Wang2008 . Furthermore, strong hypotheses are made in the inverse problem formulation, which include multiple random light scattering in a semi-infinite medium, homogenous optical index of refraction, steady-state flows, uncorrelated velocities, and the presence of a fitting parameter.
Optical techniques provide suitable non-contact ways of obtaining superficial microvascular blood flow images at high resolution. They are good candidates for the development of robust quantitative, non-invasive, non-ionizing motion screening tools. The key benefits of holography with respect to the state-of-the-art optical schemes for blood flow imaging is its propensity to reveal Doppler contrasts of microvascular blood flow in low-light, which is a strong competitive advantage for retinal monitoring, and quantitative fluctuation spectra, from which local dynamical properties can be assessed. Furthermore, holography is suited to the design of robust microrheological imaging tools without any contrast agent, that could be used for clinical exploration of retinal blood flow. The major drawback of time-averaged holographic detection of blood flow is poor temporal resolution, due to sequential frequency-scanning of the Doppler spectrum. In particular, pulsatile flow could not be assessed. Potential ways of circumventing this issue may be to limit the acquisition to one Doppler component with a faster camera, or to have recourse to high-speed Fourier-transform Doppler imaging SamsonVerpillat2011 ; SamsonAtlan2013 and/or logarithmic frequency chirps of the detection frequency. Also, local Leutenegger2011 or even on-chip LaforestDupret2013 ; HeNguyen2013 processing of the optical measurements with sensor arrays can be investigated.
Acknowledgements
We gratefully acknowledge support from Agence Nationale de la Recherche (ANR-09-JCJC-0113, ANR-11-EMMA-046), Fondation Pierre-Gilles de Gennes (FPGG014), région Ile-de-France (C’Nano, AIMA), the ”investments for the future” program (LabEx WIFI: ANR-10-LABX-24, ANR-10-IDEX-0001-02 PSL*), and European Research Council (ERC Synergy HELMHOLTZ).
References
- (1) KM Gooding, JE Tooke, H von Lany, M Mitra, R Ling, CI Ball, D Mawson, K Skinner, and AC Shore. Capillary pressure may predict preclinical changes in the eye. Diabetologia, 53(9):2029–2035, 2010.
- (2) Harry AJ Struijker-Boudier, Bart FJ Heijnen, Yan-Ping Liu, and Jan A Staessen. Phenotyping the microcirculation. Hypertension, 60(2):523–527, 2012.
- (3) H.A.J. Struijker-Boudier and BartF. J. Heijnen. The Microcirculation and Hypertension. Springer Milan, 2012.
- (4) Marc Rendell, Tom Bergman, Greg O’Donnell, ED Drobny, John Borgos, and Robert F Bonner. Microvascular blood flow, volume, and velocity measured by laser doppler techniques in iddm. Diabetes, 38(7):819–824, 1989.
- (5) O Schlager, A Hammer, A Willfort-Ehringer, M Fritsch, B Rami-Merhar, E Schober, K Nagl, A Giurgea, C Margeta, S Zehetmayer, et al. Microvascular autoregulation in children and adolescents with type 1 diabetes mellitus. Diabetologia, 55(6):1633–1640, 2012.
- (6) PRJ Vas, AQ Green, and G Rayman. Small fibre dysfunction, microvascular complications and glycaemic control in type 1 diabetes: a case–control study. Diabetologia, 55(3):795–800, 2012.
- (7) JE Grunwald, AJ Brucker, SE Grunwald, and CE Riva. Retinal hemodynamics in proliferative diabetic retinopathy. a laser doppler velocimetry study. Invest. Ophthalmol. Vis. Sci., 34(1):66–71, 1993.
- (8) Nobuyuki Koseki, Makoto Araie, Atsuo Tomidokoro, Miyuki Nagahara, Tomoyuki Hasegawa, Yasuhiro Tamaki, and Seiichiro Yamamoto. A placebo-controlled 3-year study of a calcium blocker on visual field and ocular circulation in glaucoma with low-normal pressure. Ophthalmology, 115(11):2049–2057, 2008.
- (9) Subha T Venkataraman, John G Flanagan, and Chris Hudson. Vascular reactivity of optic nerve head and retinal blood vessels in glaucoma—a review. Microcirculation, 17(7):568–581, 2010.
- (10) Tetsuya Sugiyama, Maho Shibata, Shota Kojima, and Tsunehiko Ikeda. Optic nerve head blood flow in glaucoma. The Mystery of Glaucoma, T. Kubena, ed.(InTech, 2011), pages 207–218, 2011.
- (11) Doreen Schmidl, Agnes Boltz, Semira Kaya, Rene Werkmeister, Nikolaus Dragostinoff, Michael Lasta, Elzbieta Polska, Gerhard Garhöfer, and Leopold Schmetterer. Comparison of choroidal and optic nerve head blood flow regulation during changes in ocular perfusion pressure. Investigative Ophthalmology & Visual Science, 53(8):4337–4346, 2012.
- (12) John C Hwang, Ranjith Konduru, Xinbo Zhang, Ou Tan, Brian A Francis, Rohit Varma, Mitra Sehi, David S Greenfield, SriniVas R Sadda, and David Huang. Relationship among visual field, blood flow, and neural structure measurements in glaucoma. Investigative Ophthalmology & Visual Science, 53(6):3020–3026, 2012.
- (13) Sandrine Kubli, Bernard Waeber, Anne Dalle-Ave, and François Feihl. Reproducibility of laser doppler imaging of skin blood flow as a tool to assess endothelial function. Journal of cardiovascular pharmacology, 36(5):640–648, 2000.
- (14) Jean-Luc Cracowski, Christopher T Minson, Muriel Salvat-Melis, and John R Halliwill. Methodological issues in the assessment of skin microvascular endothelial function in humans. Trends in pharmacological sciences, 27(9):503–508, 2006.
- (15) Lacy A Holowatz, Caitlin S Thompson-Torgerson, and W Larry Kenney. The human cutaneous circulation as a model of generalized microvascular function. Journal of Applied Physiology, 105(1):370–372, 2008.
- (16) Faisel Khan, Dean Patterson, Jill Belch, Kumiko Hirata, and Chim Lang. Relationship between peripheral and coronary function using laser doppler imaging and transthoracic echocardiography. Clinical Science, 115:295–300, 2008.
- (17) Jamie Turner, Jill JF Belch, and Faisel Khan. Current concepts in assessment of microvascular endothelial function using laser doppler imaging and iontophoresis. Trends in cardiovascular medicine, 18(4):109–116, 2008.
- (18) Heleen van Herpt, Matthijs Draijer, Erwin Hondebrink, Marianne Nieuwenhuis, Gerard Beerthuizen, Ton van Leeuwen, and Wiendelt Steenbergen. Burn imaging with a whole field laser doppler perfusion imager based on a cmos imaging array. Burns, 36(3):389–396, 2010.
- (19) A Humeau-Heurtier, E Guerreschi, P Abraham, and G Mahe. Relevance of laser doppler and laser speckle techniques for assessing vascular function: State of the art and future trends. IEEE transactions on bio-medical engineering, 2013.
- (20) Y. Yeh and H. Z. Cummins. Localized fluid flow measurements with an he-ne laser spectrometer. Appl. Phys. Lett., 4:176–179, 1964.
- (21) M. D. Stern. In vivo evaluation of microcirculation by coherent light scattering. Nature, 254(5495):56–58, March 1975.
- (22) R. Bonner and R. Nossal. Model for laser doppler measurements of blood flow in tissue. Applied Optics, 20:2097–2107, 1981.
- (23) M. Heckmeier, S. E. Skipetrov, G. Maret, and R. Maynard. Imaging of dynamic heterogeneities in multiple-scattering media. J. Opt. Soc. Am. A, 14(1):185–191, 1997.
- (24) Gilbert T Feke and Charles E Riva. Laser doppler measurements of blood velocity in human retinal vessels. JOSA, 68(4):526–531, 1978.
- (25) L. Schmetterer and M. Wolzt. Ocular blood flow and associated functional deviations in diabetic retinopathy. Diabetologia, 42(4):387–405, 1999.
- (26) E. Sato, G.T. Feke, M.N. Menke, and J.W. McMeel. Retinal haemodynamics in patients with age-related macular degeneration. Eye, 20:697–702, 2006.
- (27) C Riva, B Ross, and G B. Benedek. Laser doppler measurements of blood flow in capillary tubes and retinal arteries. Invest. Ophthalmol. Vis. Sci., 11(11):936–944, 1972.
- (28) J. D. Briers. Laser doppler and time-varying speckle: a reconciliation. JOSA A., 13:345–350, 1996.
- (29) C. E. Riva, G. T. Feke, B. Eberli, and V. Benary. Bidirectional ldv system for absolute measurement of blood speed in retinal vessels. Applied Optics, 18:2301–2306, July 1979.
- (30) G Michelson, B Schmauss, MJ Langhans, J Harazny, and MJ Groh. Principle, validity, and reliability of scanning laser doppler flowmetry. J. Glaucoma., 5(2):99–105, 1996.
- (31) R. D. Ferguson, D. X. Hammer, A. E. Elsner, R. H. Webb, S. A. Burns, and J. J. Weiter. Wide-field retinal hemodynamic imaging with the tracking scanning laser ophthalmoscope. Optics Express, 12:5198–+, August 2004.
- (32) Vinayakrishnan Rajan, Babu Varghese, Ton G van Leeuwen, and Wiendelt Steenbergen. Review of methodological developments in laser doppler flowmetry. Lasers in medical science, 24(2):269–283, 2009.
- (33) Gert E Nilsson, Torsten Tenland, and P Ake Oberg. Evaluation of a laser doppler flowmeter for measurement of tissue blood flow. Biomedical Engineering, IEEE Transactions on, (10):597–604, 1980.
- (34) FFM De Mul, J Van Spijker, D Van der Plas, J Greve, JG Aarnoudse, and TM Smits. Mini laser-doppler (blood) flow monitor with diode laser source and detection integrated in the probe. Applied optics, 23(17):2970–2973, 1984.
- (35) Thierry Bosch, Silvano Donati, et al. Optical feedback interferometry for sensing application. Optical engineering, 40(1):20–27, 2001.
- (36) Milan Nikolić, Elaine Hicks, Yah Leng Lim, Karl Bertling, and Aleksandar D Rakić. Self-mixing laser doppler flow sensor: an optofluidic implementation. Applied Optics, 52(33):8128–8133, 2013.
- (37) J. A. Izatt, M. D. Kulkarni, S. Yazdanfar, J. K. Barton, and A. J. Welch. In vivo bidirectional color doppler flow imagingof picoliter blood volumes using optical coherence tomography. Optics Letters, 22:1439–1441, September 1997.
- (38) Rainer Leitgeb, L Schmetterer, W Drexler, A Fercher, R Zawadzki, and T Bajraszewski. Real-time assessment of retinal blood flow with ultrafast acquisition by color doppler fourier domain optical coherence tomography. Optics Express, 11(23):3116–3121, 2003.
- (39) L. An and R.K. Wang. In vivo volumetric imaging of vascular perfusion within human retina and choroids with optical micro-angiography. Optics Express, 16(15):11438–11452, 2008.
- (40) Lin An, Peng Li, Gongpu Lan, Doug Malchow, and Ruikang K Wang. High-resolution 1050 nm spectral domain retinal optical coherence tomography at 120 khz a-scan rate with 6.1 mm imaging depth. Biomedical optics express, 4(2):245, 2013.
- (41) Matthijs Draijer, Erwin Hondebrink, Ton van Leeuwen, and Wiendelt Steenbergen. Review of laser speckle contrast techniques for visualizing tissue perfusion. Lasers in medical science, 24(4):639–651, 2009.
- (42) David A Boas and Andrew K Dunn. Laser speckle contrast imaging in biomedical optics. Journal of biomedical optics, 15(1):011109–011109, 2010.
- (43) Andrew K Dunn. Laser speckle contrast imaging of cerebral blood flow. Annals of biomedical engineering, 40(2):367–377, 2012.
- (44) Kausik Basak, M Manjunatha, and Pranab Kumar Dutta. Review of laser speckle-based analysis in medical imaging. Medical & biological engineering & computing, 50(6):547–558, 2012.
- (45) Claudia P. Valdes, Hari M. Varma, Anna K. Kristoffersen, Tanja Dragojevic, Joseph P. Culver, and Turgut Durduran. Speckle contrast optical spectroscopy, a non-invasive, diffuse optical method for measuring microvascular blood flow in tissue. Biomed. Opt. Express, 5(8):2769–2784, Aug 2014.
- (46) A. F. Fercher and J. D. Briers. Flow visualisation by means of single-exposure speckle photography. Opt. Commun., 37:326–330, 1981.
- (47) J. A. Briers and S. Webster. Quasi real-time digital version of single-exposure speckle photography for full-field monitoring of velocity or flow fields. Optics Comm., 116:36–42, 1995.
- (48) J. D. Briers. Laser doppler, speckle and related techniques for blood perfusion mapping and imaging. Physiological Measurement, 22:R35–R66, 2001.
- (49) M Roustit, C Millet, S Blaise, B Dufournet, and JL Cracowski. Excellent reproducibility of laser speckle contrast imaging to assess skin microvascular reactivity. Microvascular research, 80(3):505–511, 2010.
- (50) Lisa M. Richards, S. M. Shams Kazmi, Janel L. Davis, Katherine E. Olin, and Andrew K. Dunn. Low-cost laser speckle contrast imaging of blood flow using a webcam. Biomed. Opt. Express, 4(10):2269–2283, Oct 2013.
- (51) R. Bandyopadhyay, A. S. Gittings, S. S. Suh, P. K. Dixon, and D. J. Durian. Speckle-visibility spectroscopy: A tool to study time-varying dynamics. Review of Scientific Instruments, 76(9):093110, 2005.
- (52) Ashwin B Parthasarathy, W James Tom, Ashwini Gopal, Xiaojing Zhang, Andrew K Dunn, et al. Robust flow measurement with multi-exposure speckle imaging. Opt. Express, 16(3):1975–1989, 2008.
- (53) Pavel Zakharov, Andreas Völker, Alfred Buck, Bruno Weber, and Frank Scheffold. Quantitative modeling of laser speckle imaging. Opt. Lett., 31(23):3465–3467, 2006.
- (54) Haiying Cheng and Timothy Q. Duong. Simplified laser-speckle-imaging analysis method and its application to retinal blood flow imaging. Opt. Lett., 32(15):2188–2190, Aug 2007.
- (55) Anja I Srienc, Zeb L Kurth-Nelson, and Eric A Newman. Imaging retinal blood flow with laser speckle flowmetry. Frontiers in neuroenergetics, 2, 2010.
- (56) Adrien Ponticorvo, Damon Cardenas, Andrew K Dunn, Daniel Ts’o, and Timothy Q Duong. Laser speckle contrast imaging of blood flow in rat retinas using an endoscope. Journal of biomedical optics, 18(9):090501–090501, 2013.
- (57) A. Dunn, H. Bolay, M. A. Moskowitz, and D. A. Boas. Dynamic imaging of cerebral blood flow using laser speckle. Jounal of Cerebral Blood Flow and Metabolism, 21(3):195–201, 2001.
- (58) A. Dunn, A. Devor, M. Andermann, H. Bolay, M. Moskowitz, A. Dale, and D. Boas. Simultaneous imaging of total cerebral hemoglobin concentration, oxygenation and blood flow during functional activation. Optics Letters, 28:28–30, 2003.
- (59) AK Dunn, A Devor, AM Dale, and Boas DA. Spatial extent of oxygen metabolism and hemodynamic changes during functional activation of the rat somatosensory cortex. Neuroimage, 27(2):279–90, 2005.
- (60) D.D. Duncan and S.J. Kirkpatrick. Can laser speckle flowmetry be made a quantitative tool? JOSA A, 25(8):2088–2094, 2008.
- (61) Pavel Zakharov, AC Völker, MT Wyss, F Haiss, N Calcinaghi, C Zunzunegui, Alfred Buck, Frank Scheffold, Bruno Weber, et al. Dynamic laser speckle imaging of cerebral blood flow. Opt. Express, 17(16):13904–13917, 2009.
- (62) Ashwin B Parthasarathy, SM Shams Kazmi, and Andrew K Dunn. Quantitative imaging of ischemic stroke through thinned skull in mice with multi exposure speckle imaging. Biomedical optics express, 1(1):246, 2010.
- (63) Ashwin B Parthasarathy, Erica L Weber, Lisa M Richards, Douglas J Fox, and Andrew K Dunn. Laser speckle contrast imaging of cerebral blood flow in humans during neurosurgery: a pilot clinical study. Journal of biomedical optics, 15(6):066030–066030, 2010.
- (64) Eva Klijn, Hester C Hulscher, Rutger K Balvers, Wim PJ Holland, Jan Bakker, Arnaud JPE Vincent, Clemens MF Dirven, and Can Ince. Laser speckle imaging identification of increases in cortical microcirculatory blood flow induced by motor activity during awake craniotomy: Clinical article. Journal of neurosurgery, 118(2):280–286, 2013.
- (65) A. Serov, W. Steenbergen, and F. de Mul. Laser doppler perfusion imaging with complementary metal oxide semiconductor image sensor. Optics Letters, 27:300–302, 2002.
- (66) A. Serov, B. Steinacher, and T. Lasser. Full-field laser doppler perfusion imaging monitoring with an intelligent cmos camera. Opt. Ex., 13(10):3681–3689, 2005.
- (67) Haiying Cheng, Yumei Yan, and Timothy Q Duong. Temporal statistical analysis of laser speckle images and its application to retinal blood-flow imaging. Optics express, 16(14):10214, 2008.
- (68) Matthijs Draijer, Erwin Hondebrink, Ton van Leeuwen, and Wiendelt Steenbergen. Twente optical perfusion camera: system overview and performance for video rate laser doppler perfusion imaging. Optics express, 17(5):3211–3225, 2009.
- (69) Dake Wang, Adam Moyer, and Matt Henderson. Intensity fluctuation spectra of dynamic laser speckle patterns acquired by a full-field temporal modulation method. Applied optics, 51(31):7576–7580, 2012.
- (70) Yaguang Zeng, Mingyi Wang, Guangping Feng, Xianjun Liang, and Guojian Yang. Laser speckle imaging based on intensity fluctuation modulation. Opt. Lett., 38(8):1313–1315, Apr 2013.
- (71) Mingyi Wang, Yaguang Zeng, Xianjun Liang, Guanping Feng, Xuanlong Lu, Junbo Chen, Dingan Han, and Guojian Yang. In vivo label-free microangiography by laser speckle imaging with intensity fluctuation modulation. Journal of Biomedical Optics, 18(12):126001–126001, 2013.
- (72) M. Leutenegger, E. Martin-Williams, P. Harbi, T. Thacher, W. Raffoul, M. André, A. Lopez, P. Lasser, and T. Lasser. Real-time full field laser doppler imaging. Biomedical Optics Express, 2(6):1470–1477, 2011.
- (73) Quan Gu, Barrie R Hayes-Gill, and Stephen P Morgan. Laser doppler blood flow complementary metal oxide semiconductor imaging sensor with analog on-chip processing. Applied optics, 47(12):2061–2069, 2008.
- (74) D He, HC Nguyen, BR Hayes-Gill, Y Zhu, JA Crowe, GF Clough, CA Gill, and SP Morgan. 64 64 pixel smart sensor array for laser doppler blood flow imaging. Optics Letters, 37(15):3060–3062, 2012.
- (75) Hoang C Nguyen, Barrie R Hayes-Gill, Yiqun Zhu, John A Crowe, Diwei He, and Stephen P Morgan. Low resource processing algorithms for laser doppler blood flow imaging. Medical engineering & physics, 33(6):720–729, 2011.
- (76) Diwei He, Hoang C Nguyen, Barrie R Hayes-Gill, Yiqun Zhu, John A Crowe, Cally Gill, Geraldine F Clough, and Stephen P Morgan. Laser doppler blood flow imaging using a cmos imaging sensor with on-chip signal processing. Sensors, 13(9):12632–12647, 2013.
- (77) Joseph L Calkins and Carl D Leonard. Holographic recording of a retina using a continuous wave laser. Investigative Ophthalmology & Visual Science, 9(6):458–462, 1970.
- (78) R. L. Wiggins, K. D. Vaughan, and G. B. Friedmann. Holography using a fundus camera. Appl. Opt., 11(1):179–181, Jan 1972.
- (79) AN Rosen. Holographic fundoscopy with fibre optic illumination. Optics & Laser Technology, 7(3):127–129, 1975.
- (80) H Ohzu and T Kawara. Application of holography in ophthalmology. pages 133–146, 1979.
- (81) Allan R Tokuda, David C Auth, and Adam P Bruckner. Holocamera for 3-d micrography of the alert human eye. Applied Optics, 19(13):2219–2225, 1980.
- (82) M. Atlan, M. Gross, T. Vitalis, A. Rancillac, B. C. Forget, and A. K. Dunn. Frequency-domain, wide-field laser doppler in vivo imaging. Optics Letters, 31(18):2762–2764, 2006.
- (83) M. Simonutti, M. Paques, J. A. Sahel, M. Gross, B. Samson, C. Magnain, and M. Atlan. Holographic laser doppler ophthalmoscopy. Opt. Lett., 35(12):1941–1943, 2010.
- (84) M. Atlan, M. Gross, and J. Leng. Laser doppler imaging of microflow. Journal of the European Optical Society - Rapid publications, 1:06025–1, 2006.
- (85) M. Atlan and M. Gross. Laser doppler imaging, revisited. Review of Scientific Instruments, 77(11):1161031–1161034, 2006.
- (86) Nicolas Verrier, Daniel Alexandre, and Michel Gross. Laser doppler holographic microscopy in transmission: application to fish embryo imaging. Opt. Express, 22(8):9368–9379, Apr 2014.
- (87) M. Atlan, M. Gross, T. Vitalis, A. Rancillac, J. Rossier, and A. C. Boccara. High-speed wave-mixing laser doppler imaging in vivo. Optics Letters, 33(8):842–844, 2008.
- (88) M. Atlan and M. Gross. Spatiotemporal heterodyne detection. Journal of the Optical Society of America A, 24(9):2701–2709, 2007.
- (89) D.A. Boas and A.G. Yodh. Spatially varying dynamical properties of turbid media probed with diffusing temporal light correlation. J. Opt. Soc. Am. A, 14:192–215, 1997.
- (90) D. J. Pine, D. A. Weitz, P. M. Chaikin, and E. Herbolzheimer. Diffusing-wave spectroscopy. Physical Review Letters, 60(12):1134–1137, 1988.
- (91) AH Gandjbakhche, R. Nossal, and RF Bonner. Scaling relationships for theories of anisotropic random walks applied to tissue optics. Appl. Opt, 32(4):504–516, 1993.
- (92) U. Schnars and W. Juptner. Direct recording of holograms by a ccd target and numerical reconstruction. Appl. Opt., 33:179–181, 1994.
- (93) U. Schnars and W. P. O. Juptner. Digital recording and numerical reconstruction of holograms. Meas. Sci. Technol., 13:R85–R101, 2002.
- (94) Myung K Kim, Lingfeng Yu, and Christopher J Mann. Interference techniques in digital holography. Journal of Optics A: Pure and Applied Optics, 8(7):S518–S523, 2006.
- (95) Pascal Picart and Julien Leval. General theoretical formulation of image formation in digital fresnel holography. JOSA A, 25(7):1744–1761, 2008.
- (96) Nicolas Verrier and Michael Atlan. Off-axis digital hologram reconstruction: some practical considerations. Appl. Opt., 50(34):H136–H146, Dec 2011.
- (97) Michael Atlan, Pierre Desbiolles, Michel Gross, and Maïté Coppey-Moisan. Parallel heterodyne detection of dynamic light-scattering spectra from gold nanoparticles diffusing in viscous fluids. Opt. Lett., 35(5):787–789, 2010.
- (98) M. Gross and M. Atlan. Digital holography with ultimate sensitivity. Optics Letters, 32(8):909–911, 2007.
- (99) RL Whitman and A Korpel. Probing of acoustic surface perturbations by coherent light. Applied Optics, 8(8):1567–1576, 1969.
- (100) M. Ueda, S. Miida, and T. Sato. Signal-to-noise ratio and smallest detectable vibration amplitude in frequency-translated holography: an analysis. Applied Optics, 15(11):2690–2694, 1976.
- (101) Jean-Pierre Monchalin. Heterodyne interferometric laser probe to measure continuous ultrasonic displacements. Review of scientific instruments, 56(4):543–546, 1985.
- (102) James W Wagner and James B Spicer. Theoretical noise-limited sensitivity of classical interferometry. JOSA B, 4(8):1316–1326, 1987.
- (103) D Royer and E Dieulesaint. Optical probing of the mechanical impulse response of a transducer. Applied physics letters, 49(17):1056–1058, 1986.
- (104) P. Picart, J. Leval, D. Mounier, and S. Gougeon. Time-averaged digital holography. Opt. Lett., 28:1900–1902, 2003.
- (105) JM Schmitt, AH Gandjbakhche, and RF Bonner. Use of polarized light to discriminate short-path photons in a multiply scattering medium. Appl. Opt, 31(30):6535, 1992.
- (106) L Rovati, S Cattini, N Zambelli, F Viola, and G Staurenghi. In-vivo diffusing-wave-spectroscopy measurementes of the ocular fundus. Optics express, 15(7):4030–4038, 2007.
- (107) Yu Lin, Lian He, Yu Shang, and Guoqiang Yu. Noncontact diffuse correlation spectroscopy for noninvasive deep tissue blood flow measurement. Journal of Biomedical Optics, 17(1):0105021–0105023, 2012.
- (108) Stefano Cattini, Giovanni Staurenghi, Antonietta Gatti, and Luigi Rovati. In vivo diffuse correlation spectroscopy investigation of the ocular fundus. Journal of biomedical optics, 18(5):057001–057001, 2013.
- (109) Norbert Wiener. Generalized harmonic analysis. Acta Mathematica, 55(1):117–258, 1930.
- (110) B.E.A. Saleh and M.C. Teich. Fundamentals of photonics. Wiley, 1991.
- (111) Joseph W. Goodman. Statistical Optics. John Wiley & Sons, 1985.
- (112) D. Kumar and P.M. Bellan. Heterodyne interferometer with unequal path lengths. Review of scientific instruments, 77(8):083503–083503, 2006.
- (113) B. J. Berne and R. Pecora. Dynamic Light Scattering. Dover, 2000.
- (114) XL Wu, DJ Pine, PM Chaikin, JS Huang, and DA Weitz. Diffusing-wave spectroscopy in a shear flow. J. Opt. Soc. Am. B, 7(1):15–20, 1990.
- (115) Haruo Ogiwara. Laser doppler velocimeter with a differential photodiode array. Applied optics, 18(10):1533–1538, 1979.
- (116) Yogesh Chandra Agrawal and James R McCullough. Directional pedestal-free laser doppler velocimetry without frequency biasing. part 1. Applied Optics, 20(9):1553–1556, 1981.
- (117) Martine Rousseau. Statistical properties of optical fields scattered by random media. application to rotating ground glass. JOSA, 61(10):1307–1316, 1971.
- (118) LE Estes, LM Narducci, and RA Tuft. Scattering of light from a rotating ground glass. JOSA, 61:1301, 1971.
- (119) B. P. Singh and S. Chopra. Investigations of the autocorrelation function for inhomogeneous scatterers. JOSAA, 9:619–620, 1992.
- (120) Jicun Zhong, Alexander M Seifalian, Goran E Salerud, and Gert E Nilsson. A mathematical analysis on the biological zero problem in laser doppler flowmetry. Biomedical Engineering, IEEE Transactions on, 45(3):354–364, 1998.
- (121) DP Kernick, JE Tooke, and AC Shore. The biological zero signal in laser doppler fluximetry–origins and practical implications. Pflügers Archiv, 437(4):624–631, 1999.
- (122) Dirk J Faber, Maurice CG Aalders, Egbert G Mik, Brett A Hooper, Martin JC Gemert, and Ton G Leeuwen. Oxygen saturation-dependent absorption and scattering of blood. Physical review letters, 93(2):028102, 2004.
- (123) Jonas Binding, Juliette Ben Arous, Jean-François Léger, Sylvain Gigan, Claude Boccara, and Laurent Bourdieu. Brain refractive index measured in vivo with high-na defocus-corrected full-field oct and consequences for two-photon microscopy. Optics express, 19(6):4833–4847, 2011.
- (124) Lorrin A Riggs, John C Armington, and Floyd Ratliff. Motions of the retinal image during fixation. JOSA, 44(4):315–321, 1954.
- (125) Gerald Westheimer and Suzanne P McKee. Visual acuity in the presence of retinal-image motion. JOSA, 65(7):847–850, 1975.
- (126) Kate Grieve, Michel Paques, Arnaud Dubois, Jose Sahel, Claude Boccara, and Jean-Francois Le Gargasson. Ocular tissue imaging using ultrahigh-resolution, full-field optical coherence tomography. Invest. Ophthalmol. Vis. Sci., 45(11):4126–4131, 2004.
- (127) Ruikang K. Wang. Directional blood flow imaging in volumetric optical microangiography achieved by digital frequency modulation. Opt. Lett., 33(16):1878–1880, 2008.
- (128) Benjamin Samson, Frédéric Verpillat, Michel Gross, and Michael Atlan. Video-rate laser doppler vibrometry by heterodyne holography. Opt. Lett., 36(8):1449–1451, Apr 2011.
- (129) B. Samson and M. Atlan. Short-time fourier transform laser doppler holography. Journal of the European Optical Society - Rapid publications, 8(0), 2013.
- (130) Timothe Laforest, Antoine Dupret, Arnaud Verdant, François Ramaz, Sylvain Gigan, Gilles Tessier, and Emilie Benoit la Guillaume. A 4000 hz cmos image sensor with in-pixel processing for light measurement and modulation. pages 1–4, 2013.