Charmonium spectra and dispersion relation with improved Bayesian analysis in lattice QCD
Abstract:
We study the charmonium spectral functions at finite momentum and the dispersion relation of at finite temperature. For the analysis of the spectral function, we use an extended maximum entropy method (MEM). We perform the MEM analysis for the product space of Euclidean correlators in different channels or momenta to incorporate information encoded in correlations among the Euclidean correlators in MEM. We find that this method can improve the error of the reconstructed spectral images. To study the dispersion relation, we introduce a definition of the peak position in the spectral image in which the associated error can be estimated on the basis of MEM. We find that the dispersion relation of at finite temperature follows the Lorentz invariant form even near the dissociation temperature .
1 Introduction
The Quark-Gluon Plasma (QGP) near the pseudo critical temperature () is believed to be a strongly interacting liquid-like matter. Lattice QCD is a powerful method to study properties of the QGP in such a non-perturabative environment. The dynamical properties of QGP near are among the most interesting subjects in this field. The spectral function is a useful quantity to study the dynamical properties of the system. A peak in the spectral function represents the existence of a bound state [1, 2]. The vector spectral function is related to the thermal dilepton production rate [3, 4] and its slope at the origin is related to transport properties according to the Kubo formulae [5].
On the lattice, however, directly we can only calculate the imaginary time correlation functions. Thus, we must perform the analytic continuation to obtain the spectral function, which is the imaginary part of the real time correlator. The solution to this problem is non-trivial, because it is impossible to reconstruct a continuum function from a limited number of data points without some assumptions [6, 7]. Maximum Entropy Method (MEM) [8] is one of the well-known methods to deal with this problem. With MEM, spectral functions are reconstructed from the lattice correlator and prior knowledge. One of the advantages of MEM is that this method enables us to estimate the probabilistic error of the reconstructed image.
The charmonia created in heavy ion collisions move through the QGP medium. However, only charmonia with zero momentum have been mainly considered on the lattice in the previous research [9, 10] (for some exceptions, see, for example [11]). The purpose of the present study is to investigate dynamical properties of charmonia in the pseudoscalar channel at finite momenta at finite temperature (). To this end, we analyze the spectral function related to the lattice Euclidean correlators as
| (1) |
where the kernel of the integral transformation is given by with the imaginary time . is the local interpolating operator for the pseudoscalar channel. We also analyze the dispersion relation of charmonia defined by the peak position of the spectral function corresponding to .
In this work, we perform the MEM analyses in an extended vector space, which is a product space of two different sets of lattice correlators. Different lattice correlators measured with the same set of gauge configurations have a strong correlation among them. Our analysis takes advantage of the correlation in the MEM analysis. We find that our method improves the reconstructed images.
2 Maximum Entropy Method
Let us first briefly review the basic points of MEM. To obtain the spectral functions from the lattice Euclidean correlators, we have to take the inverse transformation of eq. (1). MEM reconstructs the most probable image from limited number of data points for with errors on the basis of Bayes’ theorem. In the standard method of least squares, the solution is determined so as to minimize the value of the chi-square,
| (2) |
where the correlations between the lattice correlator with different time slices are encoded in the covariance matrix . The discretization of the variables is understood. However, the minimum of are degenerating. In other words, there exist infinite number of spectral images that optimize the . In order to avoid this degeneracy, MEM introduces the Shannon-Jaynes entropy [12],
| (3) |
where the default model expresses the prior knowledge. Then, we search the most probable image that maximizes the probability with
| (4) |
The parameter controls the relative weight between and . The final output image is then obtained by integrating over and as
| (5) |
One of the advantages of MEM is that this method enables us to estimate the error in the reconstructed image probabilistically. For example, errors can be put on the average of the spectral image in some section as
| (6) |
where and is the image which maximizes the probability with some . The reduction of error is highly desirable to extract physics by MEM analyses.
3 An extension of MEM
To analyze observables on the lattice, we first generate gauge configurations with Monte Carlo method, and then perform the measurement on each configuration. Since the Euclidean correlators with different values on each configuration are correlated, the lattice correlators usually have strong mutual correlations between different time slices. In the same way, different correlators, such as those for different channels or different momenta, measured on a same set of gauge configurations can have strong correlations.
Our strategy is to utilize this correlation in MEM analysis. For this purpose, we perform the MEM analysis for two or more correlators together, by treating these correlators on the lattice as one vector. For simplicity, we limit the discussion to the case of two correlators, and , in the following. Equation (4) is then extended as,
| (7) |
where is the chi-square including the correlation between and ; the correlation between different channels can be incorporated by defining the covariance matrix in a usual manner.
In this extended analysis, correlations between the spectral images of different channels are incorporated. When one investigates the difference of two spectral functions, for example, this method will drastically reduce the error. It is also expected that the quality of the reconstructed image in a single channel can be improved, because information which is not taken into account in the conventional analysis is newly included in the extended one. In sec. 4, we will see that this is indeed the case at least for some cases.
When we perform the extended analysis with eq. (7), and should be treated as independent parameters. The integrals in eqs. (5) and (6) should be extended to two-dimensional ones with regard to and . When the correlators for two channels are uncorrelated, the extended analysis reduces to two independent MEM analyses for these channels. In this exploratory analysis, however, we limit our analysis to the case to reduce the numerical cost, and take the integrals in this one-dimensional space. This treatment could lead to incorrect conclusions, because ’s which maximize the probability is different for each correlator when each correlator is separately analyzed. If ’s are much different for and , the reconstructed image with a common becomes much distorted. An analysis with multi-dimensional is under investigation.
When we perform the extended MEM analysis with several correlators, however, requirements for numerical analysis become more severe. First, as the search space becomes larger the numerical cost for the minimum search becomes higher. Second, the eigenvalue spectrum of the covariance matrix is known to show a pathological behavior when is not large enough compared to the matrix dimension [7]. Thus, to perform a reliable analysis, we need more configurations as the number of channels increases. There is another numerical problem. If the correlation between the correlators is too strong, the covariance matrix becomes almost singular. In this case, we need numerically high precision to carry out the inversion of the covariance matrix.
4 Spectral function
| 42 | 1.78 | 64 | 2.496 | 0.00975 | 4 | 7.0 | 427 |
| 44 | 1.70 | 64 | 2.496 | 0.00975 | 4 | 7.0 | 407 |
| 46 | 1.62 | 64 | 2.496 | 0.00975 | 4 | 7.0 | 401 |
| 96 | 0.78 | 64 | 2.496 | 0.00975 | 4 | 7.0 | 207 |
We have analyzed the charmonium correlation functions in the pseudoscalar channel in quenched QCD with the standard Wilson fermion on an anisotropic lattice with the anisotropy being [13]. The simulation parameters are summarized in Table 1 [13]. All results in what follows are obtained with the default model with [7].
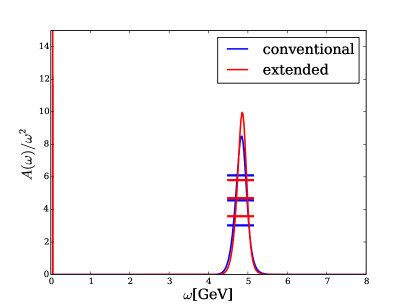
The left panel of fig. 1 shows the result for the spectral functions with at with the conventional and extended analyses. In the extended analysis, we have used two correlators with and . The figure shows that the MEM error of the reconstructed image obtained by the extended analysis is reduced by about and the width of peak becomes narrower than the one with the conventional one. This result indicates that the extended analysis is effective to improve the quality of the MEM image even when a single channel is concerned. We, however, have found that the error becomes larger in another channel at in the extended analysis. Our numerical analyses suggest that one reconstructed image tends to be improved while the other tends to be distorted. This may be caused by the imbalance between the ratio of correlators and the ratio of the eigenvectors of the covariance matrices for different momenta even in the same channel. If these ratios are not balanced, one image can be worsen. We intend to investigate in what situation both images are improved and the work in this direction is in progress.
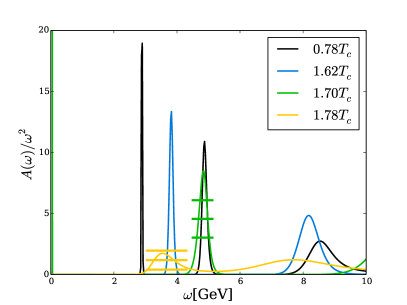
The right panel of fig. 1 shows the spectral functions at zero momentum for several values of obtained by the conventional method. The peak corresponding to exists for , while the peak disappears at . This result suggests that still survives at .
5 Dispersion relation of in medium
Next, we investigate the dispersion relation, i.e. dependence of the peak position, of the first peak corresponding to for . It is, however, not trivial how to define the location of the peak and its error in MEM. For example, the position and width of a peak in a spectral image obtained by MEM do not have physical meaning and we cannot estimate their errors [7]. In the present study, we thus consider the center of the weight of a peak
| (8) |
for an energy interval including the peak structure. Then one can estimate the error for this quantity as in MEM in a standard way as in eq. (6).
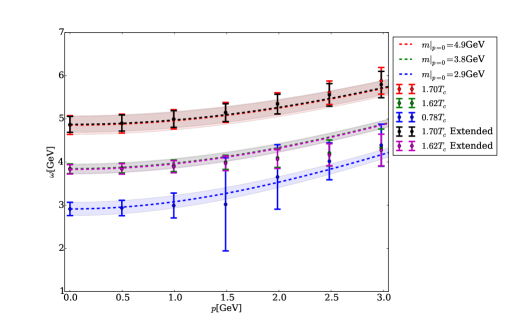
Figure 2 shows the result of dispersion relation determined by eq. (8) with the conventional and extended analyses. We have checked that the result hardly changes with the variations of and . From the figure, one sees that the peak position at moves to larger as increases. This result suggests that the rest mass of becomes heavier for higher . Because of the Lorentz symmetry, the dispersion relation in the vacuum takes the form,
| (9) |
where is the mass. The figure shows that the dispersion relation for is consistent with this behavior. In medium, on the other hand, there is no reason that the dispersion relation is given by eq. (9). Figure 2, however, shows that the dispersion relation traces eq. (9) well even at within the error, which is a highly nontrivial result.
We performed the above analysis both in the the conventional and extended methods. Both results are presented in fig. 2 for and . The result shows that the improvement for each error is not large for these analyses. When the correlations between the values at different momenta are in question, the benefit of the extended analysis will become prominent.
6 Discussions and conclusion
In this study, we analyzed the charmonium spectral function in the pseudoscalar channel at nonzero momentum and dispersion relations of in an extended MEM analysis which utilizes the correlation between correlators with different momenta. A method to define the peak position in a spectral function with the error for it in MEM is proposed. We found that the dispersion relation of the charmonium still follows the Lorentz invariant form above until its dissociation. We point out that this result is not trivial at all.
Analyzing the correlators in the extended method, we found that our method reduces the error of reconstructed images with MEM. However, this reduction is limited. There is several possible reasons for this. First, when we adopt the extended covariance matrix to define , the fitting error does not necessarily reduce. This does not mean that this analysis is wrong. Second, when we extend the correlator space, we need more configurations to get a reliable covariance matrix.
In this work, we analyzed only two correlators with two different momenta together. However, we can use more than three correlators not only with different momenta but also in ccdifferent channels, for example, pseudoscalar and vector channels, vector channel with transverse and longitudinal components, and so forth.
Acknowledgments
This work was supported in part by JSPS KAKENHI Grant Numbers 23540307, 25800148, and 26400272. The numerical calculations have been performed on the PACS-CS computer at University of Tsukuba, Blue Gene at KEK and at KMI at Nagoya University.
References
- [1] M. Asakawa and T. Hatsuda, Phys. Rev. Lett. 92 (2004) 012001, hep-lat/0308034.
- [2] S. Datta et al., Phys. Rev. D 69 (2004) 094507, hep-lat/0312037.
- [3] F. Karsch et al., Physics Letters B 530 (2002) 147, hep-lat/0110208.
- [4] H.T. Ding et al., Phys. Rev. D 83 (2011) 034504.
- [5] F. Karsch and H.W. Wyld, Phys. Rev. D 35 (1987) 2518.
- [6] M. Jarrell and J.E. Gubernatis, Physics Reports 269 (1996) 133.
- [7] M. Asakawa, Y. Nakahara and T. Hatsuda, Progress in Particle and Nuclear Physics 46 (2001) 459, hep-lat/0011040.
- [8] E.T. Jaynes, Phys. Rev. 106 (1957) 620.
- [9] G. Aarts et al., Phys. Rev. D 76 (2007) 094513, 0705.2198.
- [10] H.T. Ding et al., Phys. Rev. D 86 (2012) 014509, 1204.4945.
- [11] H.T. Ding, Nuclear Physics A 904-905 (2013) 619c, 1210.5442.
- [12] R. Bryan, European Biophysics Journal 18 (1990) 165.
- [13] C. Nonaka et al., J. Phys. G: Nucl. Part. Phys. 38 (2011) 124109.