Enhanced Second Harmonic Generation from Coupled Asymmetric Plasmonic Metal Nanostructures
Abstract
We experimentally demonstrate that two coupled metal nanostructures (MNSs), a silver nanowire and bipyramid, can produce 30 times enhanced second harmonic generation compared to the particles alone. We develop a simple theoretical model presenting the path interference effects in the nonlinear response of coupled MNSs. We show that the reason for such an enhancement can be the occurrence of a Fano resonance due to the coupling of the converter MNS to the long-lived mode of the attached MNS.
I Introduction
Typically, nonlinear optical effects appear at very high intensities, that is, nonlinear optical properties of material surfaces can only be revealed by pulsed lasers. In recent studies luk2010fano ; Turkpence14 ; Salakhutdinov14 , material surfaces or interfaces decorated with metal nanostructures are suggested to act as nonlinear conversion agents since they enhance the local field amplitudes by several orders of magnitude. This property is expected to enable these efficient nonlinear converters to be utilized in many application areas, such as solar energy, molecular switching, photocatalysis, imaging, etc.
Metal nanostructures (MNSs) exhibit absorption resonances at the optical frequencies. Such excitations may create hot-spots on the surfaces of MNSs. When a quantum dot (QD) is placed in the vicinity of these hot-spots, localized surface plasmons (LSPs) interact strongly with the attached QD. Presence of the QD introduces two absorption paths both lying in the plasmon spectral width Alzar02 , hence making them unresolvable. The two paths operate out of phase –one absorbing while the second emitting– and result a dip in the absorption spectrum, where an absorption peak would be observed instead. Such transparencies in the plasmonic response are referred as Fano resonances Miroshnichenko10 . These are responsible for increased fluorescence of molecules Ayala-Orozco14 and increased lifetime of plasmonic oscillations Tasgin13 which makes coherent plasmon emission possible Noginov09 ; Stockman11 . Quantum coherence effects can be used to increase the sensitivity of ultrafast response nanolasers Voronine14 and can enhance the amplification Dorfman13 ; Voronine15 .
Plasmon oscillations in MNSs concentrate the incident light to nm dimensions which yield strong enhancement in the field intensities Stockman11 . The enhancement in the intensity leads to the appearance of optical nonlinearities Zayats12 such as as enhanced Raman scattering Sharma12 , four wave mixing Genevet10 ; Renger11 , two photon absorption Cox13 ; Anton13 ; Racknor14 , and second harmonic generation (SHG) Thyagarajan13 ; Berthelot12 ; Wunderlich13 ; Gao11 ; Singh13 ; Walsh13 . Fano resonances with attached quantum objects can be utilized to enhance Thyagarajan13 and suppress Turkpence14 SHG process in plasmonic particles. The underlying mechanism relies on the cancellation of nonresonant frequency terms degrading the frequency conversion by hybridized paths Turkpence14 .
Fano-like resonances can also take place in two coupled classical oscillators Alzar02 ; Tassin12 , without quantum nature. It is also experimentally demonstrated that coupling with dark modes (which have longer lifetimes) panaro2014dark ; Artar11 ; Cetin11 can result in Fano resonances.
In this paper, we investigate the second harmonic (SH) signal from coupled silver nanowire (AgNW) and silver bipyramid nanoparticle (AgNP). We observe that SH signal from the coupled system is highly enhanced compared to MNSs alone. We introduce a very simple theoretical model and show that such a factor of enhancement can be obtained via Fano resonances in the nonlinear response. We show that coupling the converter (AgNW) to the long-lived (10 times), e.g. dark panaro2014dark , mode of an AgNP can enhance the SH signal in the similar amounts observed in our experiment. Interacting systems of MNSs are experimentally more controllable Alzar02 ; Berthelot12 ; Tassin12 ; Artar11 ; Cetin11 compared to Fano resonances intorduced in coupled plasmon-quantum emitter systems Tasgin13 ; clark2000second . By the use of carefully designed MNSs enhanced nonlinear conversion of light can be achieved.
We construct a coupled MNS system composed of an AgNP of 100 nm size and an AgNW of 60 nm diameter and several m length on a dielectric (glass) surface. When a 1064 nm near-infrared (NIR) excitation laser is focused solely on an isolated AgNW, a weak 532 nm SHG signal is generated. On the contrary, when the coupled system is excited in the vicinity of the coupling region, the observed SH signal increases up to 30 fold. We have demonstrated this enhancement by performing an in situ experiment in which, as the focus is moved along the AgNW axis, it is found that the generated SH signal increases by a factor of 30 when the focus passes through the AgNP coupled region. The SHG level at AgNW body a few m away from the AgNP is at the same level as that of an isolated AgNW. The SH signal from a bare AgNP is found to be only 1/6 of the isolated AgNW. The observed enhancement can be obtained in our model by coupling the converter with a MNS which has a 10 times longer plasmon lifetime, see Fig. 2.
II Theoretical model
In this section, we develop a theoretical model describing the second harmonic response of a system of two coupled plasmonic oscillators. We introduce the effective Hamiltonian for the system and derive the equations of motion for the plasmon polariton mode fields. We numerically time evolve the equations to obtain the steady state occupations of the plasmon modes and show that second harmonic conversion generation can be either enhanced or suppressed by choosing an appropriate MNS supporting a particular frequency mode.
We treat the MNSs as if they do not have a spatial extent, i.e. they are point particles. In the physical situation, however, the particles must have sizes and hence there must be retardation effects. In ref. Turkpence14 , coupling of a MNS and a quantum emitter object is treated with the same theoretical model. It is shown that the simple model can well predict the amount and the spectral position of the SHG enhancement by comparing the results with the simulations performed by using MNPBEM Toolbox in MATLAB Hohenester12 . The simulations take the retardation effects into account, the physical objects are simulated with their true geometries.
II.1 The model system
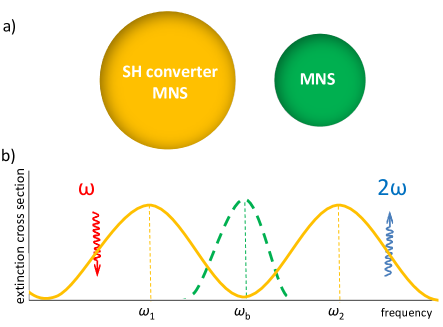
We consider two MNSs which support plasmonic excitations at optical wavelengths. The MNSs interact with each other due to induced charge oscillations. The first MNS supports two plasmon modes of resonances and in the relevant frequency regime, see Fig. 1b solid yellow curve. Shape of the second MNS is chosen so that it has a single plasmonic response peaked at , see Fig. 1b dashed green curve, near the mode of the converter MNS.
The converter MNS has a non-centrosymmetric shape (the spherical shape in Fig. 1a is for demonstrative purposes) which enables the SH process. In the model, we consider only the two plasmon modes in which the converter is driven () by the strong laser () and the mode () into which the conversion process () takes place. In general, however, the converter MNS may support many plasmon modes in between and modes or out of the region covered by the two modes. We neglect the coupling of and excitations to other modes for the sake of obtaining a simple model. We aim a basic physical picture. The mode of the converter is coupled to the mode of the second MNS. Only for being able to track the leak of the oscillations from mode to other modes in the converter MNS, we also take the coupling of with mode into account.
II.2 Hamiltonian
Dynamics of the system is as follows. The incident strong driving field, , is coupled to the mode of the converter and induces plasmon oscillations with frequency . The plasmon field () produced by the localized surface plasmon excitation yields to a strong electromagnetic field in the plasmonic converter. This localized strong field enables multiphoton (plasmon) processes come into play. The field oscillating at frequency , trapped in the plasmon polarization field, gives rise to the second harmonic polarization oscillations at in the mode. Two plasmons in the mode combines finazzi2012plasmon and generates a plasmon in the mode. It is experimentally demonstrated grosse2012nonlinear that SHG process takes place in a plasmonic materials through plasmons. Conversion is carried through such a mechanism since the overlap integral of the process, , highly increases due to the localization of both plasmon modes ginzburg2012nonlinearly . The mode of the second MNS interacts with both and modes. The interaction strengths can be tuned either by varying or by changing the position or shape of the second MNS (i.e. changing the overlap integral).
The total Hamiltonian can be written as the sum of the energies of the plasmons in the first () and the second () MNSs, the interaction between the MNSs (), the energy supplied by the incident field (), and the term governing the second harmonic generation process (),
| (1) |
where
| (2) | |||
| (3) | |||
| (4) | |||
| (5) | |||
| (6) |
and are the annihilation operators for the collective plasmon excitations in the first MNS, corresponding to the modes with resonance frequencies and respectively. Similarly, is the annihilation operator for mode of the second MNS. (, and will represent the amplitudes of the related plasmon oscillations.) () is the coupling matrix element between the field induced by () mode of the SH converter (first MNS) and the mode of the second MNS. Eq. (5) describes the energy contribution of the incident field which drives PP mode. In Eq. (6), two low energetic plasmons in the mode oscillating at , combine to generate a second harmonic plasmon in the mode, oscillating at . The parameter , in units of frequency, is proportional to the second harmonic susceptibility of the oscillator.
We use Heisenberg equation of motion, for any operator , to derive the time evolution of the plasmon amplitudes. After obtaining the quantum dynamics of each mode, since we are not interested in the entanglement features but only in intensities, we substitute the quantum operators , , and with their expectation values, , , and . We plug in the damping rates for the PP fields, namely , , and respectively. Consequently we obtain the following equations for the plasmon amplitudes.
| (7) |
| (8) |
| (9) |
In the steady state, the oscillation modes can only support the driving frequency () and the SH generated frequency () of the form
| (10) | |||
| (11) | |||
| (12) |
Amplitudes , and are the amplitudes of linear plasmon oscillations (), and , and are the amplitudes of the second harmonic () plasmon oscillations.
We numerically time evolve equations (7,8,9) and then obtain the time behaviour after steady state has been reached. Using the Fourier transform technique we determine the steady state amplitudes, , and , the amplitudes of second harmonic oscillations. The number of SH plasmons can be determined by summing over the plasmons generated in all three modes as
| (13) |
We note that oscillations in and modes are not generated in these modes. They are rather transferred from mode due to interactions.
II.3 Tuning the second harmonic conversion
We are interested in the enhancement and suppression of the SHG from the first MNS, in the presence of alternative absorption/emission pats due to the coupling with the second MNS. We compare the number of plasmons generated in the presence of coupling (), , to the number of plasmons in the absence of coupling (), . Thus, we define the enhancement factor as the ratio of to .
| (14) |
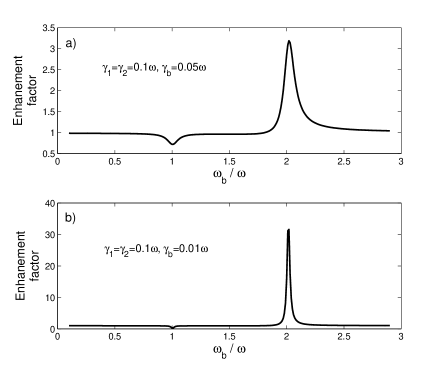
In order to identify the spectral positions of the nonlinear Fano resonances, we calculate the SHG enhancement factor for different resonance frequencies, , of the second MNS. In our simulations, we fix the parameters , , , and . In Fig.s 2a and 2b, we set the decay rate of the second MNS as and , respectively.
Fig. 2a, where , shows that in the case of two coupled MNS, SHG can be enhanced more than three times as compared to the case of the first MNS alone. Maximum enhancement is obtained when the resonance of the second MNS is tuned to . On the contrary, SHG can be suppressed to 0.72 when is tuned to . Fig. 2b shows that when a second MNS with smaller damping () is used, a smaller suppression but much larger and enhancement can be obtained. At (), enhancement (suppression) factor of 32 (0.31) is found.
Emergence of enhencement at about can be understood using the arguments given in ref. Turkpence14 . The off-frequency term, that is , is cancelled by an auxiliary term which emerges due to the path interference effects (see the discussion below Eq. (9)in ref. Turkpence14 ). Suppression at take place since the linear path interference does not allow the excitation at the driving frequency . When the linear response is suppressed, smaller () plasmon intensities result in less SH conversion.
In the following section, we report the results of an experiment on a silver nanowire-silver nanoparticle system locally illuminated with a Gaussian beam source.
III Experiment
In this section we explain the details of the experimental study on a similar system to the one studied within the theoretical model, a system of two coupled plasmonic oscillators; a silver nanowire and a silver nanoparticle.
III.1 Colloidal solution preparation procedure
Silver nanowires are synthesized by self-seeding polyol process. In this technique, an inorganic salt is reduced by a polyol and agglomeration of particles is prevented by addition of surfactant which is commonly polyvinylpyrrolidone (PVP). Required chemicals are bought from Sigma-Aldrich. 7 mg of NaCl is added into 10 mL of 0.45 M ethylene glycol (EG) solution of PVP and heated at . By using injection pump, solution of 0.12 M AgNO3 in 5 mL of EG is added drop-wise at a rate of 5 mL/h. During this process, solution is stirred at 1000 rpm rate by magnetic stirrer. After the drop-wise EG addition process, solution is heated up at for 30 minutes and is cooled to room temperature. To enable the removal of polymer from the solution, the diluted solution with acetone is centrifuged two times for 20 minutes at 6000 rpm. Afterwards, wires are dispersed in ethanol and centrifuged again under the same conditions. At the end of this procedure, nanowires with 60 nm diameter and length of 8 to 10 m are obtained.
Solution containing bipyramids of metallic silver is synthesized with polymer-mediated polyol process as well. 94 mM AgNO3 is added to 3 mL EG solution. Another 3 mL of EG solution containing 0.11 mM NaBr and 144 mM PVP is prepared and two solutions are added dropwise into heated EG solution of 5 mL in an oil bath at 160 which contains 30 L of 10 mM NaBr. After 5 hours, bipyramid solution with an average size of 150 nm is obtained Coskun11 ; Wiley06 . The synthesis procedure leaves the AgNWs and AgNPs with a polymer coating of about 3-4 nm thickness.
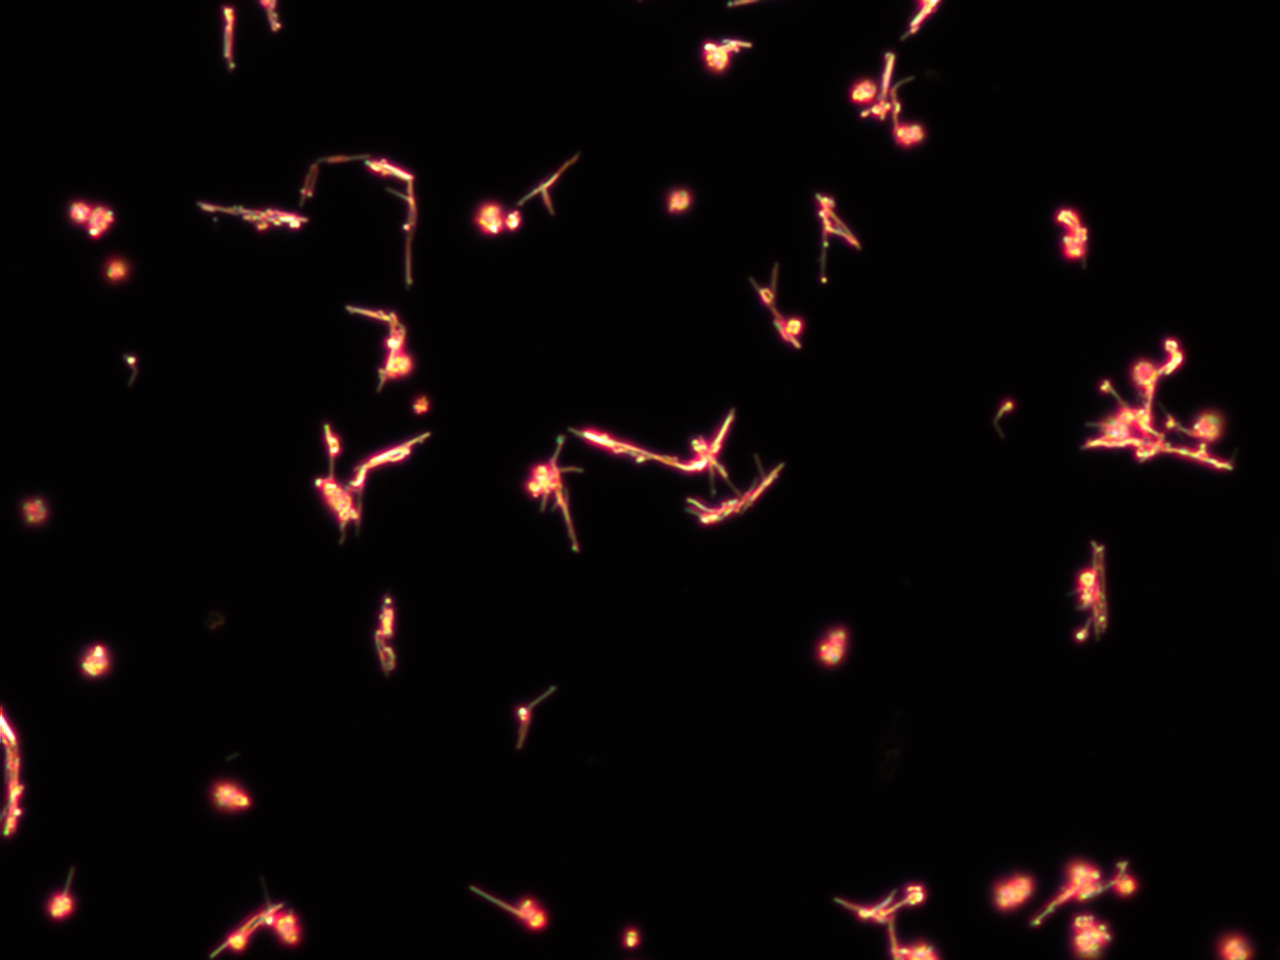
The resulting AgNPs are co-deposited on the same substrates of AgNWs to obtain a network of NW-NP complexes, which are ultimately asymmetric structures and cover a macroscopically large area. Such coated surfaces are first imaged by dark-field microscopy to ensure the existence of the complexes (Fig. 3). The AgNPs are observed to display different colors such as green and blue under white light illumination as a result of their size dependent plasmon resonance in the visible range. The AgNWs are observed to show a reddish glimmer as a result of shift of their plasmon resonance towards NIR due to high aspect ratio of their geometry. A combination of such two Ag nanostructures is what we expect to boost the SHG due to conversion of NIR plasmons to visible plasmons upon interaction of NWs with NPs.
III.2 Optical measurements
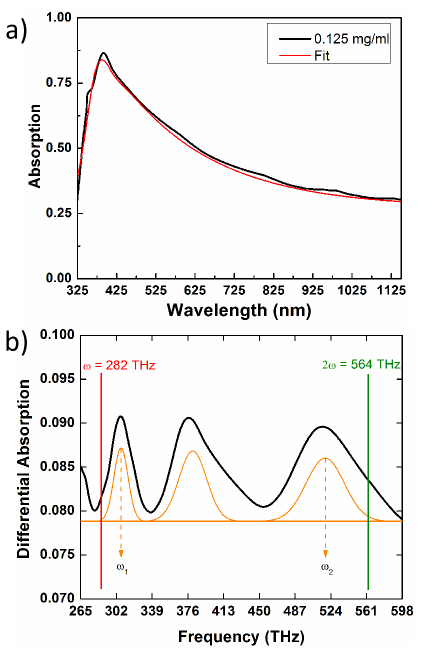
In Fig. 5, we show that the AgNWs do possess a manifold of plasmon resonances comparable to the sketched model in Fig. 1. The data shows differential absorption (Fig. 5b) which is calculated from the original absorption spectrum measurement (Fig. 5a) performed on a liquid dispersion of AgNWs at 0.125 mg/ml concentration. The dominant plasmon resonance kottmann2001plasmon ; zhu2011high centered at 390 nm (769 THz) is subtracted from the measured data by performing a peak fit. The residual differential absorption curve (in black) is displayed in THz units to allow for direct comparison to Fig 1. In Fig. 5 we also show three Gaussian peaks out of which two of them are much like the , (orange solid) plasmon bands in the model.
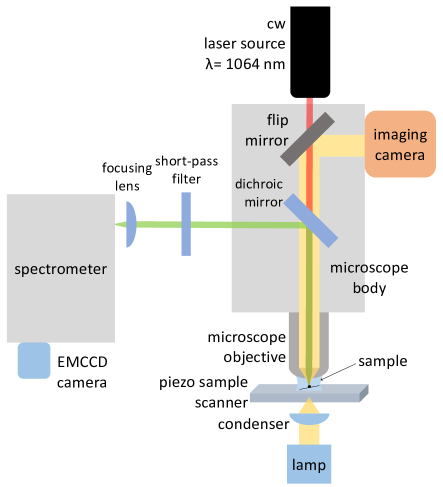
We used an inverted microscope (Zeiss model Axiovert 200) with a 63X (1.4 NA) objective lens for our experiments. In Fig. 4, a scheme of experimental setup is displayed. We used a cw Nd:YAG laser (Cobolt model Rumba) with wavelength of nm and 500 mW output power as excitation source. The NIR signal was delivered from the back port of microscope, resulting in an intensity of 40 MW/cm2 on the sample. Resulting SHG from the AgNW-AgNP cluster was registered by a spectrometer (Andor models Shamrock 750 spectrograph + Newton 971 EMCCD) in corporation with a long-pass dichroic mirror cutting off the backscattered 1064 nm signal and reflecting a band of 520-750 nm.
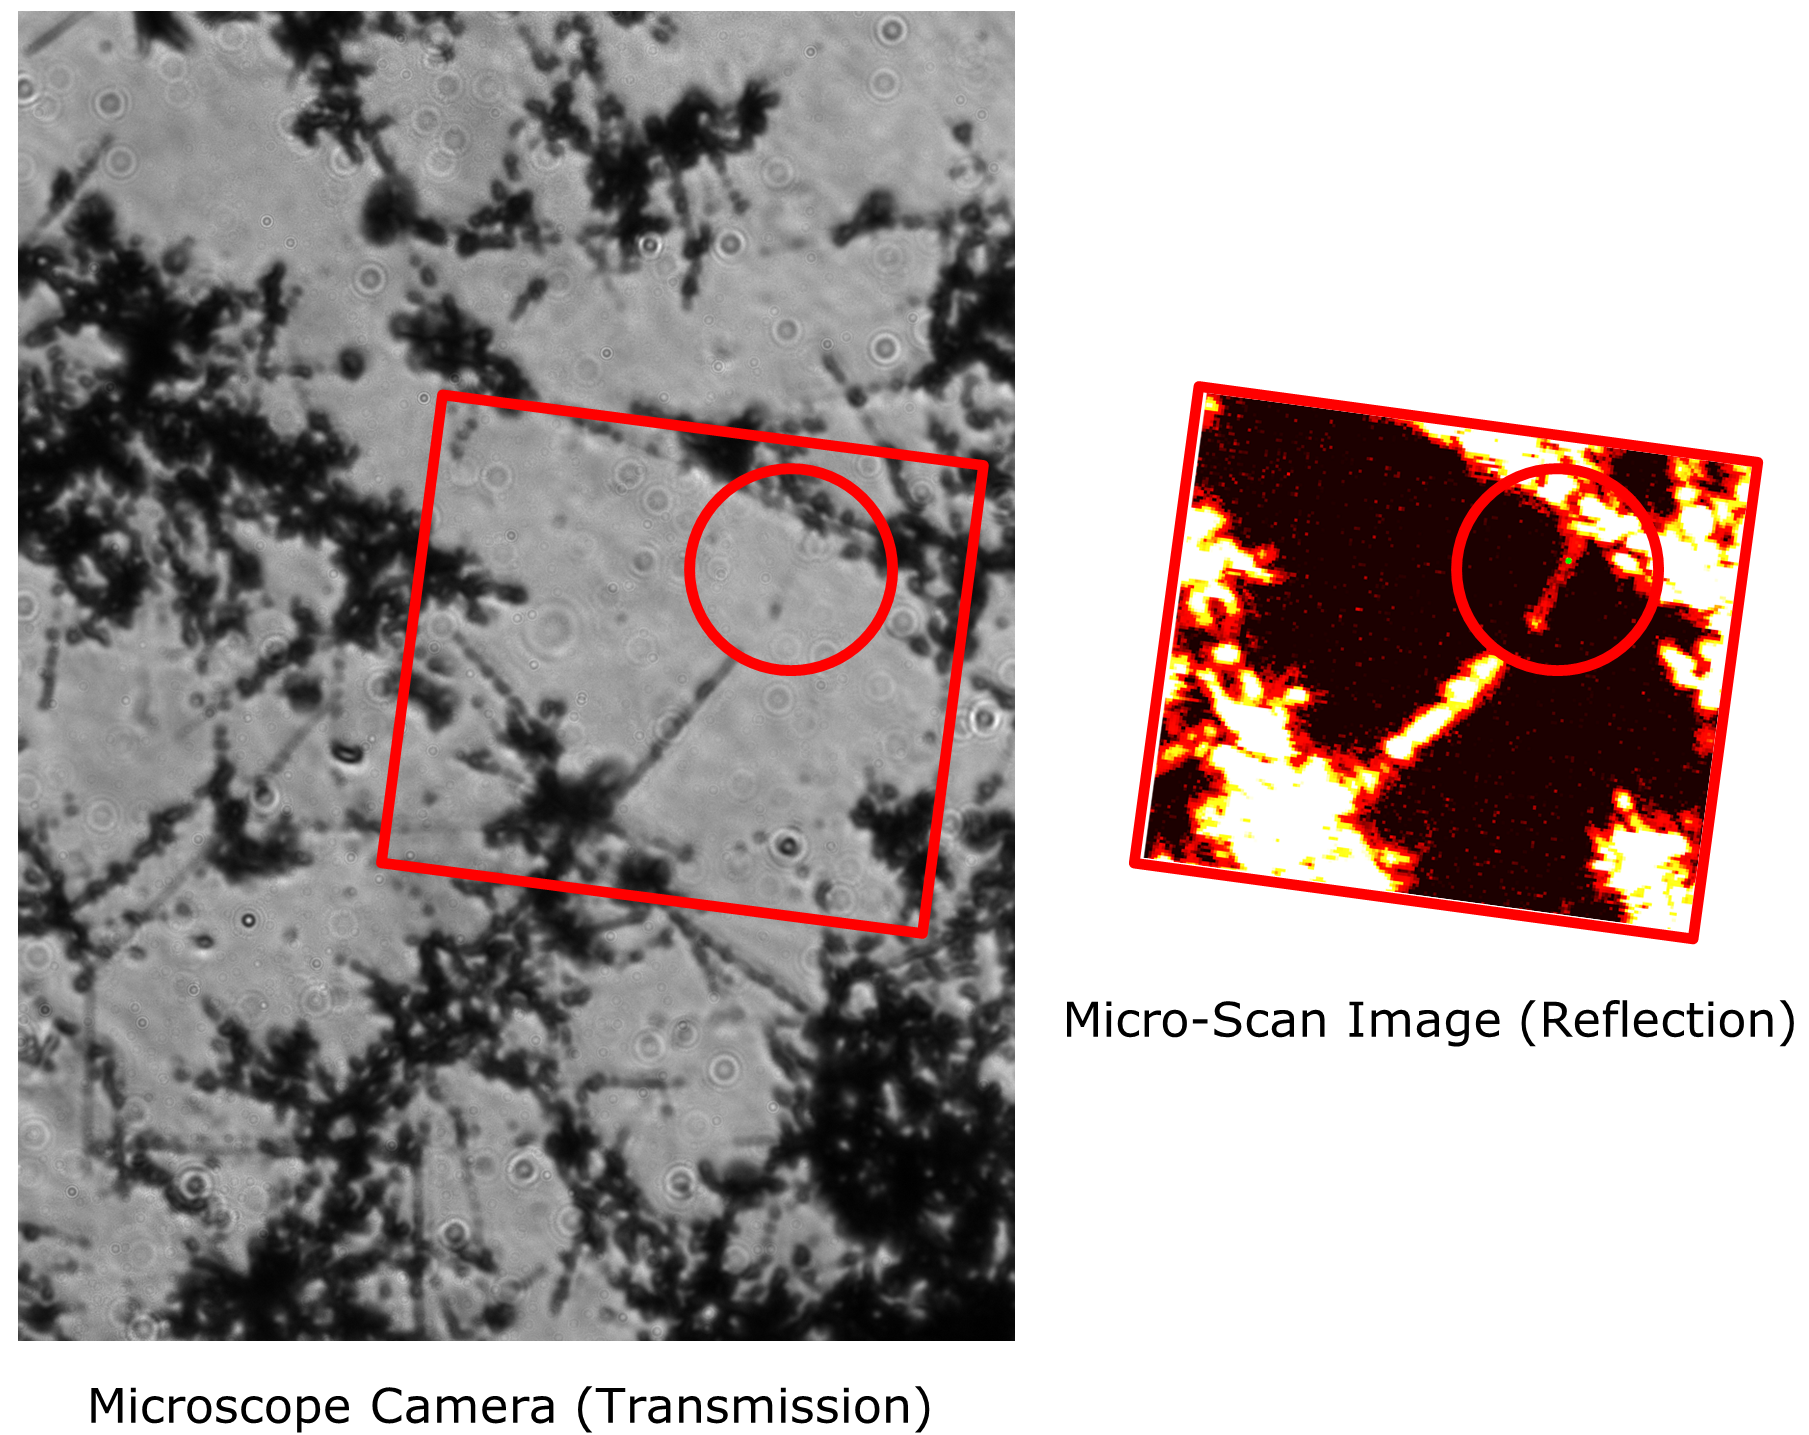
We first record a transmission image by the visual inspection camera that works in the visible, see Fig. 6. The dark figures in the image indicate the location of AgNWs, AgNPs and their clusters with a very poor resolution. Nevertheless this image is sufficient to locate a candidate region that bears a single AgNW-AgNP complex for further detailed study. The red circle on the transmission image on the left points a region of possible interest with one NW and NP complex. The red rectangle indicates the region which is scanned at a high resolution by the piezo-stage. The reflection image produced by the scanning of the same region is given on the right using a 1064 nm NIR laser. The reflection image produced at the illumination wavelength shows intense reflection from crowded clusters as well as a single straight feature which is the isolated part of a single AgNW and an AgNP attached towards the end of the AgNW. The faint straight shadow on the left image and a dark spot at its end appear as a straight bright feature on the left with a brighter spot at its end that indicates the attached AgNP.
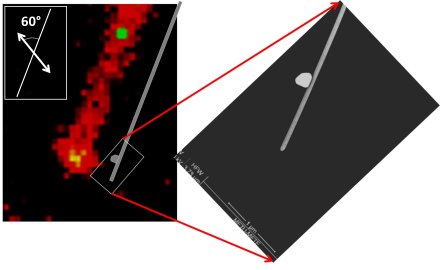
Such AgNW-AgNP complexes are often encountered upon inspection of these samples with scanning electron microscope. Fig. 7 shows a zoomed version of the encircled straight part of the micro-scan image along with a representative sketch of the AgNW-AgNP complex drawn to scale. An SEM image is provided on the right that shows a highly magnified image of the end of AgNW with the attached AgNP along its body. The AgNW is typically of 50-60 nm in diameter and can be as long as 5-10 m. The AgNPs are typically of 50-150 nm size.
III.3 Experimental results
By the help of the micro-scan image, we can direct our focal spot at any pixel of choice and acquire SHG spectra using a spectrometer EMCCD combination. While moving the diffraction limited illumination spot stepwise along the axis of the AgNW, a SHG spectrum is acquired at each step and the acquired spectra are plotted (Fig. 8a inset). These spectra are acquired for 60 s and integrated over SHG band. The integral SHG signal is plotted against the distance along the AgNW axis (Fig. 8a). The excitation polarization is linear and is in the plane of the sample surface. The white arrow in the left inset in Fig. 7 shows the polarization direction which is 60o to this particular AgNW that we studied.
There are 3 major results that we obtain. (i) When the illumination spot is not located on the AgNW, no SHG signal is registered. So the SHG originates genuinely from the plasmonic structure. (ii) We observe SHG even with cw illumination (50 mW on the sample) from AgNW plasmonic structures. (iii) The SHG signal is enhanced by a factor of about 30 when the illumination spot is on the AgNP-AgNW complex with respect to the body of the AgNW alone.
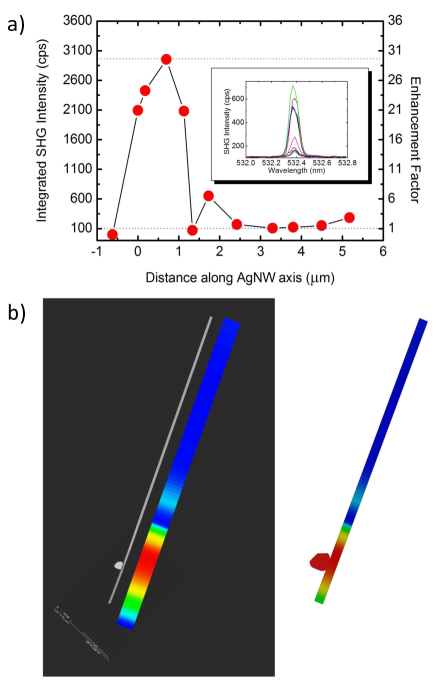
A better visual represantation of the SHG intensity distribution as a function of position along the AgNW axis is given in Fig. 8b. A color bar is produced from the integral SHG signal and displayed in parallel with the actual SEM image and its representative straight extension. The SHG signal clearly appears starting from the end of the AgNW and reaches its maximum around where the AgNP is attached to the AgNW. An overlap of the color bar with a represantation of such an AgNW-AgNP plasmonic hybrid complex on the right clearly depicts the observed effect: An enhanced SH conversion spot is constructed by the hybridization of the AgNW and AgNP plasmons.
IV Discussion and conclusions
In this paper we study the tunability of SHG from a coupled system of metal nano particle and a nanowire. Our experiments show that SHG from nanoparticles or nanowires can be enhanced about 30 times as compared to the uncoupled ones, because of path interference effects. We also introduce a single theoretical model and demonstrate the origin of the enhancement in our experiment.
Silver nanoparticle and nanowire samples are illuminated with continuous wave NIR laser source of 1064 nm wavelength at different focal points with a focal spot size 1 m diameter. First, AgNW and AgNP samples of typical sizes 5 m and 100 nm respectively, are illuminated separately and SH response is recorded. Second, the two MNSs are combined and a representative coupled MNS is identified. The focus of NIR laser is moved stepwise along the axis and the SH response at 532 nm wavelength is recorded at each step (Fig. 8). It is observed that when the laser focus is in the region containing the coupled AgNP, the SH signal is enhanced up to 30 times as compared to the AgNP-free regions on the AgNW axis.
Our experimental results can be interpreted by the help of the developed theoretical model examining the effects of coupling of a MNS with a SH converter MNS. We show that the enhancement factor (30) observed in the experiment can be obtained by attaching a higher quality MNS to the SH converter MNS. The attached MNS has a distorted bipyramidal shape and can support dark modes panaro2014dark with relatively longer lifetimes than that of bright modes. Therefore in our experiment AgNW plays the role of SH converter and bipyramid AgNP is the coupled higher quality plasmonic oscillator. This is also confirmed by control experiments performed on AgNW and AgNP samples separately, where the former is found to generate 6 times higher SH conversion. It can be noted that the AgNP size effect is incorporated to our model through the and parameters in Eqn. 4. AgNPs with different sizes are expected to have different positions which result in different levels of overlaps between and and hence different magnitude of and , respectively. The magnitudes of these parameters play an important role in the SHG enhancement.
Alzar et. al. show that absorption cancellations due to Fano resonances can be achieved in entirely classical systems Alzar02 , which are observed in our and recent experiments Renger11 ; Thyagarajan13 ; Berthelot12 ; Wunderlich13 ; luk2010fano . We approach the problem with a simple model of two coupled oscillators which have different damping rates. We reveal the enhancement/suppression effects on the spectrum of the nonlinear conversion using simple arguments.
Acknowledgements
A.B. acknowledges support from TUBITAK Grants No. 113F239, 113M931, 113F375, 114E105 and METU grant No. BAP-01-05-2015-003. M.E.T. acknowledges support from TUBITAK Grants No. 112T927 and No. 114F170. We would like to thank Dr. Marco Lazzarino and Dr. Denys Naumenko from Laboratorio TASC, CNR-IOM for useful discussions and help with the experiments. We also thank Dr. Oguz Gulseren from Bilkent University, Ankara, Turkey for his support.
References
- (1) B. Luk’yanchuk, N. I. Zheludev, S. A. Maier, N. J. Halas, P. Nordlander, H. Giessen, C. T. Chong, The fano resonance in plasmonic nanostructures and metamaterials, Nature materials 9 (9) (2010) 707–715.
- (2) D. Turkpence, M. E. Tasgin, G. B. Akguc, A. Bek, Engineering nonlinear response of nanomaterials using fano resonances., Journal of Optics 16 (10) (2014) 105009 (10pp).
- (3) I. Salakhutdinov, D. Kendziora, M. K. Abak, D. Turkpence, L. Piantanida, L. Fruk, M. E. Tasgin, M. Lazzarino, A. Bek, Plasmonic non-linear conversion of continuous wave light by gold nanoparticle clusters with fluorescent protein loaded gaps. arXiv:1402.5244v2 (2014).
- (4) C. L. G. Alzar, M. A. G. Martinez, P. Nussenzveig, Classical analog of electromagnetically induced transparency., American Journal of Physics (1) (2002) 37.
- (5) A. E. Miroshnichenko, Y. S. Kivshar, S. Flach, Fano resonances in nanoscale structures., Reviews of Modern Physics 82 (3) (2010) 2257–2298.
- (6) C. Ayala-Orozco, J. G. Liu, M. W. Knight, Y. Wang, J. K. Day, P. Nordlander, N. J. Halas, Fluorescence enhancement of molecules inside a gold nanomatryoshka., Nano Letters 14 (5) (2014) 2926 – 2933.
- (7) M. E. Tasgin, Metal nanoparticle plasmons operating within a quantum lifetime., Nanoscale 5 (18) (2013) 8616 – 8624.
- (8) M. A. Noginov, G. Zhu, A. M. Belgrave, S. Stout, R. Bakker, V. M. Shalaev, E. E. Narimanov, E. Herz, T. Suteewong, U. Wiesner, Demonstration of a spaser-based nanolaser., Nature 460 (7259) (2009) 1110–1112.
- (9) M. I. Stockman, Nanoplasmonics: Past, present, and glimpse into future., Optics Express 19 (22) (2011) 22029–22106.
- (10) D. V. Voronine, W. Huo, M. Scully, Ultrafast dynamics of surface plasmon nanolasers with quantum coherence and external plasmonic feedback., Journal of Optics 16 (11) (2014) 114013.
- (11) K. E. Dorfman, P. K. Jha, D. V. Voronine, P. Genevet, F. Capasso, M. O. Scully, Quantum coherence enhanced surface plasmon amplification by stimulated emission of radiation., Phys. Rev. Lett. 111 (2013) 043601.
- (12) D. V. Voronine, A. M. Sinyukov, X. Hua, E. Munusamy, G. Ariunbold, A. V. Sokolov, M. O. Scully, Complex line shapes in surface enhanced coherent raman spectroscopy., Journal of Modern Optics 62 (2) (2015) 90–96.
- (13) M. Kauranen, A. V. Zayats, Nonlinear plasmonics., Nature Photonics 6 (11) (2012) 737 – 748.
- (14) B. Sharma, R. R. Frontiera, A.-I. Henry, E. Ringe, R. P. Van Duyne, Sers: Materials, applications, and the future., Materials Today 15 (1-2) (2012) 16.
- (15) P. Genevet, J. P. Tetienne, M. A. Blanchard, R.and Kats, F. Capasso, E. Gatzogiannis, M. O. Scully, Large enhancement of nonlinear optical phenomena by plasmonic nanocavity gratings., Nano Letters 10 (12) (2010) 4880–4883.
- (16) J. Renger, R. Quidant, L. Novotny, Enhanced nonlinear response from metal surfaces, Opt. Express 19 (3) (2011) 1777–1785.
- (17) J. D. Cox, M. R. Singh, C. von Bilderling, A. V. Bragas, A nonlinear switching mechanism in quantum dot and metallic nanoparticle hybrid systems, Advanced Optical Materials 1 (6) (2013) 460–467.
- (18) J. D. Cox, M. R. Singh, M. A. Anton, F. Carreno, Plasmonic control of nonlinear two-photon absorption in graphene nanocomposites, Journal of Physics: Condensed Matter 25 (38) (2013) 385302.
- (19) C. Racknor, M. R. Singh, Y. Zhang, D. J. S. Birch, Y. Chen, Energy transfer between a biological labelling dye and gold nanorods, Methods and Applications in Fluorescence 2 (1) (2014) 015002.
- (20) K. Thyagarajan, J. Butet, O. J. F. Martin, Augmenting second harmonic generation using fano resonances in plasmonic systems., Nano Letters 13 (4) (2013) 1847–1851.
- (21) J. Berthelot, M. Song, P. Rai, G. C. Des Francs, A. Dereux, A. Bouhelier, G. Bachelier, Silencing and enhancement of second-harmonic generation in optical gap antennas., Optics Express 20 (10) (2012) 10498–10508.
- (22) S. Wunderlich, U. Peschel, Plasmonic enhancement of second harmonic generation on metal coated nanoparticles., Optics Express 21 (16) (2013) 18611 – 18623.
- (23) S. Gao, K. Ueno, H. Misawa, Plasmonic antenna effects on photochemical reactions., Accounts of Chemical Research 44 (4) (2011) 251–260.
- (24) M. R. Singh, Enhancement of the second-harmonic generation in a quantum dot-metallic nanoparticle hybrid system., Nanotechnology 24 (12) (2013) 125701 – 125706.
- (25) G. F. Walsh, L. Dal Negro, Enhanced second harmonic generation by photonic-plasmonic fano-type coupling in nanoplasmonic arrays., Nano Letters 13 (7) (2013) 3111 (6pp).
- (26) P. Tassin, L. Zhang, R. Zhao, A. Jain, T. Koschny, C. M. Soukoulis, Electromagnetically induced transparency and absorption in metamaterials: The radiating two-oscillator model and its experimental confirmation., Physical Review Letters 109 (18) (2012) 187401.
- (27) S. Panaro, A. Nazir, C. Liberale, G. Das, H. Wang, F. De Angelis, R. Proietti Zaccaria, E. Di Fabrizio, A. Toma, Dark to bright mode conversion on dipolar nanoantennas: a symmetry-breaking approach, ACS Photonics 1 (4) (2014) 310–314.
- (28) A. Artar, A. A. Yanik, H. Altug, Multispectral plasmon induced transparency in coupled meta-atoms., Nano Letters 11 (4) (2011) 1685–1689.
- (29) A. E. Cetin, A. Artar, M. Turkmen, A. A. Yanik, H. Altug, Plasmon induced transparency in cascaded p-shaped metamaterials., Optics Express 19 (23) (2011) 22607–22618.
- (30) H. A. Clark, P. J. Campagnola, J. P. Wuskell, A. Lewis, L. M. Loew, Second harmonic generation properties of fluorescent polymer-encapsulated gold nanoparticles, Journal of the American Chemical Society 122 (41) (2000) 10234–10235.
- (31) U. Hohenester, A. Trugler, Mnpbem - a matlab toolbox for the simulation of plasmonic nanoparticles., Computer Physics Communications 183 (2) (2012) 370–381.
- (32) M. Finazzi, F. Ciccacci, Plasmon-photon interaction in metal nanoparticles: Second-quantization perturbative approach, Physical Review B 86 (3) (2012) 035428.
- (33) N. B. Grosse, J. Heckmann, U. Woggon, Nonlinear plasmon-photon interaction resolved by k-space spectroscopy, Physical review letters 108 (13) (2012) 136802.
- (34) P. Ginzburg, A. Krasavin, Y. Sonnefraud, A. Murphy, R. J. Pollard, S. A. Maier, A. V. Zayats, Nonlinearly coupled localized plasmon resonances: Resonant second-harmonic generation, Physical Review B 86 (8) (2012) 085422.
- (35) S. Coskun, B. Aksoy, H. E. Unalan, Polyol synthesis of silver nanowires: An extensive parametric study., Crystal Growth and Design 11 (11) (2011) 4963–4969.
- (36) B. J. Wiley, Y. Xiong, Y. Xia, Z. Y. Li, Y. Yin, Right bipyramids of silver: A new shape derived from single twinned seeds., Nano Letters 6 (4) (2006) 765–768.
- (37) J. P. Kottmann, O. J. Martin, D. R. Smith, S. Schultz, Plasmon resonances of silver nanowires with a nonregular cross section, Physical Review B 64 (23) (2001) 235402.
- (38) J.-J. Zhu, C.-X. Kan, J.-G. Wan, M. Han, G.-H. Wang, High-yield synthesis of uniform ag nanowires with high aspect ratios by introducing the long-chain pvp in an improved polyol process, Journal of Nanomaterials 2011 (2011) 40.