Exploring the potential X-ray counterpart of the puzzling TeV gamma-ray source HESS J1507622 with new Suzaku observations
Abstract
The unidentified VHE (E100 GeV) gamma-ray source HESS J1507622 seems to not fit into standard models for sources related to young supernova remnants, pulsar wind nebulae, or young stellar populations in general. This is due to its intrinsically extended, but yet compact morphology, coupled with a relative large offset (3.5∘) from the Galactic plane. Therefore, it has been suggested that this object may be the first representative of a new distinct class of extended off-plane gamma-ray sources. The distance to HESS J1507622 is the key parameter to constrain the source’s most important properties, such as age and energetics of the relativistic particle population.
In this article we report on results of follow-up observations of the potential X-ray counterpart with Suzaku. We present detailed measurements of its spectral parameters and find a high absorbing hydrogen column density, compatible with the total amount of Galactic gas in this direction. In comparisons to measurements and models of the Galactic three-dimensional gas distribution we show that the potential X-ray counterpart of HESS J1507622 may be located at the far end of the Galaxy. If the gamma-ray source is indeed physically connected to this extended X-ray source, this in turn would place the object outside of the usual distribution of Galactic VHE gamma-ray emitters.
keywords:
cosmic rays - supernova remnants - neutron stars - gamma-rays: ISM - X-rays: ISM1 Introduction
Multi-wavelength (MWL) observations are powerful tools to investigate the nature of unidentified very-high-energy (VHE, E100 GeV) gamma-ray sources detected by ground-based imaging atmospheric Cherenkov telescopes such as H.E.S.S., VERITAS or MAGIC (for a review, see e.g. Hinton & Hofmann, 2009). In particular, non-thermal X-ray sources are excellent observational tracers for highly energetic particles, and are in many cases linked to VHE gamma-ray sources. Prominent examples of such cases are the supernova remnants (SNRs) Tycho (Decourchelle et al., 2001) and RX J1713.73946 (Cassam-Chenaï et al., 2004) as well as pulsar wind nebulae (PWNe, for a review, see Gaensler & Slane, 2006), such as MSH 15-52 (Trussoni et al., 1996). Two well-known Galactic VHE gamma-ray sources related to strong X-ray emitters are the PWNe HESS J1825137 (Aharonian et al., 2005, 2006a) and Vela X (Aharonian et al., 2006b).
One, typically unknown, key quantity of unidentified gamma-ray sources is their distance. For Galactic sources, observations of their X-ray counterpart may help to constrain their location in the Galaxy. Soft X-rays are absorbed by atomic and molecular interstellar gas along the line of sight, and from the level of this attenuation the total column density (CD) of traversed gas (predominantly hydrogen) can be estimated (see e.g. Wilms et al., 2000). If the distribution of atomic and molecular hydrogen in the Galaxy is known (e.g. Dickey & Lockman, 1990; Ferrière, 2001; Kalberla et al., 2005), constraints on the distance of the source can be placed, based on X-ray spectral measurements.
In the case where the level of soft X-ray attenuation is comparable to the total Galactic neutral hydrogen CD in this direction, the source is likely located at the far end or even outside of the Galaxy. This was the case for the VHE gamma-ray source HESS J1943213, where the highly absorbed X-ray counterpart pointed towards an Extragalactic origin (Abramowski et al., 2011). For sources with a significant angular offset from the Galactic plane, this method can also be used to constrain their physical distance from the disk.
In observations performed by the H.E.S.S. array of imaging atmospheric Cherenkov telescopes an extended VHE gamma-ray source with an angular off-set of 3.5∘ from the Galactic plane was discovered (HESS J1507622; Acero et al., 2011). This source features the second largest angular offset (next to the nearby SNR SN 1006) from the Galactic plane among all VHE gamma-ray sources that or not clearly linked to known Extragalactic objects. Despite detailed MWL analyses and theoretical considerations, the nature of this source has not been clearly identified yet. Interestingly, a faint, diffuse X-ray counterpart is likely connected to HESS J1507622 (see sect. 2). The current literature favors a PWN interpretation for this object where the X-ray and VHE gamma-ray emission is produced by ultra-relativistic electrons through synchrotron and inverse-Compton radiation, respectively (see sect. 4). However, the distance to HESS J1507622, and its potentially associated X-ray nebula, is still unknown, but constitutes a key component for all attempts to model the evolution of the source as well as the radiation mechanisms.
In this article we present detailed spectroscopic results for this X-ray counterpart, based on newly available Suzaku observations, which can provide a direct estimate of the total CD of hydrogen () in the line of sight towards this source and thus of its distance.
2 Previous X-ray observations with XMM-Newton and Chandra
Following up on its original detection by H.E.S.S., the region around HESS J1507622 has been observed once with Chandra (Acero et al., 2011) and twice with XMM-Newton (Tibolla et al., 2014).
In the 20 ks Chandra observation (ObsID: 9975) several point-like sources were detected but classified to be most likely unrelated to HESS J1507622. This Chandra observation also revealed two extended sources. One of them (CXOU J150850.6621018) is rather bright, with a flux of (2-10 keV) = erg cm-2 s-1, but outside of the intrinsic VHE gamma-ray size of HESS J1507622 (Acero et al., 2011). As briefly outlined by Tibolla et al. (2014), assuming the X-ray source CXOU J150850.6621018 and the VHE gamma-ray source HESS J1507622 are physically related, the lack of overlap between the two would be hard to explain, even in an aged PWN scenario. For such an object, despite a much more extended IC/TeV nebula compared to the synchrotron/X-ray nebula, one still would expect IC emission from freshly injected electrons to overlap with the X-ray nebula, which is not seen when comparing CXOU J150850.6621018 and HESS J1507622. Prime examples for such aged PWN scenarios are HESS J1825137 (Aharonian et al., 2005) and HESS J1303631 (Aharonian et al., 2005), where the TeV sources are much more extended but still partly overlap with the more compact X-ray nebulae (see Uchiyama et al. (2009) and Abramowski et al. (2012), respectively). A link between HESS J1507622 and the offset X-ray source CXOU J150850.6621018 might thus require an even more evolved, relic PWN scenario.
The second extended X-ray source (CXOU J150706.0621443) was detected with a statistical significance of 7 by Chandra and is spatially consistent with the VHE gamma-ray emission region. This source is rather faint, with a flux of (2-10 keV) = erg cm-2 s-1, estimated from the Chandra count rate (Acero et al., 2011). Given the low flux, the limited statistics from the 20 ks Chandra observation did not allow for a detailed spectral study of CXOU J150706.0621443. The extensions of the sources were estimated to be 20-25′′ for CXOU J150706.0621443 and 35-40′′ for CXOU J150850.6621018, respectively (Acero et al., 2011). Due to its positional coincidence and extended nature CXOU J150706.0621443 was suggested as a potential counterpart to HESS J1507622 (see Acero et al., 2011). To account for the very low X-ray flux compared to the flux in TeV gamma-rays, these authors suggested a relic PWN scenario with a very low magnetic field of 0.5. Such a low magnetic field leads to a very faint X-ray nebula along with a large accumulation of highly energetic electrons radiating predominantly TeV gamma-rays via the IC mechanism.
Unfortunately, both observations performed with XMM-Newton (ObsIDs: 0556310201, 0651620101) suffered from long periods of strong background flaring activity, rendering a significant fraction of the exposure time unusable for scientific analyses (see Acero et al., 2011; Tibolla et al., 2014). Even the remaining observation time of 10 ks featured an increased background level which affected the overall sensitivity, particularly for extended sources. However, both of the above mentioned extended Chandra sources were also detected in the second XMM-Newton observation (Tibolla et al., 2014). CXOU J150706.0621443, the fainter of the two, was barely above the detection threshold with a statistical significance of 4 . Again, due to the limited number of counts no detailed spectral analysis was possible for CXOU J150706.0621443. An additional source (XMMU J150835.7621021; Tibolla et al., 2014), in close proximity (112′′) to CXOU J150850.6621018, was detected in the second XMM-Newton observation but not seen in the earlier Chandra data despite being above the detection threshold if assuming constant flux. Therefore, Tibolla et al. (2014) concluded that this source is probably variable and propose an X-ray binary or a flaring star as the the most likely scenarios.
3 Suzaku data analysis
In September, 2012, the region of HESS J1507622 was observed with Suzaku with two deep pointings, one of them (sequence No. 507025010, 79.8 ks) centered on HESS J1507622 the other (sequence No. 507026010, 40.9 ks) centered on CXOU J150850.6621018 (see Tab. 1 for more details). We analyzed the XIS data using the most recent versions of the HEADAS software package (v6.15.1; Blackburn, 1995), and the HEASARC calibration database. We extracted images and spectra with xselect from the cleaned event lists using the recommended selection criteria (STATUS524287 && (STATUS%(2**17)2**16)) to remove events from the 55Fe calibration source.
| No. | sequence | exposure | Pointing position | |
|---|---|---|---|---|
| (ks) | R.A. | Dec. | ||
| 1 | 507025010 | 79.8 | 15:06:56.6 | 62:20:47 |
| 2 | 507026010 | 40.9 | 15:08:43.6 | 62:09:52 |
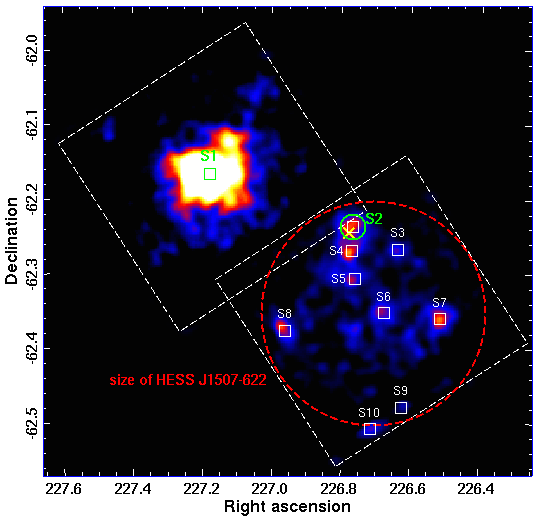
We extracted count images from both front-illuminated detectors (XIS0 and XIS3) in the 1-10 keV energy range. To generate images of the contribution from the non-X-ray background (NXB) in this energy range we used the tool xisnxbgen (Tawa et al., 2008). After NXB subtraction we corrected the images for the mirror vignetting using a simulated exposure map created with the tool xissim (Ishisaki et al., 2009) at an energy of 2.5 keV. Fig. 1 shows a combined mosaic image of the two Suzaku observations.
To detect point-like and extended sources we used the wavdetect tool from the CIAO v4.6 software package (Fruscione et al., 2006), setting the chance probability for a false detection to 1%. The positions of all detected sources are listed in Tab. 2 and indicated by small squares in Fig. 1. The table also lists likely counterparts from previous Chandra and XMM-Newton observations (Acero et al., 2011; Tibolla et al., 2014). With the exception of two sources (Suzaku J1506.76221 and Suzaku J1506.56229) all detected objects have counterparts from previous X-ray observations (see Tab. 2). However, due to their low count rates, no more detailed analyses concerning their spectra or extensions are possible.
Due to the significantly larger PSF of Suzaku two previously detected X-ray sources fall within the range of Suzaku J1508.86210: The bright extended source CXOU J150850.6621018 (Acero et al., 2011), also detected by XMM-Newton with consistent flux (XMMU J150851.1621017; Tibolla et al., 2014), and the much fainter but variable source XMMU J150835.7621021 (Tibolla et al., 2014, see also sect. 2). With XMM-Newton the flux of XMMU J150835.7621021 was detected at 10% of the flux from CXOU J150850.6621018. However, due to the apparent variability, the relative flux contributions may be different in this Suzaku observation (for further discussion see below). Due to this potential issue of source confusion, we will use the new Suzaku name for this source whenever we refer to the current analysis.
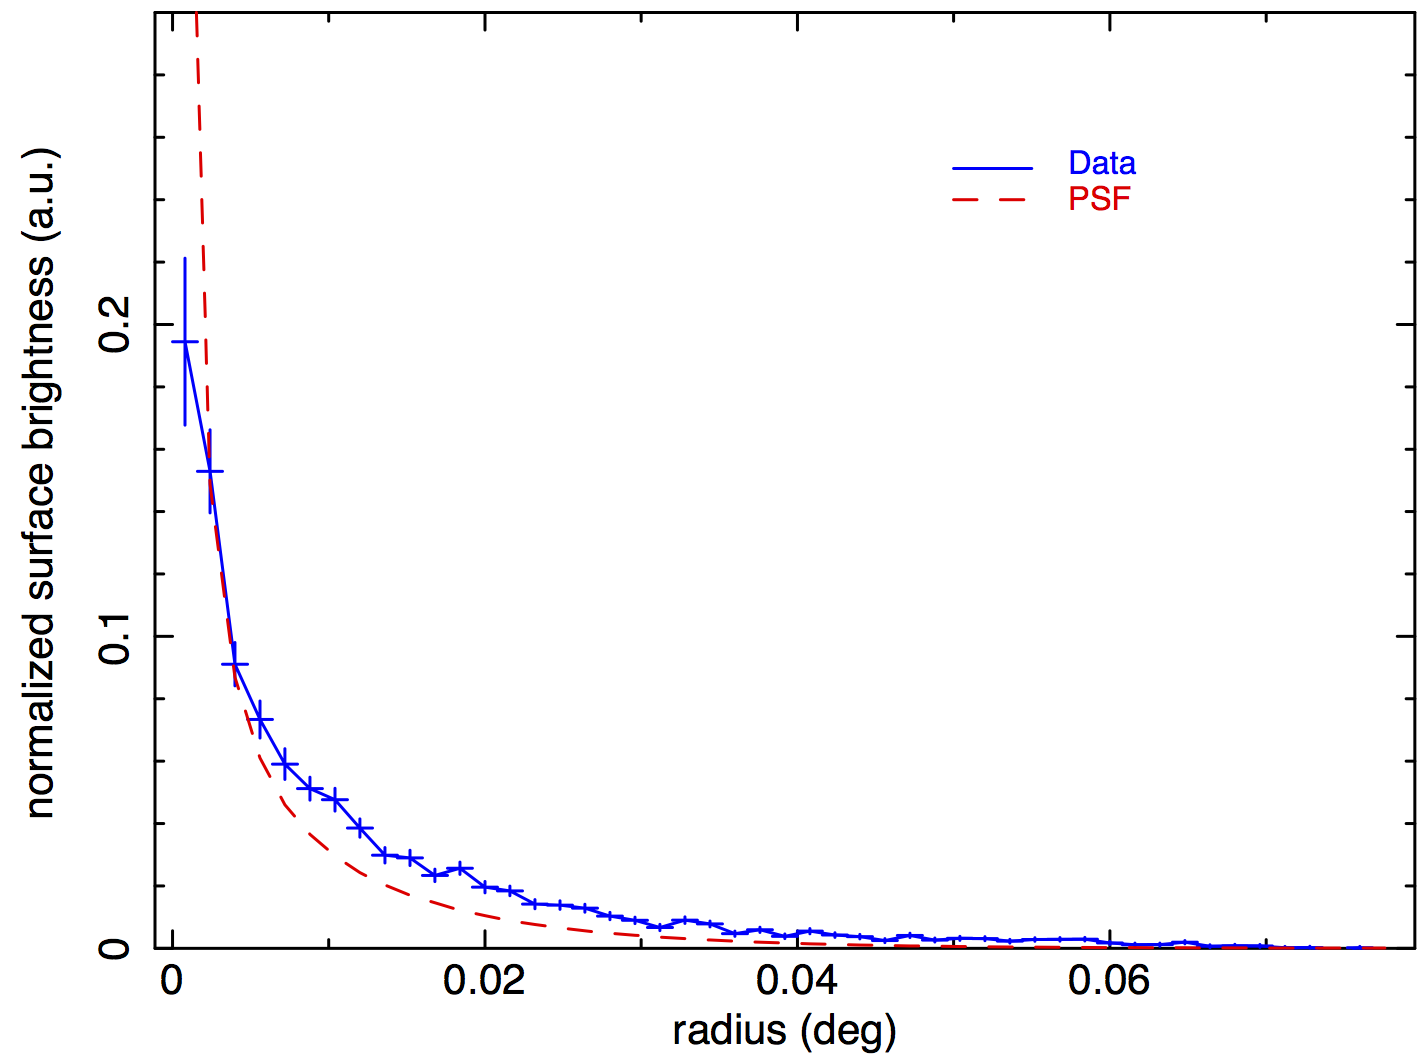
To test for an extension beyond the Suzaku PSF of Suzaku J1508.86210 we extracted its radial profile from the unsmoothed XIS03 counts image (1-10 keV). This profile is shown in Fig. 2 and compared to the on-axis PSF at an energy of 4.5 keV as stored in the Suzaku calibration database. To account for the diffuse astrophysical background component we subtracted from the data the surface flux level measured at offsets larger than 0.07∘ from the source position. The relative normalization between the data and PSF profiles was calculated such that they yield the same integral between 0 and 0.06∘. As is evident from Fig. 2, the morphology of Suzaku J1508.86210 is incompatible with a point-like source, as already stated by Matsumoto et al. (2014) and Sakai (2013). However, due to the comparatively large PSF of Suzaku, it is unclear how much of this apparent extent is due to the intrinsic size of CXOU J150850.6621018 or due to confusion with the offset source XMMU J150835.7621021 (see previous paragraph). Therefore, we suggest to refer to the extension measurements of CXOU J150850.6621018 with Chandra (Acero et al., 2011) and XMM-Newton (Tibolla et al., 2014) for a more reliable estimate of this parameter.
Of particular interest here is the faint extended source CXOU J150706.0621443, previously detected with Chandra and XMM-Newton, which can be also clearly identified in the new Suzaku observation: Suzaku J1507.06214. The position of Suzaku J1507.06214 is slightly shifted towards the North-West compared to the Chandra and XMM-Newton positions of CXOU J150706.0621443 (see Acero et al., 2011; Tibolla et al., 2014), as indicated by the yellow cross in Fig. 1. However, the high-resolution Chandra results do not show any other source towards the shifted direction and we thus rule out source confusion due to Suzaku’s larger point spread function as the origin of the shift. More likely, the relative offset originates from uncertainties in the absolute pointing position of 20′′ (see e.g. Uchiyama et al., 2008). We see similar offsets between the Suzaku and Chandra positions also for the other detected sources with Chandra counterparts in this observation. We therefore identify Suzaku J1507.06214 with CXOU J150706.0621443 and use the original Chandra name for this object for all further discussion in this paper.
We extracted spectra from all sources which offered a sufficient number of counts (i.e. S1, S2, S4, S7, and S8) from all three detectors (XIS0, XIS1, XIS3). For all sources but Suzaku J1508.86210 we chose an extraction radius of 60′′ which is recommended for point-like source analyses, and a nearby source-free region for the extraction of the background spectrum. Due to its intrinsic size and brightness we chose a larger radius of 120′′ for Suzaku J1508.86210 and a large concentric annular region for the background (also see Tab. 2). These new deep Suzaku data offer the opportunity to study the spectrum of the faint extended source CXOU J150706.0621443 which was not possible with previous observations by Chandra and XMM-Newton due to the limited count statistics.
| Source # | position | Source name | radius(1) | background region(1) | X-ray counterpart(2) | |
|---|---|---|---|---|---|---|
| R.A. | Dec. | Suzaku | (′′) | |||
| S1 | 15:08:50.6 | 62:10:18 | J1508.86210 | 120 | annulus: 260′′- 470′′ | CXOU J150850.6621018 |
| - | XMMU J150851.1-621017 | |||||
| - | XMMU J150835.7621021 | |||||
| S2 | 15:07:04.9 | 62:14:16 | J1507.06214 | 60 | offset, source-free region | CXOU J150706.0621443 |
| S3 | 15:06:35.9 | 62:16:24 | J1506.66216 | - | - | CXOU J150636.9621628 |
| S4 | 15:07:08.2 | 62:16:33 | J1507.16216 | 60 | offset, source-free region | CXOU J150708.8621643 |
| - | XMMU J150708.4621642 | |||||
| S5 | 15:07:06.0 | 62:18:45 | J1507.16218 | - | - | CXOU J150706.7621858 |
| S6 | 15:06:45.2 | 62:21:30 | J1506.76221 | - | - | - |
| S7 | 15:06:06.3 | 62:21:58 | J1506.16221 | 60 | offset, source-free region | CXOU J150606.7622210 |
| S8 | 15:07:54.0 | 62:22:58 | J1507.96222 | 60 | offset, source-free region | CXOU J150756.0622238 |
| - | XMMU J150755.9622237 | |||||
| S9 | 15:06:32.9 | 62:29:07 | J1506.56229 | - | - | - |
| S10 | 15:06:54.5 | 62:30:50 | J1506.96230 | - | - | CXOU J150656.1623040 |
We performed the spectral fits with XSPEC v12 (Arnaud, 1996) and used an absorbed powerlaw as well as a plasma (MEKAL) model to investigate both non-thermal and thermal radiation mechanisms. To model the photo-electric absorption we used the tbabs model along with the Galactic metal abundances from Wilms et al. (2000). For each source we fitted the spectra from all detectors simultaneously with linked spectral parameters. The spectral results are compiled in Tab. 3.
For four of these sources, flux estimates from previous X-ray observations with XMM-Newton and Chandra are available, three of them based on spectral fitting. For Suzaku J1507.96222 a previous flux estimate is available only from XMM-Newton where the flux was calculated from the count-rate assuming a certain spectral shape (see Tibolla et al., 2014, for details). Here, the new Suzaku flux is a factor of 2 lower compared to XMM-Newton, but still barely within the 1 statistical uncertainties. This discrepancy is probably due to differences between the assumed spectral parameters in the XMM-Newton measurement and the measured spectral shape in this work. Suzaku J1507.16216 has an XMM-Newton and Chandra counterpart with available spectral fitting results for XMM-Newton (see Tibolla et al., 2014). The fluxes are compatible within 1 uncertainties, however, the best-fit spectral slopes deviate significantly. This is most likely due to the fact that in the XMM-Newton analysis the absorption column density was fixed at the total Galactic value in this direction, whereas here we find that the source spectrum shows very little absorption with an upper limit on well below the total Galactic value (see Tab. 3). Correlations between and the spectral slope likely explain the discrepancies in spectral index.
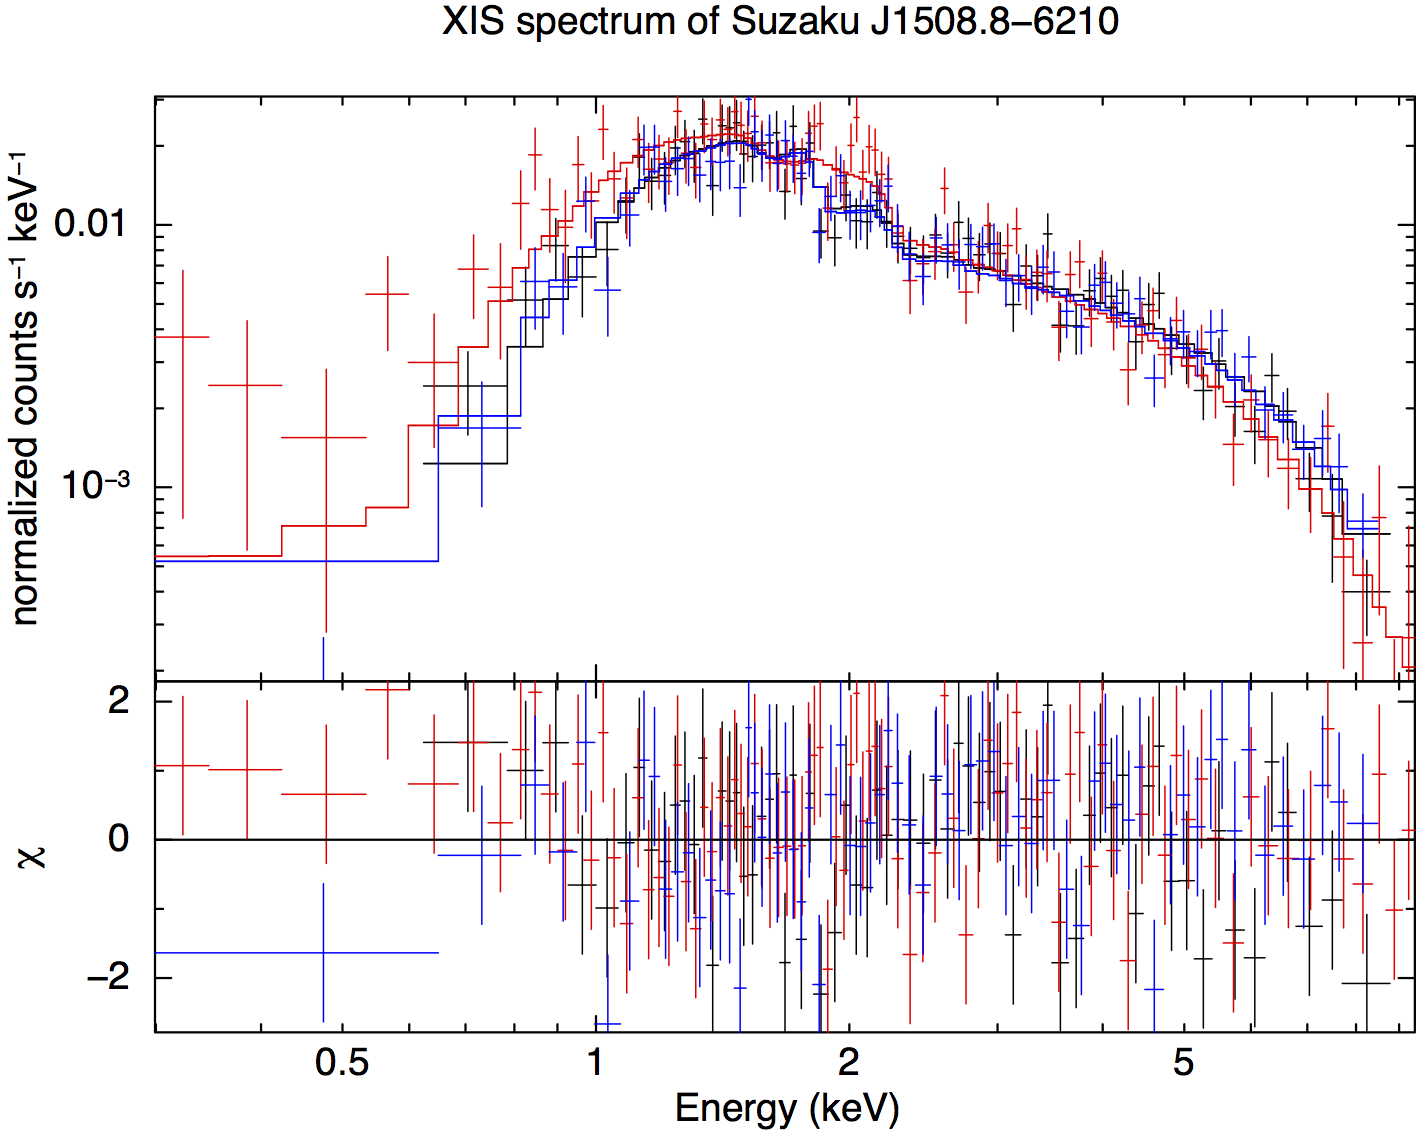
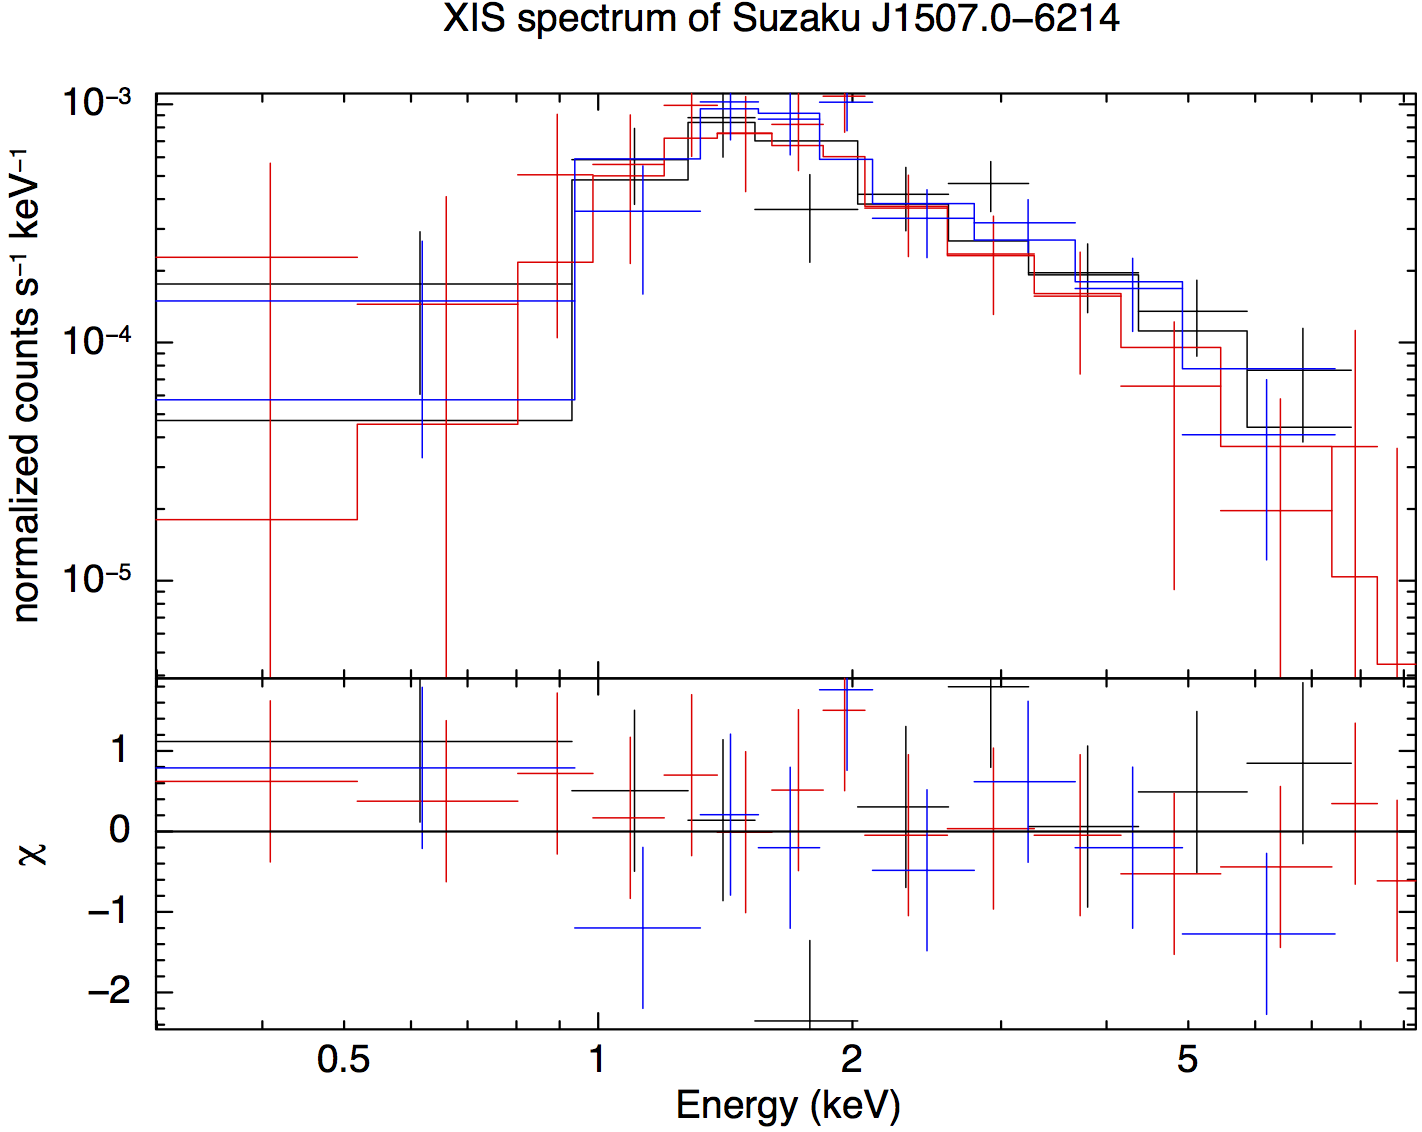
Below, we discuss the results for the two extended sources Suzaku J1508.86210 and CXOU J150706.0621443 in more detail. Figure 3 shows the spectra for these two sources along with the best-fit powerlaw models. Judging from the values, the powerlaw model is clearly preferred for Suzaku J1508.86210 (), whereas there is no clear preference for CXOU J150706.0621443, given the current data. For both sources, the value of appears to be large (see discussion in sect. 4.2) and, in the case of Suzaku J1507.06214, rather independent of the assumed spectral shape.
Matsumoto et al. (2014) and Sakai (2013) already reported about results for these two extended sources based on the same Suzaku dataset. These authors confirmed the extended nature of Suzaku J1508.86210. However, the lower count statistics from CXOU J150706.0621443, coupled with its more compact size, make it point-like for Suzaku. Our spectral results are compatible in terms of photon index and flux with the ones obtained by the authors above. However, we find systematically larger values for the hydrogen column density . Unfortunately, the description of the spectral analysis by these authors is not complete, and key information like the used absorption model and the assumed metal abundances are missing. We were able to reproduce the results of Matsumoto et al. (2014) and Sakai (2013) by changing from Galactic to solar metal abundances. Because of the higher metallicity of the sun compared to the average Galactic level, a lower equivalent hydrogen CD is needed for the same absorption effect, thus the lower value in their fit. However, because these sources are very likely of extra-solar origin, we remain with Galactic abundances and deem our results to be more realistic.
As already discussed in the first paragraph of this section, Suzaku J1508.86210 may be composed of the two independent X-ray sources CXOU J150850.6621018 and XMMU J150835.7621021. To compare with the previous Chandra result (Acero et al., 2011) we calculated a flux of Suzaku J1508.86210 in the 2-10 keV band of erg cm-2s-1 which is about 30% higher than the Chandra measurement of CXOU J150850.6621018. This difference might arise from an additional contribution from the fainter but variable source XMMU J150835.7621021. In this case the latter source must have had a 3 times higher flux during the Suzaku observation than during the earlier XMM-Newton measurement (see Tibolla et al., 2014). Variability of this magnitude is very well plausible for flaring stars (see, e.g. Liefke et al., 2010) and X-ray binaries (for a review, see van den Berg, 2010), the two most plausible scenarios for XMMU J150835.7621021 as suggested by Tibolla et al. (2014). Another contributing factor to the larger flux seen with Suzaku from Suzaku J1508.86210 compared to Chandra and XMM-Newton could arise from the larger region used for spectral extraction. However, this would only be the case if CXOU J150850.6621018 is much more extended than estimated from the XMM-Newton and Chandra maps, with a surface flux in the tails below their detection limit.
| source | (1) | / | / ndf | ||
|---|---|---|---|---|---|
| (1021 cm-2) | (-) / (keV) | (10-13 erg cm-2 s-1) | |||
| powerlaw | |||||
| S1 | 7.4 | 1.83 | 11.9 | 13.8 | 222.19 / 223 |
| S2 | 11.7 | 2.2 | 0.89 | 1.6 | 23.93 / 30 |
| S4 | 1.7 | 2.5 | 0.55 | 0.58 | 52.1 / 50 |
| S7 | 26 | 2.0 | 1.1 | 2.1 | 54.7 / 45 |
| S8 | 15 | 1.7 | 1.0 | 1.4 | 30.4 / 38 |
| MEKAL | |||||
| S1 | 4.7 | 8.5 | 11.8 | 12.9 | 266.81 / 223 |
| S2 | 11.4 | 3.3 | 1.0 | 1.5 | 23.48 / 30 |
| S4 | 0.7 | 2.8 | 0.57 | 0.58 | 59.8 / 50 |
| S7 | 25 | 4.6 | 1.1 | 1.8 | 54.4 / 45 |
| S8 | 11 | 6.5 | 1.0 | 1.3 | 29.7 / 38 |
all quoted uncertainties are at 68% confidence, and calculated with all other model fit parameters free to vary; (1)absorbing hydrogen column density (CD); (2)photon index or plasma temperature, depending on the assumed model; (3)observed energy flux (1-10 keV); (4)unabsorbed energy flux (1-10 keV), with the effects of foreground absorption removed
4 Discussion
Out of the two extended X-ray sources in the vicinity of HESS J1507622, originally detected by Chandra, in the following discussion we deem CXOU J150706.0621443 to be the more likely counterpart to the TeV emission due to its spatial coincidence with the intrinsic size of HESS J1507622, which is not the case for CXOU J150850.6621018 (Suzaku J1508.86210). Due to the lack of overlap with the VHE gamma-ray size of HESS J1507622, the latter source was considered a less likely counterpart in a PWN scenario (see Acero et al., 2011; Tibolla et al., 2014, and also Sect. 2).
After the discovery of HESS J1507622, a leptonic scenario was favored (Acero et al., 2011) while hadronic scenarios were considered unlikely (Domainko, 2011). Acero et al. (2013) reported a point-like Fermi-LAT counterpart with soft spectrum. However, the nature of the source still remains elusive. On the one hand, several PWN models were successfully applied to describe the emission seen from HESS J1507622: Tibolla et al. (2011) proposed an ancient PWN model (developed by de Jager et al., 2009), Tibolla et al. (2012) fitted a modified leaky-box model of (Zhang et al., 2008), and Vorster et al. (2013) managed to describe HESS J1507622 with a time-dependent PWN model. On the other hand, no pulsar has been detected in the vicinity of HESS J1507622 (Acero et al., 2011).
The nature of the TeV gamma-ray source HESS J1507622 is challenging to explain with established models for Galactic sources, such as young supernova remnants and PWNe, due to its large offset from the Galactic plane coupled with its apparent compactness. In a PWN scenario the latter feature may indicate either that the source is nearby and still young, or that the source is more evolved and far away. The problems with the first scenario are the absence of a young ( yr) and powerful pulsar and the relatively low X-ray flux of the candidate synchrotron nebula CXOU J150706.0621443. To explain the low X-ray flux, in the second scenario the PWN would be a more evolved system (e.g. Mattana et al., 2009; Balbo et al., 2010). In this framework Acero et al. (2011) found a distance of HESS J1507622 of 6 kpc by comparing its angular extent with the size of the nearby, evolved Geminga PWN. A distance of 6 kpc has also been adopted in previous PWN models (Tibolla et al., 2011, 2012; Vorster et al., 2013). If the extension of HESS J1507622 is driven by diffusion of energetic electrons for a time-scale of years, the distance to the object needs to be very large (10 kpc) to be compatible with the apparent compactness of the TeV source (Domainko & Ohm, 2012). This in turn implies a large physical distance of HESS J1507622 from the Galactic plane, in particular much larger than the scale height of the distribution of VHE gamma-ray emitting pulsars. A remedy for this situation would be an association to hyper-velocity stars or HESS J1507622 being a member of a new population of gamma-ray sources associated to older stellar populations. For a more detailed discussion of these scenarios see Domainko & Ohm (2012) and Domainko (2014).
As becomes evident from the above discussion, the most important, but yet unknown parameter is the distance of HESS J1507622 from Earth. Also, the details of the spectral shape and the flux of the non-thermal X-ray counterpart to HESS J1507622 are very valuable to constrain intrinsic source properties, such as magnetic field and age.
In the subsections below we explore the implications of the measured spectral parameters of CXOU J150706.0621443 on its distance (using ), and on the properties of the underlying relativistic particle population (using the spectral index and flux).
4.1 Modeling the spectral energy distribution
We use our spectral measurement of CXOU J150706.0621443 for an updated modeling of the spectral energy distribution (SED) of HESS J1507622. We assume that CXOU J150706.0621443 is physically related to HESS J1507622 because of its extended nature and its spatial coincidence with the VHE gamma-ray source. Fig. 4 shows the broad-band spectral measurements used for this study. Here, the X-ray data points are the unfolded (corrected for instrument response) data from the Suzaku observation, corrected for the foreground absorption as determined by the best-fit powerlaw model, taking also parameter uncertainties into account (hence the large error bars of the lowest energy data point where the influence of is strongest). In addition to the new Suzaku spectral data points of CXOU J150706.0621443 we show in Fig. 4 also the uncertainty range of the previous best-fit powerlaw model measured with Chandra (see Tibolla et al., 2014). The latter is only an approximation, calculated from the quoted uncertainties of the integral flux and photon index, assuming no parameter correlations (as the full covariance matrix of the Chandra fit has not been published). The uncertainties of the Chandra measurement are very large due to limited statistics and both spectra are compatible within errors. The slightly lower flux seen with Chandra may arise from the smaller size of the spectral extraction region compared to the new Suzaku analysis.
A case for a leptonic origin of HESS J1507622 has been made in the past by various authors (Acero et al., 2011; Tibolla et al., 2011, 2012; Vorster et al., 2013) in the framework of a PWN scenario (see also Weiler & Panagia, 1978; Gaensler & Slane, 2006). One-component broken powerlaw electron spectra (Torres et al., 2014) and two-component electron spectra (Vorster et al., 2013) were adopted to fit the SED of several PWNe. For HESS J1507622, using the flux measurement from the 2-year Fermi-LAT source catalog (2FGL) below 100 GeV (Nolan et al., 2012), Vorster et al. (2013) were able to fit the SED of HESS J1507622 with a two-component electron spectrum. Here, we adopt the result of the longer 34-month Fermi-LAT data set analyzed by (Domainko & Ohm, 2012) for energies below 100 GeV, following the approach of Torres et al. (2014), and fit a one-component electron spectrum. This is mainly done to reduce the number of free parameters compared to a two-component injection spectrum.
We assume a broken powerlaw energy distribution for the radiating electrons with a spectral break of , as expected for a cooling break for continuous injection over longer periods of time caused by synchrotron and inverse-Compton radiation in the Thomson regime. With these assumptions we find a best-fit model with a spectral index below the break energy () of , for a spectral index of , and = 0.9 TeV. The total energy in electrons is erg with being the distance to the source. The maximum energy of electrons in this model is = 1 PeV, a value which is necessary to reproduce the highest energy X-ray data points.
From this model fit, constraints on the age of the radiating electrons can be obtained. For the case were the break at 0.9 TeV in the broken powerlaw is introduced by inverse-Compton cooling on the CMB, this would point towards an age of the source of years, i.e. a rather old source. This can be compared to age estimates based on the evolution of PWNe if such an origin is adopted for HESS J1507622. Mattana et al. (2009) found that the ratio of the flux in VHE gamma-rays (1-10 TeV) and the flux in X-rays (2-10 keV) strongly increases with PWN age. Applying this method for HESS J1507622 with log, an age of about years and thus a rather evolved PWN would be found. This is consistent with the fact that the size of the TeV source is much larger than the size of the X-ray source for evolved PWN (Kargaltsev & Pavlov, 2010) which also appears to be the case for HESS J1507622. An age of about years would be in line with the PWN models of Tibolla et al. (2012) and Vorster et al. (2013). This age estimate is significantly smaller than the age of the Geminga PWN. Therefore, in the PWN scenario, HESS J1507622 could be significantly less extended than the Geminga PWN and could thus be located closer than the 6 kpc as discussed above (note that the multi-kpc distance estimate in Sect. 4.4 is independent from spectral modelling and only based on the X-ray absorption measurement of the potential X-ray counterpart). The caveat for this interpretation is the smaller ratio of Geminga with respect to HESS J1507622. Vorster et al. (2013) proposed the passage of the reverse shock to resolve this discrepancy. In this paper we did not consider the effect of a past reverse shock passage on HESS J1507622. Our modelling parameters are given for the present particle spectrum in this source. It has also to be noted that no supernova remnant has been detected around HESS J1507622. Additional constraints on the age of radiating electrons can be placed by the maximum particle energy. Electrons with an energy of about 1 PeV cool very fast via inverse-Compton radiation, and have to have been injected less than 1 kyr ago into the system. This may indicate the presence of a second spectral component at the highest energies and more generally may indicate that a two-component electron spectrum seems to be favored over a one-component electron spectrum. To summarize, for a leptonic scenario the SED of HESS J1507622 suggests a rather evolved system albeit with recent injection of highly energetic particles.
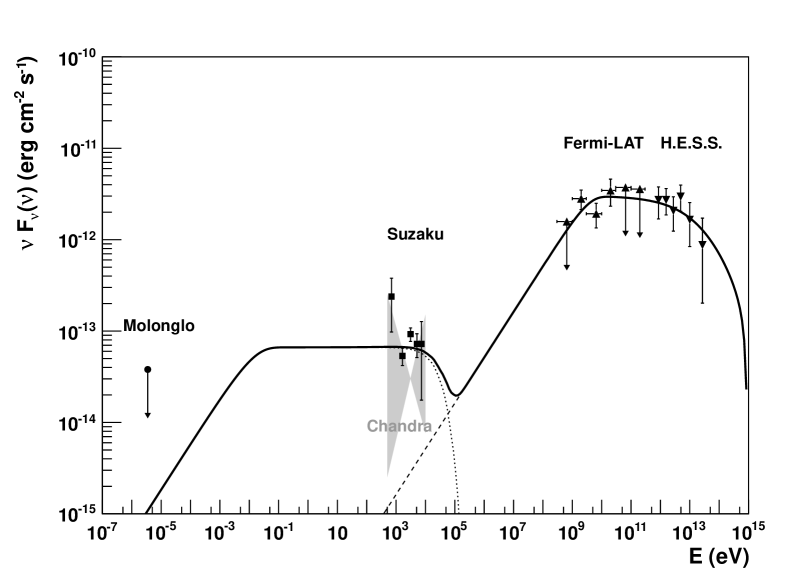
In this model the magnetic field is 0.47 G. This value for is consistent with the estimates of by (Acero et al., 2011) but is smaller than the values found by (Domainko & Ohm, 2012, 1 G) and (Vorster et al., 2013, 1.7 G). The reason for this difference is the fact that here the measured hard X-ray spectrum for CXOU J150706.0621443 is used for the SED modeling, in contrast to the softer spectra assumed in the previous studies.
One caveat of such leptonic one-zone models is the significant difference of sizes of the emission regions in the X-ray and gamma-ray regimes. This may introduce a bias (i.e. underestimation of the synchrotron flux) in models where it is assumed that the X-ray and TeV fluxes are produced by the same population of electrons. With Chandra the size of CXOU J150706.0621443 was estimated to be 20-25′′ (Acero et al., 2011), and with the new Suzaku data the associated source (Suzaku J1507.06214) appears to be point-like and its flux to be contained within a radius of 60′′ (which is also the suggested spectral extraction radius for point-like sources with Suzaku, see also Fig. 1).
However, a larger scale emission component comparable to the intrinsic size of HESS J1507622 may not be detectable if the surface flux in X-rays is sufficiently low. For a very conservative estimate of the highest possible X-ray flux from the TeV emission region, we use the ratio between the intrinsic size of HESS J1507622 and the area used for spectral extraction from CXOU J150706.0621443 in this work (), as well as the ratio of the X-ray surface flux from source-free regions and the region of CXOU J150706.0621443 (). Assuming that all the diffuse X-ray surface flux from source-free regions is related to HESS J1507622 a scaling factor of needs to be applied to the measured flux from CXOU J150706.0621443. The implications of the increased X-ray flux on the model parameters would be an enhanced magnetic field (by a factor of , i.e. G) and a cut-off of the electron spectrum decreased by the same factor, i.e. TeV (following Hinton & Hofmann, 2009).
4.2 Comparison to measured values of the neutral hydrogen column
The values of derived from the X-ray spectra in sect. 3 can be compared to measured values of the total absorbing CD of neutral hydrogen in the direction of the sources. Soft X-rays are absorbed by interstellar gas, which predominantly consists of atomic (HI) and molecular hydrogen (H2).
The HI distribution in the galaxy has been measured by Dickey & Lockman (1990) and Kalberla et al. (2005). For the direction of HESS J1507622 Dickey & Lockman (1990) estimated a HI CD of cm-2 and Kalberla et al. (2005) constrained it to cm-2111http://heasarc.gsfc.nasa.gov/cgi-bin/Tools/w3nh/w3nh.pl. In comparison to these values Suzaku J1508.86210 and CXOU J150706.0621443 seem to be absorbed on a comparable or even higher level. This indicates that these sources are located at the edge or even outside the main HI distribution of the Galaxy. The excess absorption for the two sources in comparison to the values found in the surveys could in principle be attributed to Galactic molecular hydrogen that is not measured in the HI surveys.
Absorption by neutral hydrogen in soft X-rays is tightly correlated to dust absorption in the optical (Predehl & Schmitt, 1995). Consequently, from the measured level of dust absorption (AV), the total CD in cold hydrogen can be estimated. For CXOU J150706.0621443 (located inside HESS J1507622) we find A and for Suzaku J1508.86210 A (Schlafly & Finkbeiner, 2011)222http://ned.ipac.caltech.edu/. These measured values of AV correspond to a cold hydrogen absorption of cm-2 for CXOU J150706.0621443 and cm-2 for Suzaku J1508.86210 (Predehl & Schmitt, 1995). These comparisons evidence that both sources experience soft X-ray absorptions consistent with the total Galactic CD of neutral hydrogen. However, it has to be noted that the measurement of dust absorption may not be precise at Galactic latitudes (Schlafly & Finkbeiner, 2011).
An alternative method to determine the total X-ray absorbing hydrogen CD is described by Willingale et al. (2013) who used 493 gamma-ray burst afterglows to calibrate estimates of based on measurements of atomic hydrogen and dust extinction. Using their web tool333http://www.swift.ac.uk/analysis/nhtot/index.php to estimate the total () for the region of HESS J1507622 we get a value of =̃ 5.7 cm-2 and for Suzaku J1508.86210we obtain =̃ 5.9 cm-2. Both values are slightly lower than estimated from the dust absorption AV directly (see previous paragraph).
4.3 Comparisons to models of the Galactic neutral hydrogen distribution
The highly absorbed X-ray spectrum of CXOU J150706.0621443 may suggest that any associated object is located at a considerably large distance to Earth. In order to estimate the source distance, we use a large-scale 3D model for both atomic and molecular Galactic hydrogen gas and compare it to the CD derived from the Suzaku measurements. This model is based on the descriptions of the large-scale distribution of HI and gas in the Milky Way by various authors, summarized by Ferrière (2001). There, a galacto-centric distance of the sun of = 8.5 kpc is assumed, and gas distributions that apply different values of are rescaled to the updated value by the author. We also adopt this value of in the following.
The large-scale distribution of each of the mentioned gas components is modeled as follows: First, the radial (i.e. with , the distance to the Galactic center along the Galactic plane) distribution of the azimuth averaged gas CD perpendicular to the Galactic plane (vertical CD) is obtained. Second, the radial profile of the gas layer thickness is determined. Lastly, a vertical density distribution function is assumed, and its normalization and width is determined by the two other distributions. As a result, for each set of coordinates , where is the vertical distance to the Galactic plane, a space-averaged number density of hydrogen nuclei can be calculated.
Furthermore, we allow for a large-scale Galactic spiral arm structure by modulating the gas densities towards the arms in a simple manner, as described in sect. 4.3.3.
4.3.1 Atomic hydrogen (HI)
Dickey & Lockman (1990) provide the azimuth averaged radial distribution of the HI vertical CD, which can be roughly described by a three-component structure: a depletion at the Galactic center followed by an increase to a value of at a distance of kpc (region (i)). This transitions into a constant regime (region (ii)) which passes through the solar circle and out to almost kpc. At farther distances (region (iii)), the values of the vertical CD again decrease in an exponential fashion. We use the following parameterization to describe the radial distribution of the vertical HI CD:
with in units of kpc.
The HI gas layer thickness is modeled according to Dickey & Lockman (1990): The FWHM increases from the Galactic center outwards to kpc (region (a)) from 165 pc to 230 pc. Between kpc and the solar circle (region (b)) the layer thickness is assumed to remain constant at a value of 230 pc. We model the flaring of the gas layer outside the solar circle (region (c)) by a linear increase to a value of about 3 kpc at kpc.
Finally, we use the vertical density profile reported by Ferrière (2001), resembling two Gaussian functions plus an exponential tail:
Here we are rescaling the width of the function according to our model of the HI gas layer thickness while the normalization factor is fixed by .
4.3.2 Molecular hydrogen (H2)
We model the distribution of the molecular hydrogen component in a similar way, using the azimuth-averaged results of Clemens et al. (1988) for H2 in the first Galactic quadrant. The radial distribution of the vertical molecular hydrogen CD is modeled empirically to follow the distribution provided by Clemens et al. (1988)444Rescaled to the updated value of kpc, see Ferrière (2001). as
For the FWHM of the layer thickness as function of the Galacto-centric radius, we use the powerlaw parameterization by Clemens et al. (1988):
The density distribution perpendicular to the Galactic plane follows the shape described in Ferrière (2001), again rescaled in width and normalization as given by and ,
4.3.3 Spiral Arms
As an option, we also allow for the modulation of the gas density towards Galactic spiral arms. In the inter-arm regions Clemens et al. (1988) found values of the space-averaged density of molecular hydrogen lowered by a factor of compared to the density inside the arms. A similar contrast of is found for the HI surface density, see Kulkarni (1982).
The geometrical arm model is taken from Valée (2005), but we rescaled the spirals to match our value of = 8.5 kpc, which is somewhat larger than Valée’s value of 7.9 kpc. The width of the spiral arms is adopted from Russeil (2003), who found a FWHM value for all four arms of = 1.32 kpc, corresponding to a Gaussian width of = 0.56 kpc. The space-averaged gas density follows a Gaussian profile perpendicular to the spiral arm tangential direction so that the density between the arms is a factor of 4 lower than in their center,
Here, is the distance to the nearest spiral arm and = 0.32 is an empirically determined normalization factor to obtain the same number of hydrogen nuclei in both the modulated and unmodulated models.
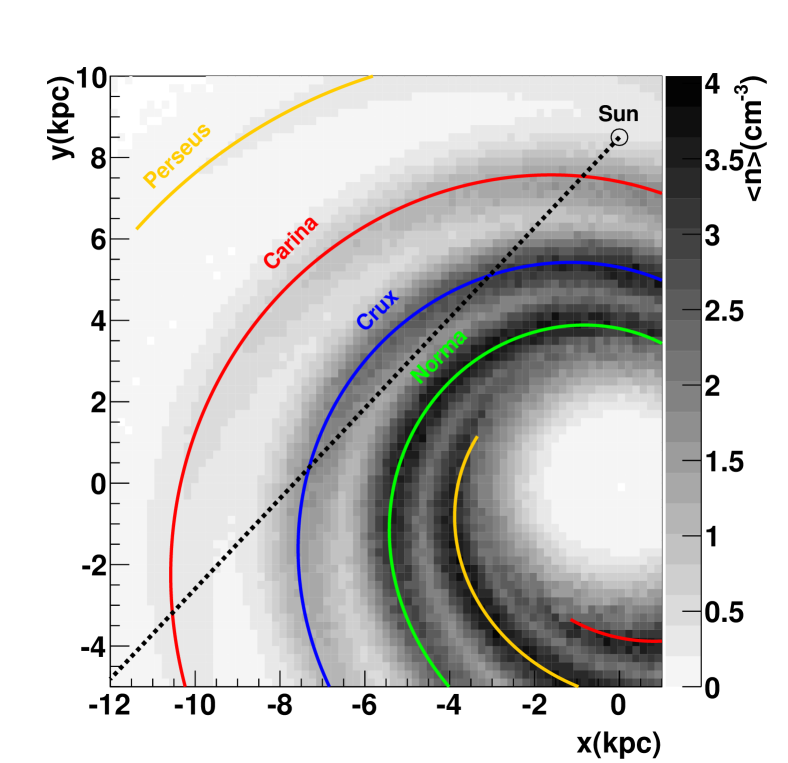
The resulting gas densities, averaged perpendicular to the Galactic plane, are shown in Fig. 5.
4.4 The distance to HESS J1507622
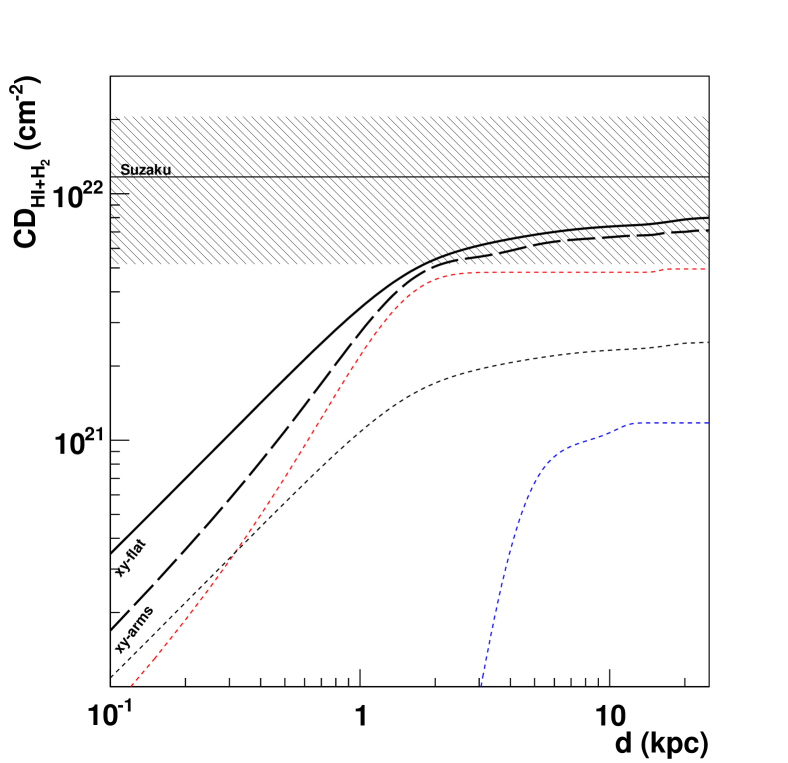
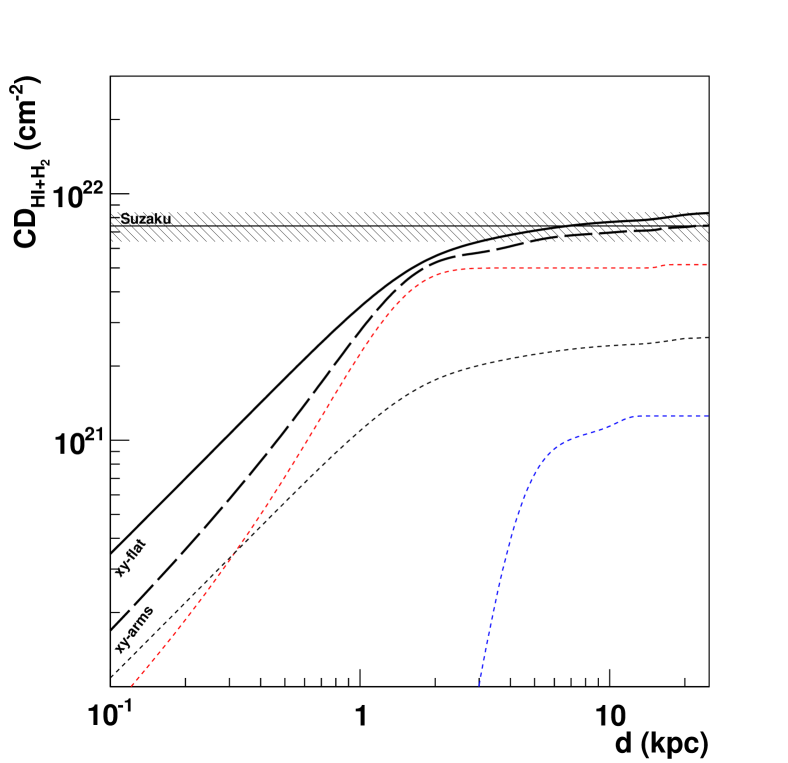
The model described in sect. 4.3 allows to derive the theoretically expected neutral hydrogen CD in the direction of CXOU J150706.0621443 as a function of the distance to Earth, . The result is shown in the left panel of Fig. 6. For distances larger than 2 kpc, both models agree within errors with the Suzaku measurement. The spiral arm modulation results in overall lower values for than those obtained for a ’flat’ galaxy in the x-y plane. This is especially pronounced at distances smaller than 1 kpc, as the main contribution to the CD stems from the gas concentrated in the Carina arm (red line in Fig. 6, see also Fig. 5).
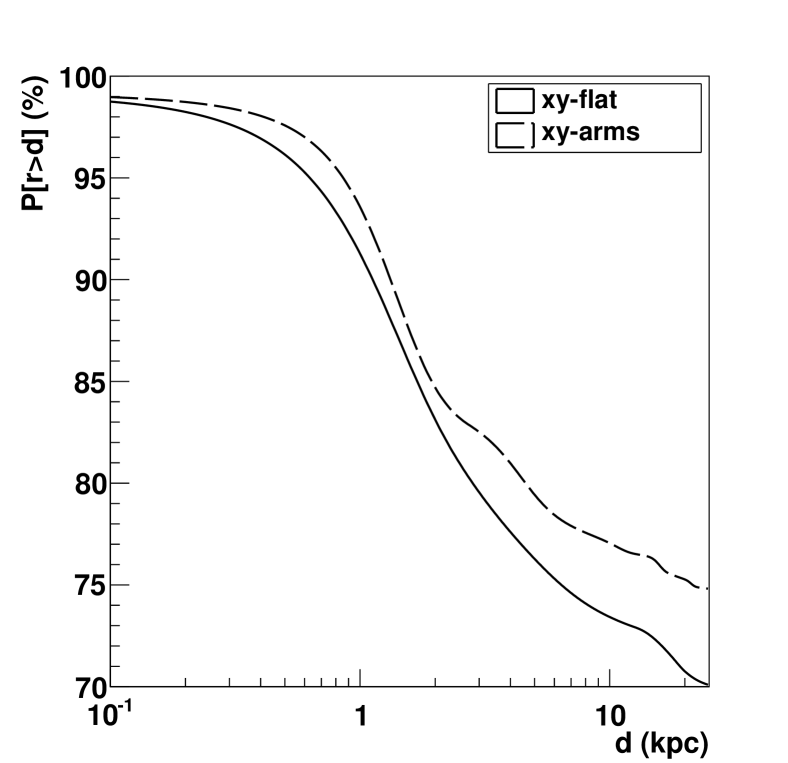
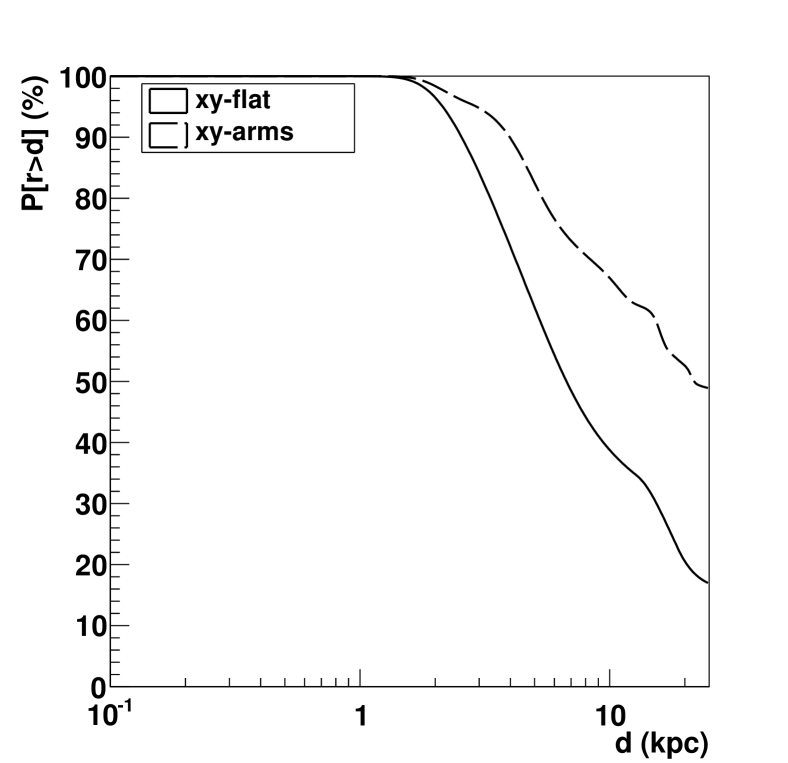
We use the modeled CD profile along to calculate the probability of CXOU J150706.0621443, and presumably HESS J1507622, being located at a distance . To that end, we treat the asymmetric error interval of the X-ray measurement as a distorted Gaussian distribution, following Method 2 described in Barlow (2004). The resulting profile is shown in Fig. 6. As can be seen, the X-ray measurements and Galactic gas model places CXOU J150706.0621443 with probabilities of 70% (flat galaxy) or 75% (arm-modulated) at distances larger than 25 kpc, which corresponds to the edge of the Galaxy. Interestingly, HESS J1507622 is located very close to the super-galactic plane (SG-lon: 183.6∘, SG-lat: 0.2∘), a location where nearby Extragalactic objects cluster (Lahav et al., 2000), and also where all non-blazar Extragalactic TeV sources are concentrated (see TeVCat555http://tevcat.uchicago.edu/). Although interesting, these values, however, do not yet allow to make any definitive statements on the exact location of HESS J1507622, due to the relatively large uncertainties of the measurement from the X-ray spectrum.
Our constraints on the distance to HESS J1507622 can be compared to the distance estimates by Matsumoto et al. (2014) for Suzaku J1508.86210 of kpc and for CXOU J150706.0621443 of kpc. We note here that also their measurements of the total are compatible with the total Galactic CD within 1 uncertainties, and thus the calculation of an upper bound of the distances to these two sources should not be possible, contrary to what is indicated by the symmetric distance uncertainties quoted by Matsumoto et al. (2014). In such cases, the only constraints on the distance can be given in terms of probabilities for to be larger than a certain value , as, e.g., derived from our model (see Fig. 6). Furthermore, the estimates by Matsumoto et al. (2014) are based on the assumption of an average Galactic ISM density of 1 cm-3, which is probably not appropriate for the specific case of HESS J1507622, due to its large offset from the Galactic plane and hence significantly lower ambient densities, particularly for large distances. This assumption of a too dense medium systematically biases the resulting distance estimates towards lower values.
We note here that the total values of derived from the Galaxy model are comparable or slightly larger than those estimated from measurements (see sect. 4.2. Therefore, the derived probabilities of HESS J1507622 being located at a distance in this section can be viewed as conservative, since lower values of in the model would result in even larger distances.
For comparison, we apply the same procedure to Suzaku J1508.86210. The result can be seen in Fig. 7. Both the unmodulated and spiral arm model predictions for the absolute neutral hydrogen CD in the direction of the source agree within errors with the Suzaku measurements. As the predicted total hydrogen CD in case of the modulated gas model almost perfectly coincides with the X-ray value, the estimated probability for Suzaku J1508.86210 to be extragalactic or at the edge of the milky way is 50% in this case. With the unmodulated gas model, the total hydrogen CD is predicted at a higher value but still matches the upper 1-limit of the X-ray measurement, favoring a Galactic nature of the source with a probability of 84%. Again, our model predictions on the total hydrogen CD are somewhat larger than the independent measurements presented in sect. 4.2, which would result in lower probabilities of Suzaku J1508.86210 being a Galactic source.
4.5 Implications for a PWN scenario
As discussed in the previous section (4.4) the comparatively large value of measured in X-rays might indicate a considerable line-of-sight distance of CXOU J150706.0621443, and potentially HESS J1507622, from Earth. Given the rather high Galactic latitude (), this would also imply a large vertical distance to the Galactic plane, . Also, the Galactic longitude () of HESS J1507622 defines a minimal value of , = 5.7 kpc. These distances, together with a model for the distribution of PWNe in the Galaxy, are used in the following to estimate the probability of a PWN scenario for HESS J1507622.
4.5.1 Un-recycled pulsars
First we investigate the probability of HESS J1507622 being the PWN associated with an un-recycled pulsar. This is the population of pulsars considered in the study of Mattana et al. (2009). We assume that PWNe follow the distribution of pulsars in the Milky Way. Corresponding radial and vertical distribution functions have been proposed by Yusifov & Küçük (2004) and Faucher-Giguère & Kaspi (2006), respectively, and are adopted in our model. The mentioned radial distribution describes a powerlaw increase followed by an exponential decay, , and reaches its maximum at kpc. For the distribution perpendicular to the Galactic plane we assume an exponential profile with scale height . The value of is estimated by a fit to the -distribution of pulsars detected by the Fermi-LAT instrument (Abdo et al., 2013, the Second Fermi Large Area Telescope Catalog of Gamma-Ray Pulsars), which provides a homogeneous sky coverage. To fit the pulsar distribution we used all Galactic Fermi-detected un-recycled pulsars without any cut on age or spin-down power. This results in a sample of 51 pulsars. An exponential fit to the -distribution () yields a scale height of pc.
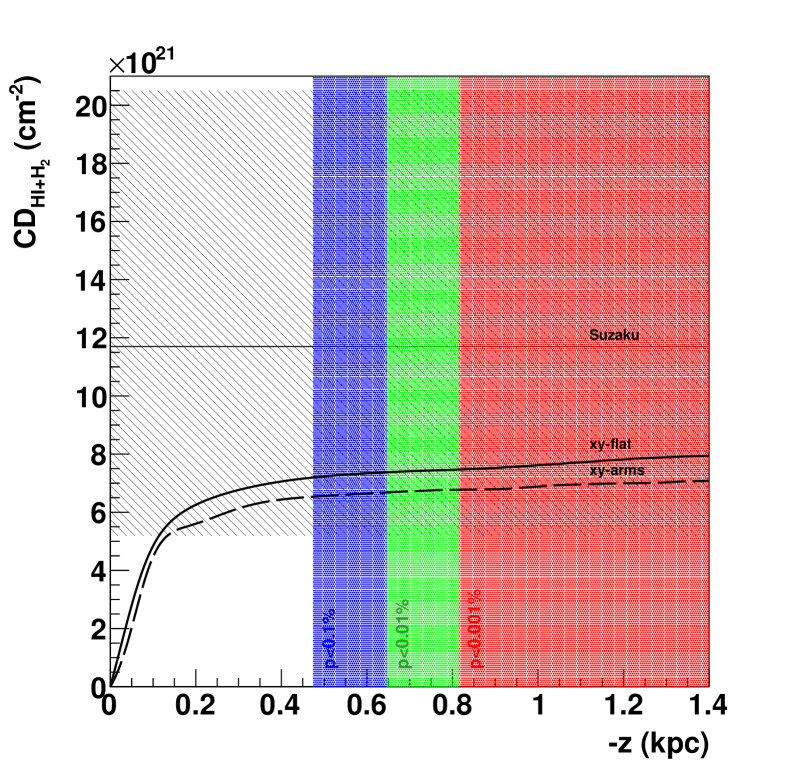
With this distribution function one can determine the probability to find a pulsar at any given coordinate . For instance, assuming a value of pc, at a perpendicular distance to the Galactic plane of = 815 pc, the chance to find a pulsar is = 0.001%. We calculated the CD towards HESS J1507622 that corresponds to and compare it to the X-ray measurement of , again treating the probability distribution of the latter as a distorted Gaussian (see Sec. 4.4). This comparison places the sources with a probability of 73% (flat galaxy) and 76% (spiral arms) at values . Thus, at a confidence of 99.999%, model and measurement exclude a PWN scenario for HESS J1507622 with probabilities between 73% and 76%. Probabilities for different values of are given in Tab. 4 and also shown in Fig. 8 for pc. Again, given the relatively large uncertainties of the X-ray measurement of , these results do not allow to disfavor a PWN scenario with high confidence.
| 0.1% | 475 | 74% | 78% |
|---|---|---|---|
| 0.01% | 647 | 73% | 77% |
| 0.001% | 815 | 73% | 76% |
4.5.2 Millisecond pulsars
In this section we discuss the implication of the rather large value of for the case where HESS J1507622 is the nebula associated with a millisecond pulsar (MSP). MSPs are commonly believed to be very old pulsars with characteristic ages of 109 years that were recycled by accretion from a companion star (e.g. Alpar et al., 1982; Grégoire & Knödlseder, 2013). Following the discussion of the potentially old age of HESS J1507622 in Sect. 4.1, a MSP may be a potential counterpart. Owing to their age their distribution features a large Galactic scale height of about 1 kpc and a Galactic scale length of about 4 kpc (as measured from the Fermi-LAT detected MSPs Grégoire & Knödlseder, 2013). This scale height is larger than the scale heights of cold hydrogen and therefore no constraints on the probability of HESS J1507622 being a PWN associated to a MSP can be made. However, so far no detection of a PWN related to a MSP in VHE gamma-rays has been reported in the literature. However, this can in principle be a selection bias since MSPs do not strongly cluster around the Galactic plane, the region with the deepest large-scale exposure by VHE gamma-tray telescopes such as H.E.S.S. Future observations of powerful MSPs are required to test the presence of VHE-gamma-ray emitting PWNe around these objects.
5 Summary and Outlook
In this paper we present spectral results for the potential X-ray counterpart to the enigmatic TeV gamma-ray source HESS J1507622. On the basis of this new measurement we provide interesting constraints on the parameters of the underlying population of relativistic particles, and also on the line-of-sight distance to the object. Even though this study represents a significant step forward in the identification of the origin of non-thermal emission from this puzzling object, the relatively low count statistics of the X-ray detection, and the resulting large uncertainties of the derived model parameters do not allow very strong conclusions. However, we see indications that the potential X-ray counterpart to HESS J1507622 might be located at a considerable distance from Earth, which would strongly challenge established models for Galactic gamma-ray source populations, in particular PWNe.
Future deeper X-ray observation with high-throughput instruments providing higher statistical quality could greatly improve the strength and conclusiveness of this result.
Acknowledgments
This research has made use of data obtained from the Suzaku satellite, a collaborative mission between the space agencies of Japan (JAXA) and the USA (NASA). This research has made use of data and/or software provided by the High Energy Astrophysics Science Archive Research Center (HEASARC), which is a service of the Astrophysics Science Division at NASA/GSFC and the High Energy Astrophysics Division of the Smithsonian Astrophysical Observatory.
References
- Abramowski et al. (2011) Abramowski, A. et al. (H.E.S.S. collaboration) 2011, A&A, 529, A49
- Abramowski et al. (2012) Abramowski, A. et al. (H.E.S.S. collaboration) 2012, A&A, 548, A46
- Abdo et al. (2013) Abdo, A. A. et al. (Fermi collaboration) 2013, ApJS, 208, id17
- Acero et al. (2011) Acero, F. et al. (H.E.S.S. collaboration) 2011, A&A, 525, A45
- Acero et al. (2013) Acero, F. et al. (Fermi-LAT collaboration) 2013, ApJ, 773, id77
- Aharonian et al. (2005) Aharonian, F. et al. (H.E.S.S. collaboration) 2005, A&A, 442, 25
- Aharonian et al. (2005) Aharonian, F. et al. (H.E.S.S. collaboration) 2005, A&A, 439, 1013
- Aharonian et al. (2006a) Aharonian, F. et al. (H.E.S.S. collaboration) 2006, A&A, 460, 365
- Aharonian et al. (2006b) Aharonian, F. et al. (H.E.S.S. collaboration) 2006, A&A, 448, 43
- Alpar et al. (1982) Alpar, M. A. et al. 1982, Nature, 300, 728
- Arnaud (1996) Arnaud, K.A. 1996, Astronomical Society of the Pacific Conference Series, Vol. 101, Astronomical Data Analysis Software and Systems V, ed. G. H. Jacoby & J. Barnes, 17
- Balbo et al. (2010) Balbo, M. et al. 2010, A&A, 520, 111
- Barlow (2004) Barlow, R. 2004, Proceedings of the PHYSTAT2003 conference, SLAC, September 2003. ECONF C030908:WEMT002, preprint (astro-ph/0401042)
- Blackburn (1995) Blackburn, J. K. 1995, ASP Conf. Ser., Vol. 77, 367
- Bock et al. (1999) Bock, D. C.-J., Large, M. I., Sadler, E. M. 1999, ApJ, 117, 1578
- Cassam-Chenaï et al. (2004) Cassam-Chenaï et al. 2004, A&A, 427, 199
- Clemens et al. (1988) Clemens, D. P., Sanders, D. B., Scoville, N. Z. 1988, ApJ, 327, 139-155
- Decourchelle et al. (2001) Decourchelle et al. 2001, A&A, 365, L218
- de Jager et al. (2009) de Jager et al. 2009, Proceedings of the 31st International Cosmic Ray Conference (ICRC2009), held in July, 2009 in Lodz, Poland, edited by the Local Organizing Committee of ICRC, 2009arXiv:0906.2644
- Dickey & Lockman (1990) Dickey, J. M. & Lockman, F. J. 1990, ARA&A, 28, 215
- Domainko (2011) Domainko, W. F. 2011, AdSpR, 47, 640
- Domainko & Ohm (2012) Domainko, W. & Ohm, S. 2012, A&A, 545, A94
- Domainko (2014) Domainko, W. F. 2014, arXiv:1404.0889
- Faucher-Giguère & Kaspi (2006) Faucher-Giguére, C.-A. & Kaspi, V. M. 2006, ApJ, 643, 332
- Ferrière (2001) Ferrière, K. M. 2001, RevModPhys., 73, 1031-1066
- Fruscione et al. (2006) Fruscione, A. et al. 2006, SPIE Proc. 6270, 62701V
- Gaensler & Slane (2006) Gaensler, B. M. & Slane, P. O. 2006, ARA&A, 44, 17
- Grégoire & Knödlseder (2013) Grégoire, T. & Knödlseder, J. 2013, A&A, 554, 62
- Hinton & Hofmann (2009) Hinton, J. A. & Hofmann, W. 2009, ARA&A, 47, 523
- Ishisaki et al. (2009) Ishisaki, Y., et al. 2007, PASJ, 59, S113
- Kalberla et al. (2005) Kalberla, P. M. W. et al. 2005, A&A, 440, 775
- Kargaltsev & Pavlov (2010) Kargaltsev, O. & Pavlov, G. G. 2010, AIPC, 1248, 25
- Kulkarni (1982) Kulkarni, S. R. 1982, ApJL, 259, L63
- Lahav et al. (2000) Lahav, O. et al. 2000, MNRAS, 312, 166
- Liefke et al. (2010) Liefke, C., Fuhrmeister, B., Schmitt, J. H. M. M. 2010, A&A, 514, 94
- Matsumoto et al. (2014) Matsumoto, H. et al. 2014, proceedings of the conference Suzaku-MAXI 2014: Expanding the Frontiers of the X-ray Universe, 19-22 February, 2014 at Ehime University, Japan. Edited by M. Ishida, R. Petre, and K. Mitsuda, 2014., p.46, preprint: arXiv:1407.6454
- Mattana et al. (2009) Mattana, F. et al. 2009, ApJ, 694, 12
- Nolan et al. (2012) Nolan, P. L. et al. (Fermi-LAT collaboration) 2012, ApJS, 199, 31
- Predehl & Schmitt (1995) Predehl, P. & Schmitt, J. H. M. M. 1995, A&A, 293, 889
- Russeil (2003) Russeil, D. 2005, A&A, 397, 133-146
- Sakai (2013) Sakai, M. 2013, X-ray Studies of Unidentified Very High Energy Gamma-ray Sources, PhD thesis, Division of Particle and Astrophysical Science, Nagoya University
- Schlafly & Finkbeiner (2011) Schlafly, E. F. & Finkbeiner, D. P. 2011, ApJ, 737, 103
- Tawa et al. (2008) Tawa, N. et al., 2008, PASJ, 60, S11
- Tibolla et al. (2011) Tibolla, O. et al. 2011, Proceedings of the 32nd International Cosmic Ray Conference (ICRC2011), held 11-18 August, 2011 in Beijing, China. Vol. 6 OG1: Cosmic Ray Origin and Galactic Phenomena, edited by the Local Organizing Committee of ICRC 2011, p. 202
- Tibolla et al. (2012) Tibolla, O. et al. 2012, AIPC, 1505, 349
- Tibolla et al. (2014) Tibolla, O., Kaufmann, S., Kosack, K. 2014, A&A, 567, A74
- Torres et al. (2014) Torres, D. F. et al. 2014, JHEAp, 1, 31
- Trussoni et al. (1996) Trussoni, E. et al. 1996, A&A, 306, 581
- Uchiyama et al. (2008) Uchiyama, H. et al. 2008, PASJ, 60S, 35
- Uchiyama et al. (2009) Uchiyama, H. et al. 2009 PASJ, 61S, 189
- Valée (2005) Valée, J. P. 2005, AJ, 130, 569-575
- van den Berg (2010) van den Berg, M., 2010, ASPC, 435, 365
- Vorster et al. (2013) Vorster, M. J. et al. 2013, ApJ, 773, id139
- Weiler & Panagia (1978) Weiler, K. W. & Panagia, N. 1978, A&A, 70, 419
- Willingale et al. (2013) Willingale, R. et al. 2013, MNRAS, 431, 394
- Wilms et al. (2000) Wilms, J., Allen, A., McCray, R. 2000, ApJ, 542, 914
- Yusifov & Küçük (2004) Yusifov, I. & Küçük, I. 2004, A&A, 422, 545-553
- Zhang et al. (2008) Zhang, L., Chen, S. B. & Fang, J. 2008, ApJ, 676, 1210