Criticalities in the itinerant ferromagnet UGe2
Abstract
We provide a microscopic description of the magnetic properties of UGe2 and in particular, of its both classical and quantum critical behavior. Namely, we account for all the critical points: the critical ending point (CEP) at the metamagnetic phase transition, the tricritical point, and the quantum critical end point at the ferromagnetic to paramagnetic phase transition. Their position agrees quantitatively with experiment. Additionally, we predict that the metamagnetic CEP can be traced down to zero temperature and becomes quantum critical point by a small decrease of both the total electron concentration and the external pressure. The system properties are then determined by the quantum critical fluctuations appearing near the instability point of the Fermi surface topology.
pacs:
71.27.+a,75.30.Kz,71.10.-wIntroduction. Attempts to determine the quantum critical behavior and the corresponding critical points (QCPs) have attracted much attention due to the unique phenomena with singular physical properties associated with them as temperature and other parameters (pressure , applied field , or electron concentration ) are varied Löhneysen et al. (2007); Si et al. (2011); Ślebarski and Spałek (2005). Additionally, in the canonical case—the heavy fermion systems—unconventional superconductivity often appears near those QCPs making the quantum critical fluctuations the primary pairing inducing factor. Also, the classical critical points (CCPs) and their evolution towards QCP provide the testing ground for study of detailed quantitative behavior of different systems Pfleiderer (2009); Spalek et al. (1987); *SpalekPhysStatSol2006.
UGe2, in this respect, is one of the unique materials that exhibit all the above features. Therefore, the explanation of the magnetic phase diagram and intimately connected critical points within a single theoretical framework would provide a complete understanding of this remarkable quantum material Saxena et al. (2000); Pfleiderer and Huxley (2002); Pfleiderer (2009); Taufour et al. (2010); Kotegawa et al. (2011). The phase diagram on the pressure–temperature (–) plane comprises two ferromagnetic phases, of weaker (FM1) and stronger (FM2) magnetization, paramagnetic phase (PM), as well as the spin-triplet superconducting phase (SC) Saxena et al. (2000); Huxley et al. (2001); Pfleiderer (2009). SC disappears at the same pressure as FM Saxena et al. (2000) and the maximum of the superconducting critical temperature coincides with the critical pressure for the FM2-FM1 phase transition Pfleiderer and Huxley (2002). Thus, it is strongly suggestive that FM and SC are strongly intertwined as described by some theoretical approaches Kirkpatrick et al. (2001); Machida and Ohmi (2001); Abrikosov (2001); Sa (2002); Sandeman et al. (2003).
The -- phase diagram for UGe2 comprises the characteristic wing shape Taufour et al. (2010); Kotegawa et al. (2011). Such structure was theoretically obtained by Belitz et al. Belitz et al. (2005) within mean-field approach for a single-band itinerant ferromagnet. However, this approach cannot account for the two different ferromagnetic phases appearing in UGe2, as well as for the critical ending point (CEP), separating the region with a discontinuous drop in magnetization from a crossover regime Hardy et al. (2009); Taufour et al. (2010).
In this work we provide a quantitative microscopic description of all magnetic critical properties of UGe2 within the framework of the Anderson lattice model (ALM) treated by a modified Gutzwiller approach Wysokiński et al. (2014), called the statistically consistent Gutzwiller approximation (SGA) (for a description of the method and a detailed comparison to the slave-boson approach see Ref. Jędrak et al. ; for its applications, see Refs. Jędrak and Spałek (2011); *Kaczmarczyk2011; *Howczak2013; *Kadzielawa2013; *Abram2013; *Zegrodnik2013; *Wysokinski2014). Validity of this model in the context of UGe2 Wysokiński et al. (2014) is based on earlier results: first, on band structure calculations Shick and Pickett (2001); Samsel-Czekała et al. (2011) and second, on experimental observations Saxena et al. (2000); Tran et al. (2004); Pfleiderer (2009). The first feature is a quasi-two-dimensional topology of the Fermi surface (FS) Shick and Pickett (2001); Samsel-Czekała et al. (2011) which justifies calculations for a two-dimensional square lattice. On the other hand, despite the circumstance that the distance between uranium atoms is above the Hill limit Pfleiderer (2009), the experimental value of the paramagnetic moment per U atom is different from that for either or configurations Saxena et al. (2000); Kernavanois et al. (2001). This speaks for the presence of a sizable hybridization between the initially localized electrons and those from the conduction band. For strong enough hybridization, electrons contribute essentially to the heavy itinerant quasiparticle states and play a dominant role in the magnetic properties Saxena et al. (2000); Huxley et al. (2001); Kernavanois et al. (2001).
We provide a coherent explanation of FM and PM phase appearances as driven by a competition between the hybridization from one side and the – Coulomb local repulsive interaction from the other Wysokiński et al. (2014). Specifically, we obtain two different FM phases Doradziński and Spałek (1997, 1998); Sandeman et al. (2003); Howczak and Spałek (2012); Kubo (2013); Wysokiński et al. (2014) by varying the predetermined position of the chemical potential with respect to the peaks in the quasiparticle density of states (DOS) including the spin-split subbands. Although, Gutzwiller ansatz in certain regimes favors antiferromagnetism over FM Kotliar and Ruckenstein (1986); Dorin and Schlottmann (1992); Doradziński and Spałek (1997, 1998); Howczak and Spałek (2012), we restrict our discussion to the latter phase, because in the considered range of electron concentration, , FM phase turned out to have the lowest energy Doradziński and Spałek (1997, 1998).
In Fig. 1 we draw schematically the respective DOS for considered phases. It can be seen clearly that the shape of the FS (limiting the filled parts) will be vastly different in each of the phases. Within our approach, most of the properties of UGe2 at can be explained Wysokiński et al. (2014) in agreement with related experiments of magnetization Pfleiderer and Huxley (2002), neutron scattering Kernavanois et al. (2001); Huxley et al. (2001), and the de Haas–van Alphen oscillations Terashima et al. (2001); Settai et al. (2002). The character of the FM1 phase, which we obtain as a half-metallic type [cf. Fig. 1(b)], is also supported by the band-structure calculations Samsel-Czekała et al. (2011).

In the present work we extend our previous approach Wysokiński et al. (2014) to nonzero temperature and on this basis we determine the character of all phase transitions on the –– diagram of UGe2, as well as discuss the nature of all the classical and quantum critical points. We also show that by a small decrease of electron concentration (by ), the system can reach another quantum criticality via a metamagnetic transition upon changing the pressure. We also predict the corresponding change in FS topology distinguishing the two phases of significantly different magnetic susceptibility.
Model. We start from ALM with the Zeeman term included () in the Hamiltonian
| (1) |
which comprises dispersive conduction () band electrons and electrons coming from atomic -shell located at . In the model we include specifically the nearest () and the second nearest () neighbor hopping amplitudes between electrons, level at , sizable – Coulomb repulsion , and the – hybridization of the on-site form.
To obtain an effective single particle picture from the many-body Hamiltonian (1) we use the extended Gutzwiller approximation (GA) called the SGA (for details see Jędrak et al. ). The method was successfully applied to a number of problems Jędrak and Spałek (2011); *Kaczmarczyk2011; *Howczak2013; *Kadzielawa2013; *Abram2013; *Zegrodnik2013; *Wysokinski2014. Formally, we add to the effective Hamiltonian obtained in GA Rice and Ueda (1985); Fazekas and Brandow (1987), , additional constraints on the number of electrons and their magnetization by means of the Lagrange multipliers. It leads to the new effective Hamiltonian of the form,
| (2) |
where . Furthermore, is the hybridization narrowing factor in the standard form Wysokiński et al. (2014); Wysokiński and Spałek (2014), and is a number of lattice sites.
At nonzero temperature, one needs to minimize the generalized Landau grand potential functional
| (3) |
where are four eigenvalues of the effective Hamiltonian (2) labeled with the spin () and band () indices. and are the Lagrange multipliers assuring the correct statistical consistency of equations for and and play the role of correlation-induced effective fields Wysokiński and Spałek (2014). Minimization of is carried out with respect to the set of all parameters . Additionally, as the number of particles in the system is conserved we have to determine the chemical potential and adjust it to each of the phases according to the condition , with being the Fermi-Dirac function. In effect, the model is described by set of six algebraic equations which are solved with the help of the GSL library, with typical accuracy .
The Landau grand-potential functional for the equilibrium values of the parameters, , has the meaning of the physical grand-potential which is the proper quantity for studying the system at any temperature, . Therefore, the free energy of the system is defined by and the ground-state energy is .
Results. We assume that the main effect of the applied pressure is emulated by an increase of the hybridization amplitude , even though other parameters (e.g., ) may also change. However, as our previous results indicate, hybridization change is the principal factor of the pressure dependencies observed in UGe2 Wysokiński et al. (2014).
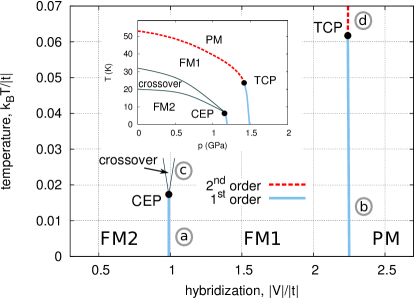
In Fig. 2 we plot the phase diagram on the – plane. In the low- regime we are able to reproduce the correct evolution of both metamagnetic (left) and ferromagnetic to paramagnetic (right) phase transitions observed in experiment (cf. inset), together with the respective critical behavior Pfleiderer and Huxley (2002); Hardy et al. (2009); Taufour et al. (2010); Kotegawa et al. (2011). The position of the classical critical points (CCPs) is very sensitive to the selected total band filling, . Our fitting constraint is the ratio of the corresponding critical temperatures, Taufour et al. (2010). Consequently, for the band filling , selected in our previous analysis at Wysokiński et al. (2014), we obtain agreement of our calculated ratio under the proviso that experimental values of the critical temperatures are determined with accuracy .
Our model does not account for correct curvatures of phase transitions above CCPs (cf. Fig. 2). This discrepancy can be attributed to the fact that also other microscopic parameters can alter when applying pressure, e.g. , and to additional entropic factors important in the case of Gutzwiller projection Wang et al. (2010); Sandri et al. (2013).
In our calculations we have used reduced temperature . We rescale it to the physical units by relating it to the experimentally measured values at CCPs Pfleiderer and Huxley (2002); Hardy et al. (2009); Taufour et al. (2010); Kotegawa et al. (2011). Accordingly, we also rescale the reduced field to Tesla units.
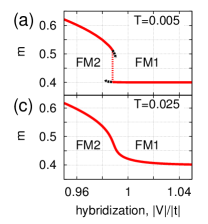
At the metamagnetic (FM2-FM1) phase transition we obtain CEP separating the discontinuous-transition line from the crossover regime. At low T both solutions with the weaker and the stronger magnetization coexist in the limited range of the hybridization strength [cf. Fig. 2a]. As the system approaches the transition from the FM1 side, FS changes drastically only in one spin-subband, in which the chemical potential crosses the hybridization gap, resulting also in a discontinuous jump of the total moment . With the increasing temperature, the edges of the gap are gradually smeared out. This leads to a deviation from the pure half-metallic type of the FM1 phase. The magnetization is bending towards the trend observed in the FM2 phase, and eventually at CEP it is changing to a crossover line [cf. Fig. 2(c)].
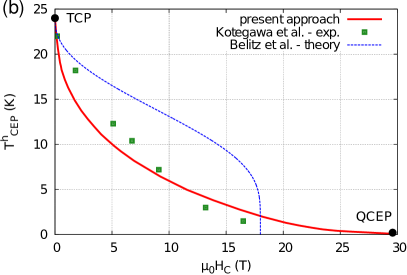
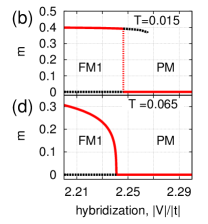
In the case of FM to PM transition the situation is different [cf. Figs. 2(b), and 2(d)]. At low temperature, the magnetization of this half-metallic FM1 phase discontinuously drops to zero (cf. Fig. 2b). However, with the increasing temperature, the ferromagnetic solution departs from a sharp half-metallic type and slowly bends over towards the paramagnetic solution, eventually reaching the critical point by changing the transition character to that of second order [cf. Fig. 2(d)]. The just described critical point is of tricritical character (TCP). This is because its evolution can be followed by applying the magnetic field down to , where it turns into the quantum critical ending point (QCEP) (cf. Fig. 3a). In this manner, we have achieved a full characteristic at the wing-shape –– phase diagram Taufour et al. (2010); Kotegawa et al. (2011). As the detailed form of the hybridization change with applied pressure is unknown, and in principle non-linear, we compare our predicted shape of wings by tracing the evolution of CEP on the temperature—magnetic field – plane [cf. Fig. 3(b)] and comparing it to the experimental data Kotegawa et al. (2011). We obtain a satisfactory quantitative agreement with the experimental points, as well as recover its proper curvature. For comparison, the results from the mean-field approach to the single-band case by Belitz et al. Belitz et al. (2005) are also drawn, as is universal explanation of tricritical behavior of itinerant ferromagnets. Nevertheless, as suggested by the authors in Ref. Kotegawa et al. (2011), the crucial element determining for UGe2 the correct shape of the wings is the change of FS, present in our two-band ALM model. We also predict that the curve of the vs dependence has a longer tail than that estimated in Ref. Kotegawa et al. (2011), i.e., that QCEP should be located at fields around T. Our estimate thus calls for a more precise determination of the QCEP position.
In fitting to the data in Fig. 3 we have assumed that the -factor for electrons (the same as for electrons). This assumption is based on the presumption that for itinerant electrons the crystal-field multiplet structure is washed out. Parenthetically, taking significantly different provides a worse agreement, but the curvature character remains unchanged.
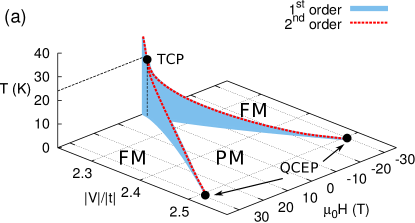
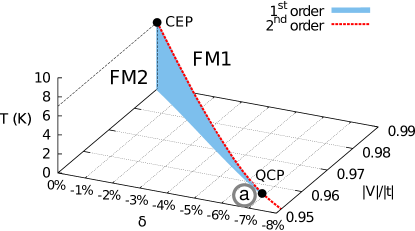
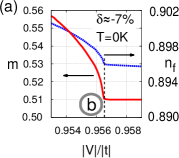
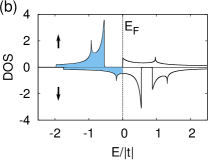
In Fig. 4 we draw the evolution of CEP at the metamagnetic transition with the decrease of both the hybridization and the electron concentration. The latter quantity is characterized by the parameter , where is initial and is the actual concentration. On the –– phase diagram the CEP can be followed down to zero temperature, where it joins the second-order transition line [cf. Fig. 4(a)]. At this second order transition the Fermi level for the majority spin subband is exactly at the border of the gap [cf. Fig. 4(b)]. It means that along this line quantum critical fluctuations of FS topology are present. In other terms, we have a strong indication that in the vicinity of the SC dome maximum this compound exhibits a Lifshitz type of quantum critical behavior. This quantum critical transition can be associated also with the specific valence change [cf. Fig. 4(a)]. However, here the average electron number changes continuously in contrast to the discontinuous drop originating from the – electron repulsion Miyake and Watanabe (2014). The difference in the origin of Lifshitz type of ferromagnetic QCP with respect to that considered before Roussev and Millis (2001); Fay and Appel (1980) is that here it results from the two-band model and separates different FM phases.
Summary. We have described the phase diagram of UGe2 at nonzero temperature and have determined the location of the critical points, as well as proposed an additional quantum critical point for UGe2. With the help of the Anderson lattice model we are able to reproduce quantitatively all the principal features of the magnetism in this compound. We also have determined the location of experimentally observed critical and quantum critical points, together with a correct order of the phase transitions related to them.
Although our mean-field approach seems to capture all the features concerning details of the -- phase diagram of UGe2, we should note that, in principle, fluctuations of order parameters can bring a quantitative changes to our results. However, as the phase transitions are induced by the drastic changes of the Fermi surface, the effect of the fluctuations should be minor (except near the predicted QCP—cf. Fig.4) and may lead to a correction of the CEP and TCP positions.
It should be noted that we have employed an orbitally nondegenerate ALM. Accounting for the degenerate one would imply inclusion of the residual Hund’s rule interaction present in the degenerate ALM model which could be important in inducing the spin-triplet pairing Zegrodnik et al. (2014); *Zegrodnik2013JPCM.
Acknowledgments. The work was partly supported by the Foundation for Polish Science (FNP) under the Grant TEAM and partly by the National Science Centre (NCN) under the MAESTRO, Grant No. DEC-2012/04/A/ST3/00342. Access to the supercomputer located at Academic Centre for Materials and Nanotechnology of the AGH University of Science and Technology in Kraków is also acknowledged.
References
- Löhneysen et al. (2007) H. v. Löhneysen, A. Rosch, M. Vojta, and P. Wölfle, Rev. Mod. Phys. 79, 1015 (2007).
- Si et al. (2011) Q. Si, P. Gegenwart, and F. Steglich, “Understanding Quantum Phase Transitions,” (CRC Press, Boca Raton, edited by L. D. Carr, 2011) Chap. 8, 18, pp. 193–216, 445–468.
- Ślebarski and Spałek (2005) A. Ślebarski and J. Spałek, Phys. Rev. Lett. 95, 046402 (2005).
- Pfleiderer (2009) C. Pfleiderer, Rev. Mod. Phys. 81, 1551 (2009), (chapter III. A).
- Spalek et al. (1987) J. Spalek, A. Datta, and J. M. Honig, Phys. Rev. Lett. 59, 728 (1987).
- Spałek (2006) J. Spałek, physica status solidi (b) 243, 78 (2006).
- Saxena et al. (2000) S. S. Saxena, P. Agarwal, K. Ahilan, F. M. Grosche, R. K. W. Haselwimmer, M. J. Steiner, E. Pugh, I. R. Walker, S. R. Julian, P. Monthoux, G. G. Lonzarich, A. Huxley, I. Sheikin, D. Braithwaite, and J. Flouquet, Nature 406, 587 (2000).
- Pfleiderer and Huxley (2002) C. Pfleiderer and A. D. Huxley, Phys. Rev. Lett. 89, 147005 (2002).
- Taufour et al. (2010) V. Taufour, D. Aoki, G. Knebel, and J. Flouquet, Phys. Rev. Lett. 105, 217201 (2010).
- Kotegawa et al. (2011) H. Kotegawa, V. Taufour, D. Aoki, G. Knebel, and J. Flouquet, J. Phys. Soc. Jpn. 80, 083703 (2011).
- Huxley et al. (2001) A. Huxley, I. Sheikin, E. Ressouche, N. Kernavanois, D. Braithwaite, R. Calemczuk, and J. Flouquet, Phys. Rev. B 63, 144519 (2001).
- Kirkpatrick et al. (2001) T. R. Kirkpatrick, D. Belitz, T. Vojta, and R. Narayanan, Phys. Rev. Lett. 87, 127003 (2001).
- Machida and Ohmi (2001) K. Machida and T. Ohmi, Phys. Rev. Lett. 86, 850 (2001).
- Abrikosov (2001) A. A. Abrikosov, J. Phys: Condens. Matter 13, L943 (2001).
- Sa (2002) D. Sa, Phys. Rev. B 66, 140505 (2002).
- Sandeman et al. (2003) K. G. Sandeman, G. G. Lonzarich, and A. J. Schofield, Phys. Rev. Lett. 90, 167005 (2003).
- Belitz et al. (2005) D. Belitz, T. R. Kirkpatrick, and J. Rollbühler, Phys. Rev. Lett. 94, 247205 (2005).
- Hardy et al. (2009) F. Hardy, C. Meingast, V. Taufour, J. Flouquet, H. v. Löhneysen, R. A. Fisher, N. E. Phillips, A. Huxley, and J. C. Lashley, Phys. Rev. B 80, 174521 (2009).
- Wysokiński et al. (2014) M. M. Wysokiński, M. Abram, and J. Spałek, Phys. Rev. B 90, 081114(R) (2014).
- (20) J. Jędrak, J. Kaczmarczyk, and J. Spałek, arXiv:1008.0021 .
- Jędrak and Spałek (2011) J. Jędrak and J. Spałek, Phys. Rev. B 83, 104512 (2011).
- Kaczmarczyk and Spałek (2011) J. Kaczmarczyk and J. Spałek, Phys. Rev. B 84, 125140 (2011).
- Howczak et al. (2013) O. Howczak, J. Kaczmarczyk, and J. Spałek, Phys. Stat. Solidi (b) 250, 609 (2013).
- Kądzielawa et al. (2013) A. P. Kądzielawa, J. Spałek, J. Kurzyk, and W. Wójcik, Eur. Phys. J. B 86, 252 (2013).
- Abram et al. (2013) M. Abram, J. Kaczmarczyk, J. Jędrak, and J. Spałek, Phys. Rev. B 88, 094502 (2013).
- Zegrodnik et al. (2013) M. Zegrodnik, J. Spałek, and J. Bünemann, New J. Phys. 15, 073050 (2013).
- Wysokiński and Spałek (2014) M. M. Wysokiński and J. Spałek, J. Phys.: Condens. Matter 26, 055601 (2014).
- Shick and Pickett (2001) A. B. Shick and W. E. Pickett, Phys. Rev. Lett. 86, 300 (2001).
- Samsel-Czekała et al. (2011) M. Samsel-Czekała, M. Werwiński, A. Szajek, G. Chełkowska, and R. Troć, Intermetallics 19, 1411 (2011).
- Tran et al. (2004) V. H. Tran, S. Paschen, R. Troć, M. Baenitz, and F. Steglich, Phys. Rev. B 69, 195314 (2004).
- Kernavanois et al. (2001) N. Kernavanois, B. Grenier, A. Huxley, E. Ressouche, J. P. Sanchez, and J. Flouquet, Phys. Rev. B 64, 174509 (2001).
- Doradziński and Spałek (1997) R. Doradziński and J. Spałek, Phys. Rev. B 56, R14239 (1997).
- Doradziński and Spałek (1998) R. Doradziński and J. Spałek, Phys. Rev. B 58, 3293 (1998).
- Howczak and Spałek (2012) O. Howczak and J. Spałek, J. Phys: Condens. Matter 24, 205602 (2012).
- Kubo (2013) K. Kubo, Phys. Rev. B 87, 195127 (2013).
- Kotliar and Ruckenstein (1986) G. Kotliar and A. E. Ruckenstein, Phys. Rev. Lett. 57, 1362 (1986).
- Dorin and Schlottmann (1992) V. Dorin and P. Schlottmann, Phys. Rev. B 46, 10800 (1992).
- Terashima et al. (2001) T. Terashima, T. Matsumoto, C. Terakura, S. Uji, N. Kimura, M. Endo, T. Komatsubara, and H. Aoki, Phys. Rev. Lett. 87, 166401 (2001).
- Settai et al. (2002) R. Settai, M. Nakashima, S. Araki, Y. Haga, T. C. Kobayashi, N. Tateiwa, H. Yamagami, and Y. Onuki, J. Phys: Condens. Matter 14, L29 (2002).
- Rice and Ueda (1985) T. M. Rice and K. Ueda, Phys. Rev. Lett. 55, 995 (1985).
- Fazekas and Brandow (1987) P. Fazekas and B. H. Brandow, Phys. Scr. 36, 809 (1987).
- Wang et al. (2010) W.-S. Wang, X.-M. He, D. Wang, Q.-H. Wang, Z. D. Wang, and F. C. Zhang, Phys. Rev. B 82, 125105 (2010).
- Sandri et al. (2013) M. Sandri, M. Capone, and M. Fabrizio, Phys. Rev. B 87, 205108 (2013).
- Miyake and Watanabe (2014) K. Miyake and S. Watanabe, J. Phys. Soc. Jpn. 83, 061006 (2014).
- Roussev and Millis (2001) R. Roussev and A. J. Millis, Phys. Rev. B 63, 140504 (2001).
- Fay and Appel (1980) D. Fay and J. Appel, Phys. Rev. B 22, 3173 (1980).
- Zegrodnik et al. (2014) M. Zegrodnik, J. Bünemann, and J. Spałek, New J. Phys. 16, 033001 (2014).
- Spałek and Zegrodnik (2013) J. Spałek and M. Zegrodnik, J. Phys.: Condens. Matter 25, 435601 (2013).