Observation of the critical end point in the phase diagram for
hot and dense nuclear matter
Abstract
Excitation functions for the Gaussian emission source radii difference () obtained from two-pion interferometry measurements in Au+Au ( GeV) and Pb+Pb ( TeV) collisions, are studied for a broad range of collision centralities. The observed non-monotonic excitation functions validate the finite-size scaling patterns expected for the deconfinement phase transition and the critical end point (CEP), in the temperature vs. baryon chemical potential () plane of the nuclear matter phase diagram. A Finite-Size Scaling (FSS) analysis of these data indicate a second order phase transition with the estimates MeV and MeV for the location of the critical end point. The critical exponents ( and ) extracted via the same FSS analysis, places the CEP in the 3D Ising model universality class.
pacs:
25.75.DwOne of the most fundamental phase transitions is that between the hadron gas and the Quark Gluon Plasma (QGP). This Deconfinement Phase Transition (DPT) is usually depicted in the plane of temperature vs. baryon chemical potential () in the conjectured phase diagram for Quantum Chromodynamics (QCD) Itoh (1970); Shuryak (1983); Asakawa and Yazaki (1989); Stephanov et al. (1998). The detailed character of this QCD phase diagram is not known and current theoretical knowledge is restricted primarily to the axis.
Lattice QCD calculations indicate a crossover quark-hadron transition at small or high collision energies () Aoki et al. (2006); Bhattacharya et al. (2014). Similar calculations for much larger values have been hindered by the well known sign problem de Forcrand (2009). However, several model approaches Berges and Rajagopal (1999); Hatta and Ikeda (2003); Stephanov (2004); Asakawa and Nonaka (2006); Ejiri (2008), as well as mathematical extensions of lattice techniques Fodor and Katz (2004); Li et al. (2011); Nagata et al. (2014); de Forcrand et al. (2014), indicate that the transition at larger values of (lower beam energies che ) is strongly first order, suggesting the existence of a critical end point (CEP). Pinpointing the location of the phase boundaries and the CEP is central to ongoing efforts to map the QCD phase diagram and to understand the properties of strongly interacting matter under extreme conditions.
The matter produced in ultrarelativistic heavy ion collisions can serve as an important probe for the phase boundaries and the CEP Itoh (1970); Shuryak (1983); Asakawa and Yazaki (1989); Stephanov et al. (1998). Indeed, a current experimental strategy at the Relativistic Heavy Ion Collider (RHIC) is centered on beam energy scans which enable a search for non-monotonic excitation functions over a broad domain of the ()-plane. The rationale is that the expansion dynamics of the matter produced in these beam energy scans, is strongly influenced by the path of the associated reaction trajectories in the ()-plane. Trajectories which are close to the CEP or cross the coexistence curve for the first order phase transition, are expected to be influenced by anomalies in the dynamic properties of the medium. Such anomalies can drive abrupt changes in the transport coefficients and relaxation rates to give a non-monotonic dependence of the excitation function for the specific viscosity i.e. the ratio of the shear viscosity to entropy density Lacey et al. (2007a); Csernai et al. (2006); Lacey et al. (2007b).
An emitting system produced in the vicinity of the CEP would also be subject to the influence of a divergence in the compressibility of the medium, resulting in a precipitous drop in the sound speed and a collateral increase in the emission duration. Such effects could also give rise to non-monotonic dependencies in the excitation functions for the expansion speed Hung and Shuryak (1995); Rischke and Gyulassy (1996), as well as for the difference between the Gaussian emission source radii () extracted from two-pion interferometry measurements Pratt (1984); Hung and Shuryak (1995); Chapman et al. (1995); Wiedemann et al. (1996); Rischke and Gyulassy (1996). The latter is linked to the emission duration.
In recent work Lacey et al. (2014); Lacey (2014), a striking pattern of viscous damping, compatible with the expected minimum in the excitation function for Csernai et al. (2006); Lacey et al. (2007b) was reported for Au+Au ( GeV) and Pb+Pb ( TeV) collisions. An excitation function for () extracted for central collisions from the same data sets, also indicated a striking non-monotonic pattern attributed to decay trajectories close to the CEP Lacey (2014); Adare et al. (2014). Nonetheless, it remains a crucial open question as to whether these non-monotonic patterns are indeed linked to the deconfinement phase transition and the CEP?
In the limit of an infinite volume, the deconfinement phase transition is characterized by singularities which reflect the divergences in the derivatives of the thermodynamic potential, eg., the specific heat and various susceptibilities (). Discontinuities in the first and second derivatives signal the first order and second order phase transitions respectively. These singularities are smeared into finite peaks with modified positions and widths, for more restricted volumes Ladrem and Ait-El-Djoudi (2005); Palhares et al. (2011).
The correlation length diverges near the transition temperature () as for an infinite volume; . However, for a system of size ( is the dimension) this second order phase transition is expected to show a pseudocritical point for correlation length . This leads to a characteristic power law volume (V) dependence of the magnitude (), width () and peak position () of the susceptibility Ladrem and Ait-El-Djoudi (2005);
| (1) | |||
| (2) | |||
| (3) |
where and are critical exponents which characterize the divergence of and respectively. The reduction of the magnitude of ( ), broadening of the transition region () and the shift of () increases as the volume decreases. A similar set of volume or finite-size dependencies is expected for the first order phase transition, but with unit magnitudes for the critical exponents Ladrem and Ait-El-Djoudi (2005). Thus, a profitable route for locating the CEP is to search for, and utilize the characteristic finite-size scaling patterns associated with the deconfinement phase transition Ladrem and Ait-El-Djoudi (2005); Palhares et al. (2011).
In this Letter, we use the Gaussian radii ( and ) extracted from two-pion interferometry measurements, to first construct non-monotonic excitation functions for () as a function of collision centrality. We then use them to perform validation tests for the characteristic finite-size scaling patterns commonly associated with the deconfinement phase transition and the CEP. We find clear evidence for these scaling properties and use a Finite-Size Scaling (FSS) analysis to extract initial estimates for the () location of the CEP and the critical exponents associated with it.
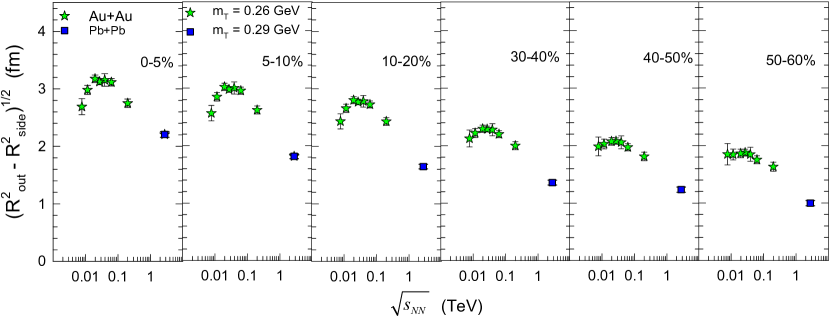
The data employed in the present analysis are taken from interferometry measurements by the STAR collaborations for Au+Au collisions spanning the range GeV Adamczyk et al. (2014), and by the ALICE collaboration for Pb+Pb collisions at = 2.76 TeV Aamodt et al. (2011); Kisiel (2011). The STAR measurements have been reported to be in very good agreement with similar PHENIX measurements obtained at and GeV Lacey (2014); Adare et al. (2014). The systematic uncertainties for these measurements are also reported to be relatively small Adamczyk et al. (2014); Aamodt et al. (2011); Kisiel (2011); Adare et al. (2014).
The geometric quantities employed in our Finite-Size Scaling analysis were obtained from a Monte Carlo Glauber (MC-Glauber) calculation Miller et al. (2007); Lacey et al. (2011); Adare et al. (2013), performed for several collision centralities at each beam energy. In each of these calculations, a subset of the nucleons become participants () in each collision by undergoing an initial inelastic N+N interaction. The transverse distribution of these participants in the X-Y plane has RMS widths and along its principal axes. We define and compute , the characteristic initial transverse size, as Bhalerao et al. (2005). The systematic uncertainties for , obtained via variation of the model parameters, are less than 10% Lacey et al. (2011); Adare et al. (2013).
Figure 1 shows a representative set of excitation functions for , obtained for the broad selection of centrality cuts indicated. These excitation functions, which are linked to the compressibility of the medium, all show the non-monotonic dependence previously conjectured to reflect reaction trajectories close to the critical end point Lacey (2014); Adare et al. (2014). They also exhibit several characteristic trends: (i) the magnitude of the peaks decrease with increasing centrality or decreasing transverse size, (ii) the positions of the peaks shift to lower values of with an increase in centrality and (iii) the width of the distributions grow with centrality. These trends are made more transparent in Fig. 2 where a direct comparison of the excitation functions for is shown. We attribute these qualitative patterns to the finite-size scaling effects expected for the deconfinement phase transition (cf. Eqs. 1 - 3) and employ the excitation functions in a more quantitative Finite-Size Scaling (FSS) analysis as discussed below.
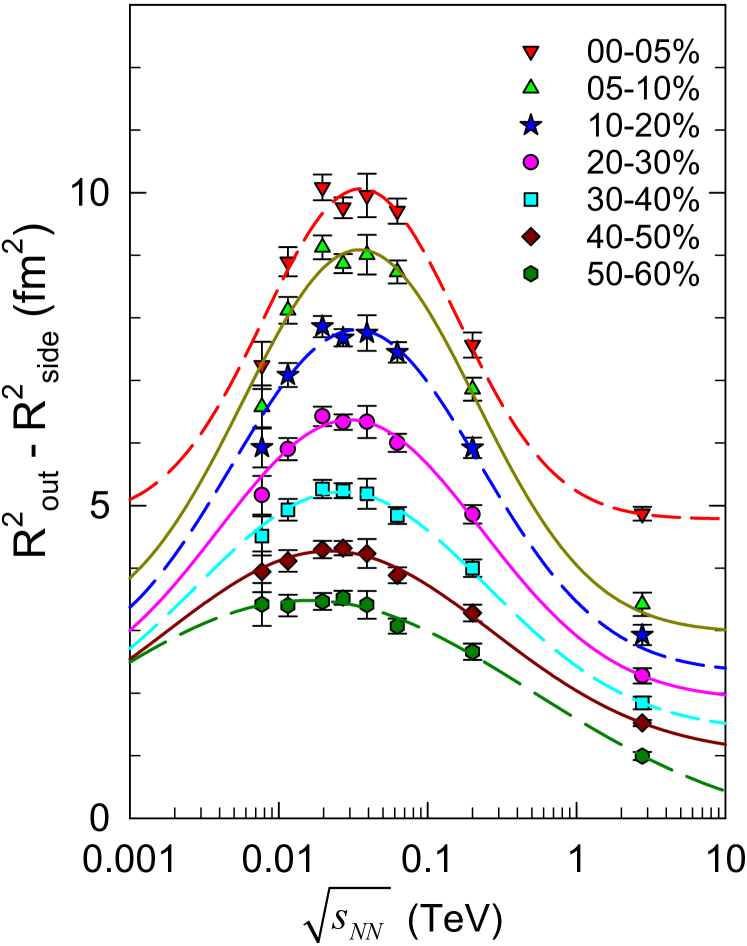
Validation tests for finite-size scaling were carried out for the full set of excitation functions as follows. First, we exploit the phenomenology of thermal models Cleymans et al. (2006); Andronic et al. (2009); Becattini et al. (2012); Tawfik (2014) for the freeze-out region and associate () combinations with . Second, we associate with a susceptibility, given its connection to the compressibility. Subsequently, a Guassian fit was used to extract the peak positions, heights and widths of the excitation functions, for different system sizes characterized by the centrality selections indicated in Fig. 2. The solid and dashed curves shown in the figure gives an indication of the quality of these fits.
The extracted fit parameters were tested for the characteristic finite-size scaling patterns associated with the deconfinement phase transition via Eqs. 1 and 3 with ;
| (4) | |||
| (5) |
with the aim of obtaining initial estimates for the critical exponents and and the value where the deconfinement phase transition first occurs; is constant.
Figure 3 illustrates the finite-size scaling test made for the extracted peak positions (). Panel (a) shows the peak positions vs. while panel (b) shows the same peak positions vs. . The dashed curve in (b), which represents a fit to the data in (a) with Eq. 5, confirms the expected inverse power law dependence of these peaks on . The fit gives the values GeV and . Note that this value of is compatible with the striking pattern observed in the excitation function for viscous damping Lacey et al. (2014); Lacey (2014). This pattern is akin to that expected for close to the CEP Csernai et al. (2006); Lacey et al. (2007b).
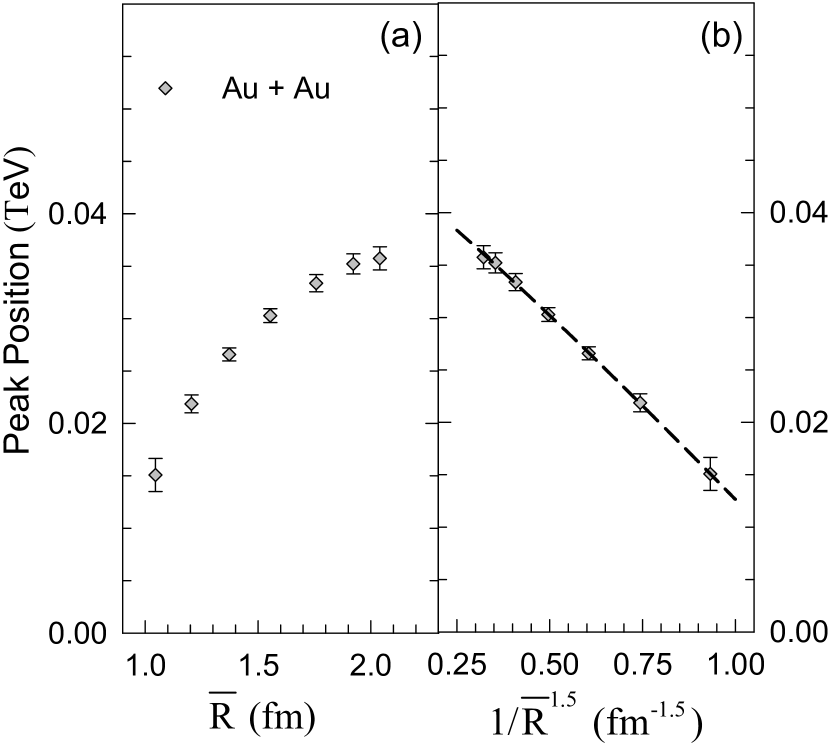
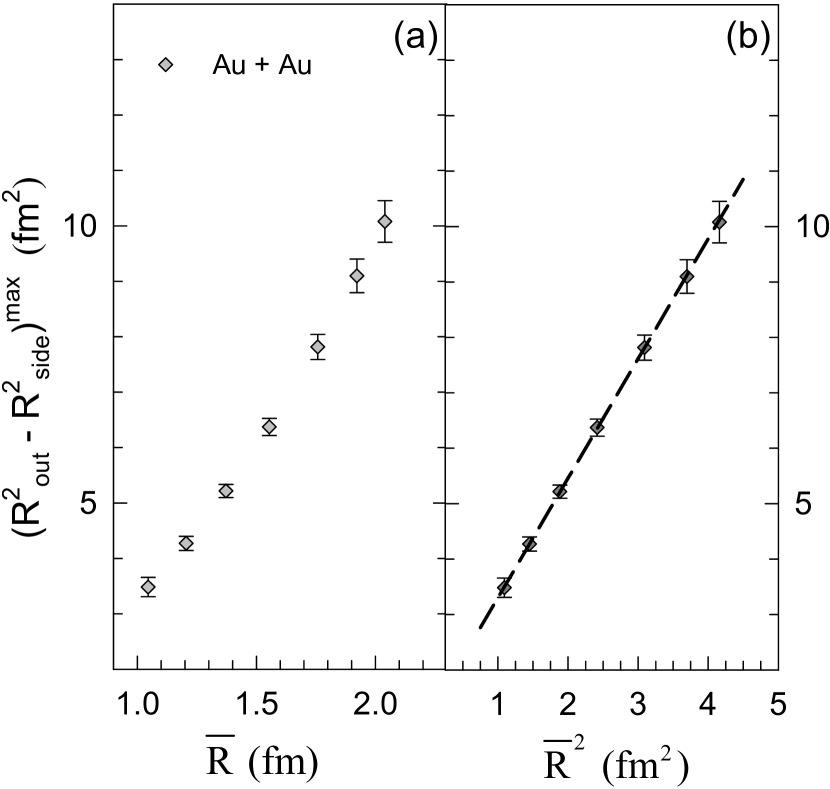
Figure 4 illustrates the results of the finite-size scaling test for . Panel (a) shows vs. while panel (b) shows the same data plotted vs. . The dashed curve in (b), which represents a fit to the data in (a) with Eq. 4, confirms the expected power law dependence of on . Note that the trend of this dependence is opposite to the inverse power dependence shown in Fig. 3. The fit leads to the estimate .
The magnitudes of the extracted values for the critical exponents and , are different from the unit values expected for a first order phase transition Ladrem and Ait-El-Djoudi (2005). However, they are compatible with the critical exponents for the second order deconfinement phase transition for the 3D Ising model universality class Andrea Pelissetto (2002); Kleinert (1999). Consequently, we assign the location of the CEP to the extracted value GeV and use the parametrization for chemical freeze-out in Ref. Cleymans et al. (2006) to obtain the estimates MeV and MeV for its location in the ()-plane.
A crucial crosscheck for the location of the CEP and its associated critical exponents, is the requirement that finite-size scaling for different transverse sizes, should lead to data collapse onto a single curve for robust values of , and the critical exponents and ;
where and are the reduced temperature and baryon chemical potential respectively.
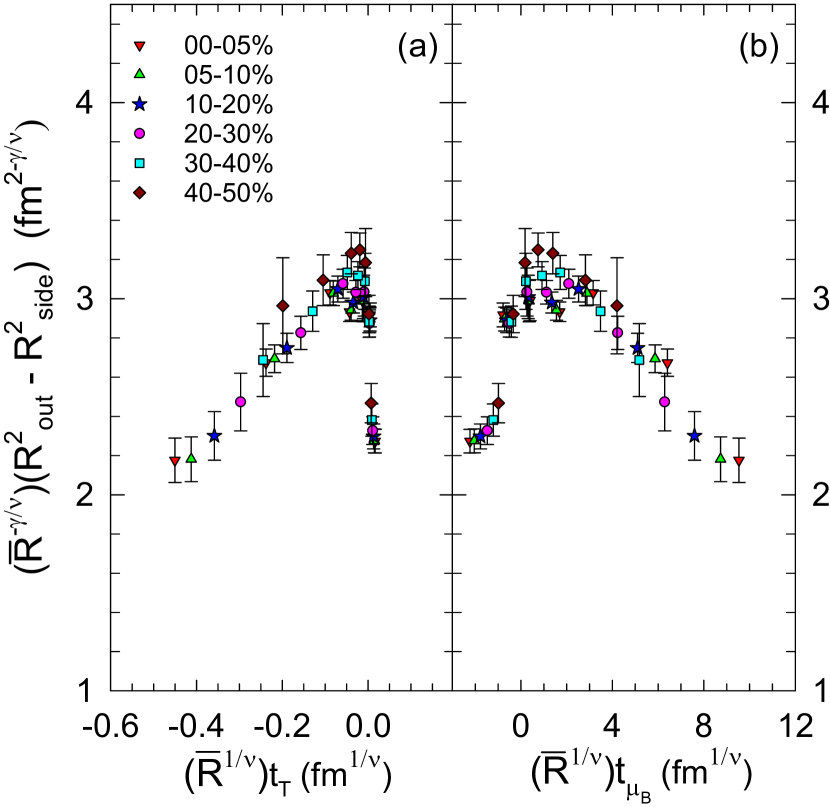
The validation of this crosscheck is illustrated in Fig. 5 where data collapse onto a single curve is indicated for the RHIC excitation functions shown in Fig. 2. The parametrization for chemical freeze-out Cleymans et al. (2006) is used in conjunction with and to determine the required and values from the values plotted in Fig. 2. Figs. 5(a) and (b) also validate the expected trends for reaction trajectories in the () domain which encompass the CEP. That is, the scaled values of peaks at and , and show the collateral fall-off for and .
In summary, we have investigated the centrality dependent excitation functions for the Gaussian emission source radii difference (), obtained from two-pion interferometry measurements in Au+Au ( GeV) and Pb+Pb ( TeV) collisions, to search for the CEP in the nuclear matter phase diagram. The observed centrality dependent non-monotonic excitation functions, validate the characteristic finite-size scaling patterns expected for the deconfinement phase transition and the critical end point. An initial Finite-Size Scaling analysis of these data suggest a second order phase transition with MeV and MeV for the location of the critical end point. The critical exponents ( and ) extracted in the same FSS analysis, places the CEP in the 3D Ising model universality class. Further detailed studies at RHIC are crucial to make a more precise determination of the location of the CEP and the associated critical exponents, as well as to confirm these observations for other collision systems.
Acknowledgments
The author thanks J. Jia, E. Fraga, B. Schenke and R. Venugopalan for valuable discussions, and for pointing out several important references. This research is supported by the US DOE under contract DE-FG02-87ER40331.A008.
References
- Itoh (1970) N. Itoh, Prog. Theor. Phys. 44, 291 (1970).
- Shuryak (1983) E. V. Shuryak, CERN-83-01 (1983).
- Asakawa and Yazaki (1989) M. Asakawa and K. Yazaki, Nucl. Phys. A504, 668 (1989).
- Stephanov et al. (1998) M. A. Stephanov, K. Rajagopal, and E. V. Shuryak, Phys. Rev. Lett. 81, 4816 (1998), eprint hep-ph/9806219.
- Aoki et al. (2006) Y. Aoki, G. Endrodi, Z. Fodor, S. Katz, and K. Szabo, Nature 443, 675 (2006), eprint hep-lat/0611014.
- Bhattacharya et al. (2014) T. Bhattacharya, M. I. Buchoff, N. H. Christ, H. T. Ding, R. Gupta, et al., Phys.Rev.Lett. 113, 082001 (2014), eprint 1402.5175.
- de Forcrand (2009) P. de Forcrand, PoS LAT2009, 010 (2009), eprint 1005.0539.
- Berges and Rajagopal (1999) J. Berges and K. Rajagopal, Nucl.Phys. B538, 215 (1999), eprint hep-ph/9804233.
- Hatta and Ikeda (2003) Y. Hatta and T. Ikeda, Phys.Rev. D67, 014028 (2003), eprint hep-ph/0210284.
- Stephanov (2004) M. A. Stephanov, Prog.Theor.Phys.Suppl. 153, 139 (2004), eprint hep-ph/0402115.
- Asakawa and Nonaka (2006) M. Asakawa and C. Nonaka, Nucl.Phys. A774, 753 (2006), eprint nucl-th/0509091.
- Ejiri (2008) S. Ejiri, Phys.Rev. D78, 074507 (2008), eprint 0804.3227.
- Fodor and Katz (2004) Z. Fodor and S. Katz, JHEP 0404, 050 (2004), eprint hep-lat/0402006.
- Li et al. (2011) A. Li, A. Alexandru, and K.-F. Liu, Phys.Rev. D84, 071503 (2011), eprint 1103.3045.
- Nagata et al. (2014) K. Nagata, K. Kashiwa, A. Nakamura, and S. M. Nishigaki (2014), eprint 1410.0783.
- de Forcrand et al. (2014) P. de Forcrand, J. Langelage, O. Philipsen, and W. Unger, Phys.Rev.Lett. 113, 152002 (2014), eprint 1406.4397.
- (17) The baryon chemical potential increases with the decrease in the beam energy while the chemical freeze-out temperature increases with increase in beam energy Cleymans et al. (2006).
- Lacey et al. (2007a) R. A. Lacey, N. Ajitanand, J. Alexander, P. Chung, W. Holzmann, et al., Phys.Rev.Lett. 98, 092301 (2007a), eprint nucl-ex/0609025.
- Csernai et al. (2006) L. P. Csernai, J. Kapusta, and L. D. McLerran, Phys.Rev.Lett. 97, 152303 (2006), eprint nucl-th/0604032.
- Lacey et al. (2007b) R. A. Lacey et al. (2007b), eprint 0708.3512.
- Hung and Shuryak (1995) C. Hung and E. V. Shuryak, Phys.Rev.Lett. 75, 4003 (1995), eprint hep-ph/9412360.
- Rischke and Gyulassy (1996) D. H. Rischke and M. Gyulassy, Nucl.Phys. A608, 479 (1996), eprint nucl-th/9606039.
- Pratt (1984) S. Pratt, Phys.Rev.Lett. 53, 1219 (1984).
- Chapman et al. (1995) S. Chapman, P. Scotto, and U. W. Heinz, Phys.Rev.Lett. 74, 4400 (1995), eprint hep-ph/9408207.
- Wiedemann et al. (1996) U. A. Wiedemann, P. Scotto, and U. W. Heinz, Phys.Rev. C53, 918 (1996), eprint nucl-th/9508040.
- Lacey et al. (2014) R. A. Lacey, A. Taranenko, J. Jia, D. Reynolds, N. Ajitanand, et al., Phys. Rev. Lett. 112, 082302 (2014).
- Lacey (2014) R. A. Lacey (2014), eprint 1408.1343.
- Adare et al. (2014) A. Adare et al. (PHENIX Collaboration) (2014), eprint 1410.2559.
- Adamczyk et al. (2014) L. Adamczyk et al. (STAR Collaboration) (2014), eprint 1403.4972.
- Aamodt et al. (2011) K. Aamodt et al. (ALICE Collaboration), Phys.Lett. B696, 328 (2011), eprint 1012.4035.
- Kisiel (2011) A. Kisiel (ALICE Collaboration), PoS WPCF2011, 003 (2011).
- Ladrem and Ait-El-Djoudi (2005) M. Ladrem and A. Ait-El-Djoudi, Eur.Phys.J. C44, 257 (2005), eprint hep-ph/0412407.
- Palhares et al. (2011) L. Palhares, E. Fraga, and T. Kodama, J.Phys. G38, 085101 (2011), eprint 0904.4830.
- Miller et al. (2007) M. L. Miller, K. Reygers, S. J. Sanders, and P. Steinberg, Ann. Rev. Nucl. Part. Sci. 57, 205 (2007).
- Lacey et al. (2011) R. A. Lacey, R. Wei, N. Ajitanand, and A. Taranenko, Phys.Rev. C83, 044902 (2011), eprint 1009.5230.
- Adare et al. (2013) A. Adare et al. (PHENIX Collaboration) (2013), eprint 1310.4793.
- Bhalerao et al. (2005) R. Bhalerao, J.-P. Blaizot, N. Borghini, and J.-Y. Ollitrault, Phys.Lett. B627, 49 (2005), eprint nucl-th/0508009.
- Cleymans et al. (2006) J. Cleymans, H. Oeschler, K. Redlich, and S. Wheaton, J.Phys. G32, S165 (2006), eprint hep-ph/0607164.
- Andronic et al. (2009) A. Andronic, P. Braun-Munzinger, and J. Stachel, Acta Phys.Polon. B40, 1005 (2009), eprint 0901.2909.
- Becattini et al. (2012) F. Becattini, M. Bleicher, T. Kollegger, M. Mitrovski, T. Schuster, et al., Phys.Rev. C85, 044921 (2012), eprint 1201.6349.
- Tawfik (2014) A. N. Tawfik, Int.J.Mod.Phys. A29, 1430021 (2014), eprint 1410.0372.
- Andrea Pelissetto (2002) E. V. Andrea Pelissetto, Phys.Rept. 368, 549 (2002), eprint 0012164.
- Kleinert (1999) H. Kleinert, Phys.Rev.D 60, 085001 (1999).