Measurement of the speed of sound by observation of the Mach cones in a complex plasma under microgravity conditions
Abstract
We report the first observation of the Mach cones excited by a larger microparticle (projectile) moving through a cloud of smaller microparticles (dust) in a complex plasma with neon as a buffer gas under microgravity conditions. A collective motion of the dust particles occurs as propagation of the contact discontinuity. The corresponding speed of sound was measured by a special method of the Mach cone visualization. The measurement results are incompatible with the theory of ion acoustic waves. The estimate for the pressure in a strongly coupled Coulomb system and a scaling law for the complex plasma make it possible to derive an evaluation for the speed of sound, which is in a reasonable agreement with the experiments in complex plasmas.
pacs:
52.27.Lw, 52.35.Dm, 47.40.-xI Introduction
Dusty or complex plasma is a low-temperature plasma, which includes dust particles with sizes ranging from to . Due to the higher electron mobility, particles acquire a considerable electric charge. Thus, a strongly coupled Coulomb system is formed.Fortov and Morfill (2009); Chu and Lin I (1994); Thomas et al. (1994); Hayashi and Tashibana (1994); Vladimirov et al. (2005); Fortov et al. (2005); Shukla and Eliasson (2009); Bonitz et al. (2010) In such plasma, various collective phenomena at the level of individual particles take place. Complex plasmas are usually studied in gas discharges at low pressures, e.g., in the radio frequency (RF) discharges. Under microgravity conditions, a large homogeneous bulk of the complex plasma can be observed. The particles form a nearly homogeneous cloud around the center of the chamber, typically with a central void caused by the ions streaming outwards. The microgravity conditions are realized either in parabolic flightsMorfill et al. (2006); Caliebe et al. (2011); Piel et al. (2008); Menzel et al. (2011); Arp et al. (2011) or onboard the International Space Station (ISS).Morfill et al. (2006); Schwabe et al. (2008); Morfill et al. (1999); Khrapak et al. (2011); Thomas et al. (2008); Jiang et al. (2009); Schwabe et al. (2011)
Some experiments are carried out on an inhomogeneous system consisting of the particles with different diameters. The simplest example of such a system is a large particle surrounded by a dense cloud of smaller particles. Usually, this particle called the projectile moves through the cloud with a supersonic or subsonic velocity. Such projectiles are generated using controlled mechanisms of acceleration,Caliebe et al. (2011); Chang et al. (2011) or they can appear sporadically.Schwabe et al. (2011); Samsonov et al. (2000) In the latter case, agglomerates or larger particles left over from previous experiments (not removed during the cleaning procedure and accumulated at the periphery of the particle cloud) are cracked upon illumination by the laser sheet or upon shaking the chamber. Detached individual particles acquire a negative charge and then they are accelerated due to the Coulomb repulsion.Zhukhovitskii et al. (2014)
In the work by Havnes et al.,Havnes et al. (1996) propagation of a long-wave nondispersive disturbance, which is usually called the sound, and formation of a cone corresponding to the Mach cone in a continuous medium were predicted for the strongly coupled system of the dust particles. In the first experiments, the Mach cones in the 2D plasma crystal were excited by a sphere moving faster than the lattice sound speed beneath the 2D lattice plane (Samsonov et al.Samsonov et al. (1999, 2000)) and by applying a force from the radiation pressure of a moving laser beam (Melzer et al.Melzer et al. (2000)). Later, Nosenko et al.Nosenko et al. (2002, 2003) used the latter method of the disturbance excitation and observed several Mach cones, which were attributed by the authors to propagation of the compressional and shear wakes and to their interference. The shape of the Mach cones formed by nondispersive linear sound waves was calculated analytically, and the curved wings of the Mach cones were experimentally observed by Zhdanov et al.Zhdanov et al. (2002, 2004)
In the recent works by Caliebe, Arp, and Piel,Caliebe et al. (2011) Jiang et al.Jiang et al. (2009), and Schwabe et al.,Schwabe et al. (2011) the excitation of the 3D Mach cones by the supersonic projectiles moving in a strongly coupled cloud of charged particles was observed. In these studies, argon was used as a buffer gas. The determined speed of sound is not much different in the performed experiments.
In this work, we report the first measurement of the speed of sound in the dust cloud by observation of the Mach cones in the case that neon is used as a buffer gas. The measured speed of sound proved to be more than twice as low as for argon, which means that this quantity depends rather sensitively on the sort of a gas. We can account for observed dependences on the basis of a scaling law for the dust cloud obtained in Ref. Zhukhovitskii et al., 2014.
The paper is organized as follows. In Sec. II, we describe the experimental setup and the method of the Mach cone visualization. The details of experimental data processing and the results of speed of sound measurement are presented in Sec. III. A qualitative interpretation for our experiment is discussed in Sec. IV, and the results of this study are summarized in Sec. V.
II Experiment
The experiment was performed during the 13th mission of PK-3 Plus on the ISS. The setup is described in detail in Ref. Thomas et al., 2008. The heart of this laboratory consists of a capacitively coupled plasma chamber with circular electrodes of 6 cm diameter and 3 cm apart. A radio frequency (RF) voltage applied to these electrodes generates a bulk of plasma. A dust cloud was formed by the microparticles injected into the main plasma with dispensers. Neon was used as a buffer gas at the pressures of 15 and 20 Pa, and the main microparticle cloud was composed of the monodisperse silica particles with the diameter of . The diameter of observed projectiles estimated as the diameter of larger particles, which are also present in the chamber, is most likely the same as in the experimentSchwabe et al. (2011), i.e., it is equal to . The trajectories of the dust particles and the projectile were monitored using the optical particle detection system, which consisted of a laser illumination system and a recording system, containing three progressive scan CCD-cameras. The illumination system is based on two laser diodes with and a continuous wave optical power of 40 mW, the light of which is focused to a thin sheet. This laser light sheet has a full width at half maximum of about at the focal axis. The cameras with different magnifications and fields of view recorded the light scattered by the microparticles at . To analyze the microparticle motion, we used three cameras with different fields of view and resolutions, which showed the entire microparticle cloud between the electrodes. The plasma glow was filtered out. The cameras follow the PAL standard with a resolution of pixels. Each camera provides two composite time interlaced video channels with 25 Hz frame rate. Both video channels from one camera were selected for recording, so they were combined to a 50 Hz progressive scan video.
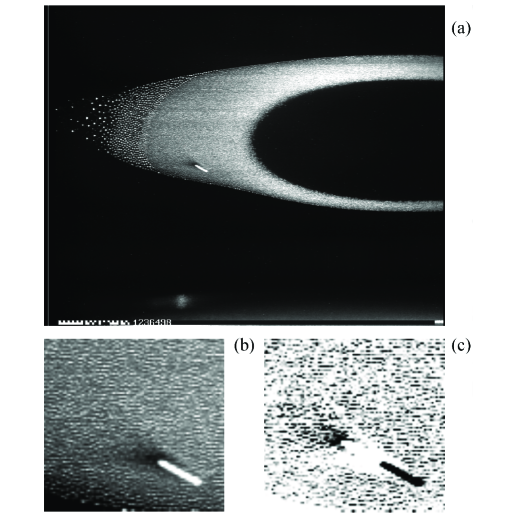
We observed two events of the projectile motion through the dust cloud. Figure 1 shows the first one. The images were recorded by the quadrant view camera with the resolution of and per pixel in horizontal and vertical directions, respectively, at 50 frames/s. The projectile moved with a supersonic velocity from the upper left to the lower right side of the dust cloud [Fig. 1(a)]. The track of the moving projectile is surrounded by a dust-free region (cavity), which emerges as a result of a strong Coulomb repulsion between the negatively charged dust particles and the projectile [Fig. 1(b)]. The cavity is elongated, the position of a projectile being eccentric. A comparison with [Fig. 1(c)] shows that in the center of a perturbation propagating through the dust cloud, the number density of dust particles is continuous both in the vicinity of the cavity and far apart from it. The perturbation proper has a typical form of the Mach cone. On this basis, we can conclude that observed perturbation is a contact discontinuity.Landau and Lifshitz (1959)
Visualization of the Mach cone included the comparison of corresponding pixels for each pair of two successive video frames converted to 8-bit grayscale mode negative images. If a gray value for the latter image was within 10% of that for the former image, a corresponding pixel of the resulting image was left blank [i.e., it is white in Fig. 1(c)]. Otherwise, the pixel assumed the value of the former image.
Although the dust particles form a strongly coupled system, they move around their equilibrium positions in the dust crystal. Typically, the positions of a dust particle in the successive frames differ by at least one pixel. Due to a low velocity, a point rather than a track in the image represents a particle. Consequently, many more of the unperturbed dust particles appear in the resulting image. However, if a particle finds itself in the contact discontinuity region, it is represented by a track due to a considerable velocity inside the perturbation. The tracks of neighboring particles overlap. Thus, a small region of the pixels with almost equal gray values is formed. Since the time interval between successive frames is 0.02 s, this region is shifted by 0.02 cm at the propagation velocity of . If the perturbation thickness is larger than 0.02 cm (in our experiment, it is about 0.04 cm), its images in the successive frames partially overlap. This area of overlap is represented by the white pixels in the resulting image, which makes it possible to visualize the Mach cone in Fig. 1 (obviously, the dust-free regions are also represented by the white pixels). Note that the efficiency of other methods used in Refs. Caliebe et al., 2011; Jiang et al., 2009; Schwabe et al., 2011 would be insufficient for the visualization if neon was used as a carrier gas.
III Determination of the speed of sound
It is well-known that the Mach angle is related to the speed of sound by the Mach cone relation , where is the velocity of the perturbation source (in our case, this is the projectile velocity), i.e.,
| (1) |
The projectile velocity was determined by manual measurement of the positions of the projectile track centers in different frames. The velocity proved to increase from to as the projectile crossed the dust cloud. The estimates show that such acceleration along with a slight curvature of the projectile trajectory, which could lead to a bend of the rulings of a cone, would have a negligibly small effect on the result of determination of as compared to the measurement errors.
The Mach angle can be determined using the vectors and that coincide with the lower and upper rulings of the Mach cone, respectively:
| (2) |
Alternatively, one can measure the Mach angle () between the vector () and the projectile displacement vector , which coincides with the projectile track. Then
| (3) |
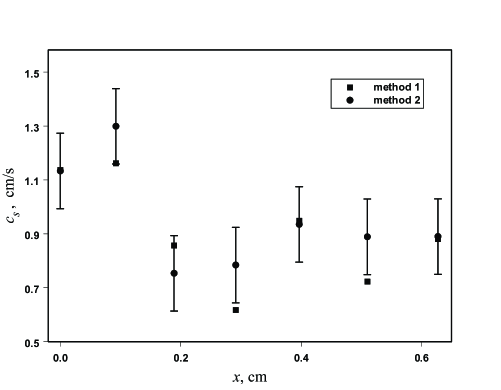
We determined the coordinates of the vectors , , and manually in each frame, which allowed one to measure . Figure 2 illustrates the results. Method 1 denotes the calculation by the formula (2); method 2 implies averaging of given by Eqs. (2) and (3). It is seen that both methods yield close results and no apparent dependence on the coordinate can be revealed within experimental errors. The averaging over the entire path of the projectile leads to the estimate .
The second event of the projectile motion through the dust cloud was detected at the neon pressure of 15 Pa. The other parameters were the same as for the first event. Here, the Mach cone can be resolved only in three processed images, which increases the error. The average projectile velocity for this event is more than twice as low as for the above-discussed event, and the speed of sound still amounts to , which is very close to the previous estimate. Thus, is more than twice as low as for argonCaliebe et al. (2011); Jiang et al. (2009); Schwabe et al. (2011) revealing the effect of the gas sort.
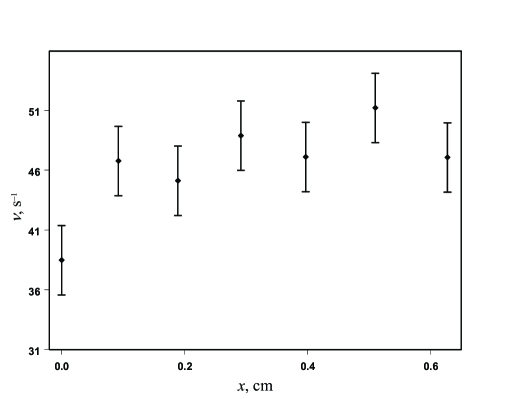
A clear resolution of the Mach cone rulings makes it possible to estimate the damping rate of the propagating perturbation as , where is the base radius of the Mach cone. Like , reveals no apparent dependence on the coordinate along the projectile path (Fig. 3). Its average amounts to for the first event and to , for the second one. For the first event, the damping length , which is of the same order of magnitude as the visible perturbation wavelength . Both lengths have the scale of ca. three to four interparticle distances.
IV Discussion
Under the conditions of our experiment, the volume charge of electrons is negligibly small as compared to that of the ions and particles,Zhukhovitskii et al. (2014) and the complex plasma can be treated as a system of negatively charged particles on the uniform positive background of the ions. Such situation is characteristic of strongly coupled Coulomb systems under high energy density. Similarly to the theory of ideal collisionless plasma, the perturbation treated in this work is commonly associated with the ion acoustic wave with the speed of soundLandau and Lifshitz (1980)
| (4) |
where is the dust particle charge in units of the elementary charge , is the particle radius, is the electron temperature (the Boltzmann constant is set to unity), , is the electrostatic potential of a particle, is the particle temperature that is related to the average kinetic energy of a particle, is the particle mass, and is the density of the particle material. For our experiment, . If we use the orbital motion limited approximationBonitz et al. (2010) for determination of and set , where is the temperature of a buffer gas (room temperature), we arrive at the estimate . Obviously, this is yet a lower bound. Thus, we can ascertain at least one order of magnitude disagreement between experiment and theory, which cannot be removed by existing alternative approaches to the calculation of the particle charge. Therefore, the formula (4) is fully inapplicable for strongly coupled Coulomb systems.
For such systems, we will derive an alternative estimate for the speed of sound . Obviously, is proportional to the ratio of the pressure, which is in the order of magnitude , to the mass density of a dust cloud . Hence,
| (5) |
where is the ion number density and we used the quasineutrality condition . It was shown in Ref. Zhukhovitskii et al., 2014 that the overlap of potentials of the dust particles, which scatter streaming ions, leads to the scaling law for the dust cloud that relates the particle number density to the particle radius: , where is some constant (the “dust invariant”). We substitute this in (5) to derive
| (6) |
Unfortunately, neither nor are available for the experiment with neon. For this reason, we test the relation (6) on the experiments with argon (Table 1). It is seen that for , which is close to typical values for argon,Zhukhovitskii et al. (2014) this relation yields a reasonable agreement with the experiment and reproduces the observed dependences of the speed of sound on the particle radius and electron temperature. Equation (6) reproduces the determined speed of sound for neon () at , which also seems to be a reasonable value because the ion number density in neon is typically one order of magnitude lower than that in argonThomas et al. (2008) (however, may be different for neon). Note that (4) disagrees with the experiments with argon as well, albeit the disagreement is not as great as for neon. For example, it leads to for the experimentSchwabe et al. (2011).
| , Pa | (exp.), cm/s | (6), cm/s | |
|---|---|---|---|
| 9.6 | 1.55 | 2.4 (Ref. Jiang et al., 2009) | 2.26 |
| 10 | 2.55 | 2.2 (Ref. Schwabe et al., 2011) | 2.18 |
| 30 | 9.55 | 2.0 (Ref. Caliebe et al., 2011) | 2.14 |
Consider the damping of a propagating perturbation. The damping due to the friction between the dust particles and a buffer gas (neutral or the Epstein dragEpstein (1924)), which always takes place in the complex plasma, is characterized by the friction coefficientFortov et al. (2005) , where is the accommodation coefficient, is the mass of a buffer gas molecule, and are the number density and thermal velocity of the buffer gas molecules, respectively. For our experiments, at the neon pressure of and , at . The comparison with the above-discussed measurements of the damping coefficient shows that damping of the particle motion by the neutral drag must dominate but in this case, the wave extinction needs a more accurate treatment.
It is of interest to compare our results with those obtained from the Mach cone observations in 2D systems.Samsonov et al. (1999, 2000); Melzer et al. (2000); Nosenko et al. (2002, 2003) The first difference is a single 3D Mach cone observed in this work (single cones were also observed in an argon dischargeCaliebe et al. (2011); Jiang et al. (2009); Schwabe et al. (2011)) vs. a double cone for a 2D systemSamsonov et al. (1999, 2000) (in Refs. Samsonov et al., 1999 and Melzer et al., 2000, three to four cones were observed). A double cone structure is sometimes associated with the propagation of the compressional and shear waves.Nosenko et al. (2003) While there is a principal possibility to excite the compressional and shear waves in a 2D system, the shear waves are unlikely to be observed in the 3D complex plasma. Indeed, in the vicinity of a projectile, a local melting of the dust crystal occurs,Zhukhovitskii et al. (2012) and the medium for the wave propagation becomes liquid. This rules out the shear waves and accounts for a single cone structure in our case. Note that there is a controversy about the number of the Mach cones in the 2D case and their nature as yet.
The second difference between the systems is the dissipation. In the experiments with 2D systems, the buffer gas pressure was an order of magnitude lower, and the particle radius, by several times larger than for our system (the particle diameter varied from about to in Ref. Samsonov et al., 2000). Thus, in our case, the damping rate exceeds this quantity for the conditions of Ref. Samsonov et al., 2000 by almost two orders of magnitude. Apparently, a high damping is responsible for the absence of the interference patterns in our 3D case while these patterns are observed for a 2D system.Samsonov et al. (2000); Nosenko et al. (2003)
As for the effect of dissipation, the Epstein drag qualitatively accounts for the observed dependence in our case: the damping length decreases with the increase in (see the discussion above). Instead, in the 2D case, the opposite trend was registered.Samsonov et al. (2000)
A significant similarity between the two systems lies in the fact that solely the longest wavelength perturbation can be excited because , and both quantities have the scale of several interparticle distances. This allows one to conclude that for both systems, the observed Mach cones correspond to the nondispersive waves and define the speed of sound. It is noteworthy that the speed of sound determined in Ref. Samsonov et al., 2000 amounts to ca. and is independent both on the sort of a gas (argon, xenon, krypton) and on the particle diameter. Almost the same speed of sound is listed in Table 1; likewise, is weakly dependent on the particle diameter. It is then surprising that for neon that was not investigated in the previous studies we obtained the speed of sound, which is twice as low as for other gases.
V Conclusion
To summarize, we used the excitation of the Mach cones by large particles moving with the supersonic velocity for measurement of the speed of dust sound in a complex plasma with neon as a buffer gas. For this purpose, a high-definition method of the Mach cone visualization was developed. The determined speed of sound proved to be more than one order of magnitude lower than that predicted by the theory of the ion acoustic waves. We propose an interpretation of these results based on the similarity between a strongly coupled Coulomb system and a solid. Using a scaling law that relates the dust particle number density to its radius, we obtained the theoretical estimate for the speed of sound, which describes the main regularities of sound propagation in complex plasmas.
Acknowledgements.
The authors gratefully acknowledge the support from the Russian Science Foundation (Project No. 14-12-01235) for theoretical interpretation of the experimental results and the support from DLR/BMWi (Grants Nos. 50WM0203 and 50WM1203) for realizing our joint space experiments on the ISS.References
- Fortov and Morfill (2009) V. E. Fortov and G. E. Morfill, eds., Complex and Dusty Plasmas: From Laboratory to Space, Series in Plasma Physics (CRC Press, 2009).
- Chu and Lin I (1994) J. H. Chu and Lin I, Phys. Rev. Lett. 72, 4009 (1994).
- Thomas et al. (1994) H. Thomas, G. E. Morfill, V. Demmel, J. Goree, B. Feuerbacher, and D. Möhlmann, Phys. Rev. Lett. 73, 652 (1994).
- Hayashi and Tashibana (1994) Y. Hayashi and S. Tashibana, Jpn. J. Appl. Phys. 33, L804 (1994).
- Vladimirov et al. (2005) S. V. Vladimirov, K. Ostrikov, and A. A. Samarian, Physics and applications of complex plasmas (Imperial College, London, 2005).
- Fortov et al. (2005) V. Fortov, A. Ivlev, S. Khrapak, A. Khrapak, and G. Morfill, Phys. Rep. 421, 1 (2005).
- Shukla and Eliasson (2009) P. K. Shukla and B. Eliasson, Rev. Mod. Phys. 81, 25 (2009).
- Bonitz et al. (2010) M. Bonitz, C. Henning, and D. Block, Rep. Prog. Phys. 73, 066501 (2010).
- Morfill et al. (2006) G. E. Morfill, U. Konopka, M. Kretschmer, M. Rubin-Zuzic, H. M. Thomas, S. K. Zhdanov, and V. Tsytovich, New J. Phys. 8, 7 (2006).
- Caliebe et al. (2011) D. Caliebe, O. Arp, and A. Piel, Phys. of Plasmas 18, 073702 (2011).
- Piel et al. (2008) A. Piel, O. Arp, M. Klindworth, and A. Melzer, Phys. Rev. E 77, 026407 (2008).
- Menzel et al. (2011) K. O. Menzel, O. Arp, and A. Piel, Phys. Rev. E 83, 016402 (2011).
- Arp et al. (2011) O. Arp, D. Caliebe, and A. Piel, Phys. Rev. E 83, 066404 (2011).
- Schwabe et al. (2008) M. Schwabe, S. K. Zhdanov, H. M. Thomas, A. V. Ivlev, M. Rubin-Zuzic, G. E. Morfill, V. I. Molotkov, A. M. Lipaev, V. E. Fortov, and T. Reiter, New J. Phys. 10, 033037 (2008).
- Morfill et al. (1999) G. E. Morfill, H. M. Thomas, U. Konopka, H. Rothermel, M. Zuzic, A. Ivlev, and J. Goree, Phys. Rev. Lett. 83, 1598 (1999).
- Khrapak et al. (2011) S. A. Khrapak, B. A. Klumov, P. Huber, V. I. Molotkov, A. M. Lipaev, V. N. Naumkin, H. M. Thomas, A. V. Ivlev, G. E. Morfill, O. F. Petrov, V. E. Fortov, Yu. Malentschenko, and S. Volkov, Phys. Rev. Lett. 106, 205001 (2011).
- Thomas et al. (2008) H. M. Thomas, G. E. Morfill, V. E. Fortov, A. V. Ivlev, V. I. Molotkov, A. M. Lipaev, T. Hagl, H. Rothermel, S. A. Khrapak, R. K. Suetterlin, M. Rubin-Zuzic, O. F. Petrov, V. I. Tokarev, and S. K. Krikalev, New J. Phys. 10, 033036 (2008).
- Jiang et al. (2009) K. Jiang, V. Nosenko, Y. F. Li, M. Schwabe, U. Konopka, A. V. Ivlev, V. E. Fortov, V. I. Molotkov, A. M. Lipaev, O. F. Petrov, M. V. Turin, H. M. Thomas, and G. E. Morfill, EPL 85, 45002 (2009).
- Schwabe et al. (2011) M. Schwabe, K. Jiang, S. Zhdanov, T. Hagl, P. Huber, A. V. Ivlev, A. M. Lipaev, V. I. Molotkov, V. N. Naumkin, K. R. Sütterlin, H. M. Thomas, V. E. Fortov, G. E. Morfill, A. Skvortsov, and S. Volkov, EPL 96, 55001 (2011).
- Chang et al. (2011) M.-C. Chang, Y.-P. Tseng, and Lin I, Phys. of Plasmas 18, 033704 (2011).
- Samsonov et al. (2000) D. Samsonov, J. Goree, H. M. Thomas, and G. E. Morfill, Phys. Rev. E 61, 5557 (2000).
- Zhukhovitskii et al. (2014) D. I. Zhukhovitskii, V. I. Molotkov, and V. E. Fortov, Phys. Plasmas 21, 063701 (2014).
- Havnes et al. (1996) O. Havnes, F. Li, F. Melandsø, T. Aslaksen, T. W. Hartquist, G. E. Morfill, T. Nitter, and V. Tsytovich, J. Vac. Sci. Technol. A 14, 525 (1996).
- Samsonov et al. (1999) D. Samsonov, J. Goree, Z. W. Ma, A. Bhattacharjee, H. M. Thomas, and G. E. Morfill, Phys. Rev. Lett. 83, 3649 (1999).
- Melzer et al. (2000) A. Melzer, S. Nunomura, D. Samsonov, Z. W. Ma, and J. Goree, Phys. Rev. E 62, 4162 (2000).
- Nosenko et al. (2002) V. Nosenko, J. Goree, , Z. W. Ma, and A. Piel, Phys. Rev. Lett. 88, 135001 (2002).
- Nosenko et al. (2003) V. Nosenko, J. Goree, Z. W. Ma, D. H. E. Dubin, and A. Piel, Phys. Rev. E 68, 056409 (2003).
- Zhdanov et al. (2002) S. K. Zhdanov, D. Samsonov, and G. E. Morfill, Phys. Rev. E 66, 026411 (2002).
- Zhdanov et al. (2004) S. K. Zhdanov, G. E. Morfill, D. Samsonov, M. Zuzic, and O. Havnes, Phys. Rev. E 69, 026407 (2004).
- Landau and Lifshitz (1959) L. D. Landau and E. M. Lifshitz, Fluid Mechanics (Pergamon Press, New York, 1959).
- Landau and Lifshitz (1980) L. D. Landau and E. M. Lifshitz, Statistical Physics (Elsevier, Oxford, 1980).
- Epstein (1924) P. Epstein, Phys. Rev. 23, 710 (1924).
- Zhukhovitskii et al. (2012) D. I. Zhukhovitskii, V. E. Fortov, V. I. Molotkov, A. M. Lipaev, V. N. Naumkin, H. M. Thomas, A. V. Ivlev, M. Schwabe, and G. E. Morfill, Phys. Rev. E 86, 016401 (2012).