![[Uncaptioned image]](/html/1411.7556/assets/x1.png)
Selection of AGN candidates in the GOODS-South Field through SPITZER/MIPS 24 microns variability
J. García-González1,
A. Alonso-Herrero1,2,
P. G. Pérez-González3,
A. Hernán-Caballero1,
V. L. Sarajedini4,
and
V. Villar3
1 Instituto de Física de Cantabria, CSIC-UC, 39005 Santander, Spain
2 Augusto González Linares Senior Research Fellow
3 Departamento de Astrofísica, UCM, 28040 Madrid, Spain
4 Departament of Astronomy, University of Florida, Gainesville, FL 32611, USA
Abstract
We present a study of galaxies showing mid-infrared variability in the deepest Spitzer/MIPS 24 m surveys in the GOODS-South field. We divide the dataset in epochs and subepochs to study the long-term (months-years) and the short-term (days) variability. We use a -statistics method to select AGN candidates with a probability 1% that the observed variability is due to statistical errors alone. We find 39 (1.7% of the parent sample) sources that show long-term variability and 55 (2.2% of the parent sample) showing short-term variability. We compare our candidates with AGN selected in the X-ray and radio bands, and AGN candidates selected by their IR emission. Approximately, 50% of the MIPS 24 m variable sources would be identified as AGN with these other methods. Therefore, MIPS 24 m variability is a new method to identify AGN candidates, possibly dust obscured and low luminosity AGN that might be missed by other methods. However, the contribution of the MIPS 24 m variable identified AGN to the general AGN population is small ( 13%) in GOODS-South.
1 Introduction
Variability can be used to select active galactic nucleus (AGN). Practically all AGN vary on time-scales from hours to millions of years ([19]; [7]). Any variability detected in galaxies on human time-scales must originate in the nuclear region, because the typical timescale for star formation variability is 100 Myr ([7]). In particular low-luminosity AGN are expected to show stronger variability than the luminous ones ([18]). Therefore, variability is likely to be an effective method to select low-luminosity AGN. Although the mechanisms that produce variability are not well understood, the main explanations involve disk instabilities ([13]) or changes in the amount of accreting material ([9]).
The aim of this work is to identify AGN through mid-IR variability in the GOODS-South field using 24 m observations taken with the Multiband Imaging Photometer for Spitzer (MIPS, [16]) on board the Spitzer Space Telescope ([20]). The near and mid-IR nuclear emission of AGN, once the stellar component is subtracted, is believed to be due to hot and warm dust (K) in the dusty torus of the AGN, according to the Unified Model [2]. In this context, variability in the accretion disk emission would cause delayed variability in the near and mid-IR as the hot and warm dust, respectively, in the torus react to this change (see [8] and references therein). Our choice of using mid-IR variability allows a novel way to select low luminosity and possibly obscured AGN that might be otherwise missed by other techniques. Apart from this work, there is only other IR variability study in the Boötes cosmological field using IRAC data ([10]). They used the most sensitive IRAC bands at 3.6 and 4.5 m and found that 1.1% of the sources satisfied their variability criteria.
2 The data and photometry
We compiled all the data taken around the GOODS-South field with the MIPS instrument at 24 m by querying the Spitzer Heritage Archive. This field was observed by Spitzer during several campaigns from January 2004 to March 2007. We focused our study on a region around RA= (J2000) and DEC= (J2000). We divided these data sets into 7 different epochs in order to detect variable sources. For this study we decided to exclude Epochs 2, 4, and 5 because their FoV is small when compared to the other epochs. The common area for the epochs 1, 3, 6, and 7 is 1360 arcmin2. They probe time scales of months up to three years, and henceforth are used to study the long-term variability covering a period of over three years. We also subdivided Epoch 7 in three epochs, namely Epochs 7a, 7b, and 7c to study the short-term variability. The short-term variability epochs have a common area of 1960 arcmin2 and probe time scales of days, covering a period of 7 days.
To study the temporal variability of MIPS m sources detected in the common regions we built a source catalog for each epoch and subepoch. We used SExtractor (Source-Extractor, [4]) to detect sources and the Image Reduction and Analysis Facility (IRAF) to perform the photometry following the procedure explained in [14] and [15]. We obtained a 24 m source catalog for each epoch. In this work we restrict the analysis to sources above the 5 detection limit in the shallowest data in the mosaics. This corresponds to MIPS m fluxes of Jy and Jy for the long-term and the short-term epochs, respectively. We also discarded sources with neighbours at distances of less than 10” to minimize crowding effects in the photometry that could affect the flux measurements and produce false variability positives. To identify the common sources in all the epochs we cross-matched the catalogs using a 2” radius, imposing additionally that the 2” criterion was fulfilled in each pair of epochs. Our final catalogs contain 2277 MIPS 24 m sources detected in Epochs 1, 3, 6, and 7 and 2452 MIPS 24 m sources in Epochs 7a, 7b, and 7c, covering an area of 1360 and 1960 arcmin2, respectively.
3 Selection of MIPS m variable sources
To select the 24 m variable sources we used a -statistics method to account for the variations of intrinsic flux uncertainties of each epoch (related to differences in depth). This is the case for our study as different epochs have different depths and within a given mosaic there are some variations in depth. The latter effect is most prominent in epoch 7, which is deeper in the center. This method associates each flux with its error. The -statistics is defined as follows: , where n is the number of epochs, is the flux in a given epoch, is the associated error in the epoch, and is the mean flux.
We calculated the value for each source without neighbours. We selected as variable candidates those sources above the 99th percentile of the distribution expected from photometric errors alone. That is, only 1% of non-variable sources satisfy the selection criteria. This value corresponds to for the 4 epochs sample (3 degrees of freedom) and for the 3 epochs one (2 degrees of freedom).
Every object with a value higher than the threshold was visually inspected to remove artefacts. We also discarded objects that fell close to the edge of the mosaic. After discarding problematic objects, our final sample contains 39 MIPS m long-term variable sources (0.03 sources arcmin-2) and 55 MIPS m short-term variable sources (0.03 sources arcmin-2). The selected MIPS m long-term and short-term variable sources represent 1.7 and 2.2% of the original parent samples, respectively. Only two sources are identified as having both, long and short-term variability. 28 MIPS m long-term and 33 MIPS m short-term are located in the Extended Chandra Deep Field South (E-CDFS).
4 Properties of the MIPS 24 m variable sources
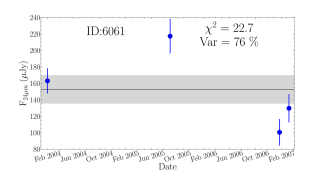
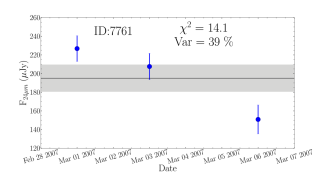
The m fluxes of the variable sources are dominated by sources with mean fluxes below 300 Jy. The median 24 m flux is 168 Jy for the long-term variable sources and 209 Jy for the short-term variable sources. This slight difference in the median values of the 24 m fluxes for long and short-term variability is likely reflecting the different depths (i.e., 5 detection limits) of the epochs rather than different intrinsic properties of the sources).
An estimate of the variability is the ratio between the maximum and minimum values and the mean flux measured as a %: . The typical 24 m values of the long-term and short-term variable sources are 37-43%, with typical errors of 12-13%. In Figure 1 we show two example light curves, one of long-term and the other of short-term variable sources. Each plot shows the name of the source, the value and the measure of the variability ).
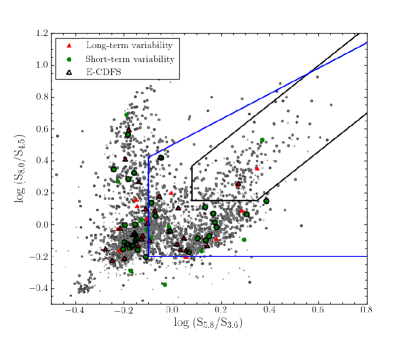
We also studied the Spitzer-IRAC mid-IR (3.6, 4.5, 5.8, and 8.0 m) properties of the MIPS m variable sources as the IRAC emission has also been used to select AGN candidates (e.g., [11]; [17]; [1]; [5]; [12]). To obtain the IRAC data for our sources, we used the Rainbow Cosmological Surveys Database, which contains multi-wavelength photometric data as well as spectroscopic information for sources in different cosmological fields, including GOODS-South [14, 15]. In Figure 2 we show the IRAC colour-colour plot. 44% of the variable sources fall in the [11] AGN wedge. The majority of the variable sources are compatible with a low AGN contribution in the IR.
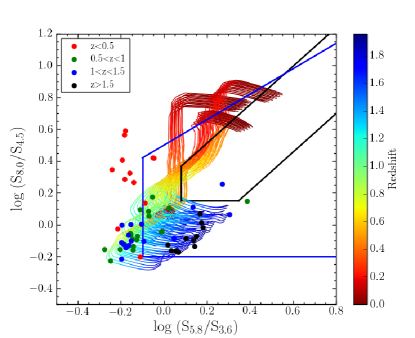
From the Rainbow database we also obtained the photometric redshifts of the variable sources (average redshift 0.95) and the rest-frame monochromatic 24 m luminosity. The mean value of rest-frame is 10.5 for both the long-term and the short-term variable sources. For those candidates satisfying the [11] AGN selection criteria the mean values are for both, the long-term and the short-term variable candidates. Conversely, the candidates not satisfying the [11] criteria have mean values of and 10.4 for the long-term and the short-term variable candidates, respectively.
We studied the radio properties of the variable sources. Only 9 sources have radio data. Of them, 44% present radio excess, defined as which might be an indication of AGN activity (see [3]).
We also studied the X-ray properties and obtained that the 30% of the 24 m variable sourced are detected in X-rays in the central part of the E-CDFS (covered by [21]). The X-ray keV luminosities are ranging from to . 4% of the X-ray sources satisfying the properties of our parent MIPS 24 m catalogs are variable at 24 m on the timescales probed by our study. Assuming that deep X-ray exposures provide the majority of the AGN, the 24 m variable sources not detected in X-ray would only account 13% of the total AGN population.
Finally, the compared our variable sources with sources selected as AGN by other criteria. We found 56% of the variable 24 sources in the E-CDFS would be identified as AGN by other methods. Table 1 summarizes this comparison.
| No. | X-ray1 | radio2 | other AGN3 | IR4 | Combined5 | [11]6 | Combined7 | |
| variable | excess | catalogs | power law | criteria | criteria | |||
| sources | No. (%) | No. (%) | No. (%) | No. (%) | No. (%) | No. (%) | No.(%) | |
| Long-term variable sources | ||||||||
| In the E-CDFS | 28 | 7 (25) | 2 (7) | 4 (14) | 1 (4) | 8 (29) | 12 (43) | 17 (61) |
| Outside the E-CDFS | 11 | 0 (0) | 0 (0) | 0 (0) | 2 (18) | 2 (18) | 5 (45) | 5 (45) |
| All | 39 | 7 (18) | 2 (5) | 4 (10) | 3 (8) | 10 (26) | 17 (44) | 22 (56) |
| Short-term variable sources | ||||||||
| In the E-CDFS | 33 | 4 (12) | 1 (3) | 3 (9) | 0 (0) | 5 (15) | 14 (42) | 17 (52) |
| Outside the E-CDFS | 22 | 1 (5) | 1 (5) | 1 (5) | 1 (5) | 2 (9) | 5 (23) | 5 (23) |
| All | 55 | 5 (9) | 2 (4) | 4 (7) | 1 (2) | 7 (13) | 19 (35) | 22 (40) |
1 Variable MIPS 24 m sources detected in X-rays. 2 Variable MIPS 24 m sources with radio excess. 3 Variable MIPS 24 m sources in other AGN catalogs. 4 Variable MIPS 24 m sources detected as IR power-law AGN. 5 Combined 1st, 2nd, 3rd, and 4th criteria. 6 Variable MIPS 24 m sources satisfying the [11] criteria. 7 All the criteria combined.
5 Summary and conclusions
We used a method to select long-term (years) and short-term (days) variable sources at 24 m using deep Spitzer/MIPS imaging data from 7 epochs (2004-2007) in the GOODS-South field. We found 39 long-term and 55 short-term variable sources. Of them, 28 long-term and 33 short-term variable sources are located in the E-CDFS. The average redshift is 0.95. We are therefore probing typically variable emission at 12 m rest-frame. The contribution of the AGN to the 24 emission is low, which probably implies that they are low-luminosity AGN. 30% of the variable sources are detected in X-ray in the central part of the E-CDFS. Sources without X-ray detection are 13% of the total AGN population in the central part of the E-CDFS. Approximately 56% of the variable sources in the E-CDFS would be identified as AGN by other methods. Therefore, MIPS 24 m variability provides a new method to identify AGN in cosmological fields. See [6] for more details.
Acknowledgments
J.G.-G., A.A.-H., and A.H.-C. acknowledge support from the Augusto G. Linares research program of the Universidad de Cantabria and from the Spanish Plan Nacional through grant AYA2012-31447. P.G.P.-G. acknowledges support from MINECO grant AYA2012-31277.
References
- [1] Alonso-Herrero A. et al., 2006, ApJ, 640, 167
- [2] Antonucci R., 1993, ARA&A, 31, 473
- [3] Appleton P. N. et al., 2004, ApJS, 157, 147
- [4] Bertin E., & Arnouts S., 1996, A&AS, 117, 393
- [5] Donley J. L. et al., 2012, ApJ, 748, 142
- [6] García-González J., Alonso-Herrero A., Peréz-González P. G., Hernán-Caballero A., Sarajedini V. L., Villar V., 2014, MNRAS, in press (arXiv:1410.6011)
- [7] Hickox R. C., Mullaney J. R., Alexander D. M., Chen C. J., Civano F. M., Goulding A. D., Hainline K. N, 2014, ApJ, 782, 9
- [8] Hönig S. F., & Kishimoto M., 2011, A&A, 534, 121
- [9] Hopkins A. M., & Beacom J. F., 2006, ApJ, 651, 142
- [10] Kozlowski S. et al., 2010, ApJ, 716, 530
- [11] Lacy M. et al., 2004, ApJS, 154, L166
- [12] Lacy M. et al., 2013, ApJS, 208, 24
- [13] Pereyra N. A., Vanden Berk D. E., Turnshek D. A., Hillier D. J., Wilhite B. C., Kron R. G., Schneider D. P., Brinkmann J., 2006, ApJ, 642, 87
- [14] Pérez -González P. G. et al., 2005, ApJ, 630, 82
- [15] Pérez -González P. G. et al., 2008, ApJ, 675, 234
- [16] Rieke G. H. et al., 2004, ApJS, 154, 25
- [17] Stern D. et al., 2005, ApJ, 631, 163
- [18] Trevese D., Kron R. G., Majewski S. R., Bershady M. A., Koo D. C., 1994, ApJ, 433, 494
- [19] Ulrich M., Maraschi L., Urry C. M., 1997, ARA&A, 35, 445
- [20] Werner M. W. et al., 2004, ApJS, 154, 1
- [21] Xue Y. Q. et al., 2011, ApJS, 195, 10