Spectral Efficiency Optimization in Flexi-Grid Long-Haul Optical Systems
Abstract
Flexible grid optical networks allow a better exploitation of fiber capacity, by enabling a denser frequency allocation. A tighter channel spacing, however, requires narrower filters, which increase linear intersymbol interference (ISI), and may dramatically reduce system reach. Commercial coherent receivers are based on symbol by symbol detectors, which are quite sensitive to ISI. In this context, Nyquist spacing is considered as the ultimate limit to wavelength-division multiplexing (WDM) packing.
In this paper, we show that by introducing a limited-complexity trellis processing at the receiver, either the reach of Nyquist WDM flexi-grid networks can be significantly extended, or a denser-than-Nyquist channel packing (i.e., a higher spectral efficiency (SE)) is possible at equal reach. By adopting well-known information-theoretic techniques, we design a limited-complexity trellis processing and quantify its SE gain in flexi-grid architectures where wavelength selective switches over a frequency grid of 12.5GHz are employed.
Index Terms:
Optical communications, Coherent detection, Nonlinear propagation, Nyquist-WDM, Time-frequency packing, Polarization-multiplexed quaternary phase-shift keying, Flexi-grid, ROADM.I Introduction
Spurred by the relentless increase of data traffic, coherent optical systems were revived in the last decade, and many different paths were undertaken in order to better exploit the huge capacity of the fiber channel, from polarization-multiplexing (PM) and high-order modulations, to dense wavelength division multiplexing (WDM) solutions like Nyquist-WDM or orthogonal frequency division multipleximg (OFDM) [1, 2]. Although to cope with the foreseen capacity crunch of the existing fiber infrastructure [3] the long-term solution will likely be the use of multimode fibers and multi-input-multi-output processing – a solution that requires replacing the existing fiber infrastructure – yet a less disruptive step towards increasing SE has been the introduction of flexi-grid WDM networks [4] where throughput increase is achieved through the reduction of channel spacing. However, the deployment of new generation flexible wavelength selective switches (WSS) [5] in reconfigurable optical add-and-drop multiplexers (ROADM), compatible with the aforemoentioned standard, entails a careful redesign of optical systems, and specifically transmission and reception techniques. In fact, the presence of WSS with 12.5 GHz granularity prevents the SE increase through the simple adoption of Nyquist-shaped signaling, as the effect of crossing ROADMs, and therefore cascaded WSS filtering, is detrimental even after a few nodes [6].
We employ a maximum-a-posteriori (MAP) symbol detector [7] with a minimum number of states in order to mitigate the effects of WSS inline filtering, and compare it to the conventional symbol-by-symbol detector. The comparison is carried out for a polarization-multiplexed quaternary phase shift keying (QPSK) modulation, both in terms of pre forward-error-correction (FEC) bit error rate (or equivalently Q-factor) and in terms of achievable information rate (AIR), and thus achievable SE, by resorting to the simulation-based technique detailed in [8]. While AIR represents a theoretical value that may be achieved by some optimal FEC, we next extend the analysis by equipping our receivers with existing low-density parity check codes (LDPC) designed for satellite links [9], and check their SE against that obtained from AIR. The SE of such practical LDPCs turns out to be close to the value of the achievable SE, thus providing evidence of the practical meaning of the achievable SE as an upper bound on SE of all FECs working with such a receiver. We prove, for instance, that even 2-state MAP symbol detectors111Notice that our receiver processes the PM-QPSK signal components separately, thus it entails four 2-state MAP detectors. allow to more than double the maximum reach when using 25% overhead FECs and a Nyquist channel spacing with tight optical filtering. Next, with the same MAP receiver, we show that it is possible to further increase the system SE by going beyond the Nyquist limit [10], hence transmitting at a higher symbol rate at the same spacing. Results show that, taking the standard symbol-by-symbol threshold detector at the lowest symbol rate as a reference, a gain up to almost 50% in SE (i.e., 50% more throughput) is possible.
The paper is organized as follows. In Section II, a description of the system model link architecture and the adopted detection strategy are provided. Section III gives insight on the theoretical approach chosen to evaluate the receiver performance and to provide an analysis of system impairments. Section IV reports on the numerical results and the observations that arise. Finally, conclusions are drawn in Section V.
II System model
The considered system is closely related to that described in [6]. In our WDM simulated system, PM linearly-modulated signals are launched on random polarizations and with random detuning with respect to central frequencies. In the following, we will consider a QPSK modulation format on each carrier and each polarization. The general expression for the complex envelope of the signal transmitted on the th carrier and the th polarization () is
| (1) |
where is the shaping pulse having root raised-cosine (RRC) spectrum with roll-off (obtained by proper transmit-side electrical filtering), the number of symbols transmitted over each carrier and each polarization, the symbol interval, the symbol transmitted over the th carrier of the th polarization during the th symbol interval, and the delay and the initial phase of the th polarization and th carrier, respectively, the frequency spacing between two adjacent carriers, and the possible frequency offset (small compared to the frequency spacing).222The frequency offset can be considered to be two order of magnitude smaller than the carrier spacing. In our simulations we included random offsets in the range % of the carrier spacing. The transmitted symbols were obtained from a stream of information bits, by properly encoding with a binary FEC and Gray mapped onto the QPSK constellation.
The transmitted signal was then launched into a dispersion unmanaged fiber link with variable number of spans , characterized by the presence of ROADM nodes, one every two fiber spans. Therefore, the number of crossed ROADMs was equal to half the number of spans. Each span had 120 km of single mode fiber (SMF) and an erbium-doped fiber amplifier (EDFA) with a noise figure of 6 dB. Since ROADMs are here intended as simple pass-through nodes, they basically just introduce the filtering effect of two WSS, modeled as 3rd-order super-Gaussian filters. The bandwidth of such filters can be determined once the flexible grid spacing has been selected. We fixed the channel spacing to 37.5 GHz, which implies a 3-dB filter bandwidth of 35.75 GHz [5, 6].
Fiber propagation was impaired by group velocity dispersion (GVD),333We also considered polarization mode dispersion (PMD) with values of the differential group delay of typical fibers and noted no performance difference. Thus, PMD is not present in current results. and nonlinear effects. These latter effects were simulated by the split step Fourier method (SSFM) [11] applied to the Manakov nonlinear equation with proper step size.444We optimized the step-size for each launch power, by increasing the value in trial simulations until we noted no performance variation. The symbol rate of each signal was initially fixed to 32.5 Gbaud, as in [6]. Then, in order to demonstrate the advantages of the time-frequency packing (TFP) technique [8], we increased the data rate beyond the Nyquist limit, up to 75 Gbaud, while keeping all remaining parameters unchanged (i.e., we did not change the filter bandwidths). Fig. 1 shows the block diagram of the generic simulated link.
At the receive side, coherent detection was performed [12]. The received optical field was first filtered by a 4th-order super-Gaussian filter having a 3-dB bandwidth of 35.75 GHz, which allows to select the desired channel, and then converted to the electrical domain through a optical hybrid. Digital signal processing (DSP) was then performed, as explained in detail in [8]. After sampling, compensation of the cumulated GVD was performed by two fixed-tap equalizers (one per polarization) and then frame and frequency synchronization and compensation were performed. A two-dimensional fractionally-spaced adaptive minimum mean square error (MMSE) feed-forward equalizer (FFE) performed compensation of the residual GVD and polarization mode dispersion (PMD), and also performed polarization demultiplexing. The number of taps was chosen sufficiently high so that GVD and PMD did not entail any penalty, whereas a coefficient adaptation step-size value of came up to be optimal in any case. Finally phase noise was tracked by a proper decision-directed phase estimation and compensation module. All synchronization aspects were neglected here—perfect synchronization was assumed. These aspects will be discussed in detail in a future paper. Finally, signal samples fed the detector, which, in the MAP case, iteratively exchanges soft information with the LDPC decoder.
We considered two kinds of detectors. First, we used a conventional symbol-by-symbol detector/demapper that neglects channel memory (i.e., the detector commonly used in coherent receivers). As a second more sophisticated solution, we employed a MAP symbol detector with a minimum number of states (see Section IV), preceeded by a channel shortener [13], which is essentially a linear filter with a few taps, and whose computation is based on the estimation of the overall channel impulse response. The shortener helps coping with the intersymbol interference (ISI) not accounted for by the limited detector memory, as explained in [8]. More details on the simulated system and receiver parameters will be given in Section IV.

On the described system, we performed two kinds of simulations. First, we evaluated the achievable SE, as explained in the next section, by varying the launch power per channel and number of spans of the link. Then, we also employed a set of codes with rates in the range 1/3-9/10. These codes were used to confirm the AIR semi-analytical predictions.
III Spectral Efficiency Analysis
We now describe the framework used to evaluate the performance limits of all the optical transmission systems considered in this paper.
We consider an optical channel with linear and nonlinear distortions, simulated through the SSFM. Denoting by a proper discrete-time sufficient statistic used for detection of the information symbols , the information rate (IR), i.e., the average mutual information when the information symbols are independent and uniformly distributed random variables belonging to the given constellation, is defined as555The factor 2 takes into account the presence of two polarizations.
| (2) |
where denotes expectation, a probability density function (PDF) and a probability mass function (PMF). The SE is the IR per unit bandwidth and unit time
since is the time-frequency slot devoted to the transmission of symbol .
The computation of IR and SE requires the availability of the pdfs and . However, they are not known in closed form, nor can we resort to the simulation method in [14] to compute them. In fact, this method requires that the channel at hand has a finite memory and the availability of an optimal detector for it [14]. These conditions are clearly not satisfied in our scenario [15, 16]. We may thus resort to the computation of a proper lower bound of the IR (and thus of the SE) obtained by substituting in (2) with an arbitrary auxiliary channel law with the same input and output alphabets as the original channel (mismatched detection [17, 14, 10, 18]). The resulting lower bound reads as
| (3) |
If the auxiliary channel law is representative of a finite-state channel, pdfs and can be computed, this time, by using the optimal MAP symbol detector for that auxiliary channel [14]. Such a detector, which will clearly be suboptimal for the actual channel, will have at its input the sequence generated by simulation according to the actual channel model, and the expectation in (3) is meant with respect to the input and output sequences generated accordingly [14]. Thus, no assumption on the true statistics of the discrete-time received sequence is required for the design of the adopted detector, since it is designed for the auxiliary channel. Similarly, the true statistics of the sequence are not analytically required for its generation, since they can be obtained by SSFM simulation through the actual nonlinear channel. If we change the auxiliary channel (and thus the trellis metrics based on it) we obtain different lower bounds on the information rate but, in any case, such bounds are achievable by those receivers, according to mismatched detection [17, 14]. We will thus say, with an abuse of terminology, that the computed lower bounds are the maximum SE values of the considered channel when those receivers are employed. All these considerations hold for any actual channel, including nonlinear and non-Gaussian ones.
This technique thus allows to evaluate the AIR for receivers of reduced complexity. In fact, it is sufficient to consider an auxiliary channel which is a simplified version of the actual channel in the sense that only a portion of the true channel memory and/or a limited number of impairments are present. The considered receivers have been described in the previous section. As mentioned, we have assumed that parallel independent detectors are employed, one for each carrier and each polarization. In other words, intercarrier interference (ICI) is not coped with at the receiver, since multiuser detection is considered too computationally demanding. This corresponds to the adoption of an auxiliary channel model that can be factorized into the product
where is a proper discrete-time received sequence used for detection of symbols transmitted over the th carrier and the th polarization. Under this assumption, we simply have
| (4) |
i.e., the result can be computed by considering only one carrier. In a practical scenario with a finite number of carriers, we will consider the central carrier only, thus avoiding the computation on the border carriers which are affected by a smaller amount of ICI, thus obtaining a further lower bound.
Note that, as stated, we are not able to compute the IR of the true channel since the optimal receiver is unknown and possibly of unmanageable complexity. We take here the pragmatic approach of considering only limited-complexity suboptimal receivers. For such receivers we are indeed able to compute the relevant IR which will be called achievable IR. The corresponding achievable lower bound on SE (achievable SE in the following) is thus
| (5) |
The auxiliary channel that we adopted for the MAP symbol detector design neglects the presence of channel nonlinear effects, and assumes that GVD and PMD have been perfectly compensated. Basically, the detector is designed by taking into account transmit side shaping pulse and inline filtering, so that the sufficient statistics can be obtained by sampling the output of a filter matched to the received pulse in the absence of GVD, PMD, and nonlinear effects, i.e., the transmit pulse after cascaded inline filtering.666The FFE taps are designed by using the matched filter output as the target response, so that the equalizer does not remove the ISI induced by filtering but only performs matched filtering. It is worth noting that, if extremely narrow optical filtering is employed at the receive side, the electrical compensation of chromatic dispersion through the non-adaptive equalizers may be inaccurate. In this case, a wider optical filter can be used, compatibly with the system design, in order to leave the useful component of the received signal unchanged, whereas matched filtering is implemented by the adaptive equalizer. In SSFM simulations, noise contributions introduced by EDFAs are added along the whole optical link at each span. Hence inline filtering has an incremental effect on the propagating signal, whereas for the auxiliary channel we assume that all noise is added at the end of the link. Thus, at the receive side it is possible to estimate the overall channel response (e.g., through a simple MMSE estimator) without any knowledge on the link configuration, which corresponds to the most practical way to design the MAP symbol detector. Notice that the presence of other conventional receive-side filters, with bandwidth compatible with the chosen frequency grid, does not imply changes to the established matched filter response, thus does not affect the aforementioned considerations. Given this auxiliary channel law, the optimal MAP symbol detector is described in [19] (see [8] for more details).
As a concluding remark, we would like to point out that this technique allows to compute the achievable limit of the considered receivers without taking into account specific coding schemes, being understood that, with a properly designed channel code, the information-theoretic performance can be closely approached. Section IV will report some design cases for these codes with the aim of showing that, indeed, the performance predicted by the achievable SE can be approached.
| TX Optical | Inline WSS | RX Optical | RX electrical | |
| Type | RRC, =0.1 | 3rd Gauss. | 4th Gauss. | 5th Bessel |
| Bandwidth [GHz] | 35.75 | 35.75 | 35.75 | 16 |
IV Numerical Results
In this section, we present the simulation results of the optical channel described in Section II. The WDM input signal in (1) had 11 channels with spacing 37.5 GHz and was launched in the line with power per channel and propagated through a dispersion-uncompensated (DU) link of identical 120 km single-mode fiber (SMF) spans. Fiber parameters include dispersion 16.63 , attenuation 0.23 , and nonlinear index 1.3 . Every two spans we included a ROADM, whose only effect is a filtering due to the presence of two WSS on the signal path. In Tab. I, we recall system filter types and bandwidths, which are kept unchanged in all simulations. The effect of cascading WSS is then summarized in Tab. II, which reports the power loss of the RRC-filtered 32.5 Gbaud signal versus the number of crossed WSS.
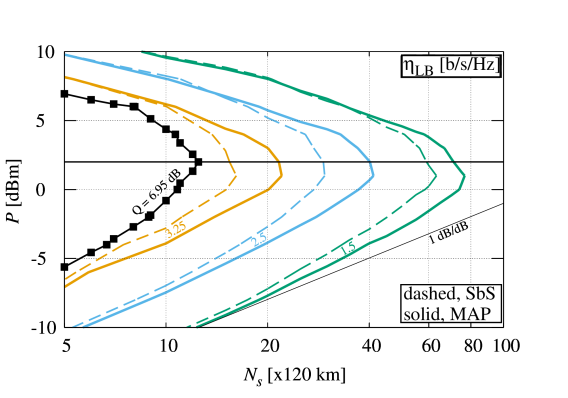
We simulated the propagation of =32.5 Gbaud channels, and each of them was detected by using proper MAP symbol detectors which take into account a memory of symbols. Since we use a QPSK modulation per polarization, the detector was split into 4 binary detectors with states, each operating on one polarization and one quadrature. In addition, we also considered the use of a standard symbol-by-symbol detector. Results are shown in Fig. 2, where horizontal cuts of SE surfaces are plotted versus and . For each point of the surface we averaged over 6 clusters of about 70000 symbols, and obtained a confidence interval of at worst 4%. Furthermore, for each point the transmitted channels were launched with random initial polarization, time delays, and offset frequencies. The smoothness of the resulting surfaces confirms the validity of our averaging. We also report in this figure the horizontal cut corresponding to an uncoded bit-error-rate (BER) of 0.0132 (or, equivalently, a Q-factor equal to 6.95 dB) for the symbol-by-symbol detector, which represents a conventional pre-FEC BER for a 25% overhead code (to be more precise, a concatenated BCH code, see [20]). From the figures, it can be noticed that the theoretical SE (back-to-back case) of [b/s/Hz] decreases with increasing distance, and MAP detector shows a clear maximum reach advantage. The gain of the MAP detector can be explained with the improved performance in linear regime, where the limited memory of the channel is properly exploited by the detector. Such a gain decreases in nonlinear regime since the ISI introduced by inline filtering is masked by the huge memory (not accounted for in the auxiliary channel) brought by the nonlinear channel. Nevertheless, the gain of the MAP detector is still significant because at the optimal launch power optical noise is twice as important as nonlinear interference noise [21]. It is worth noting that the slope of these contour plots in nonlinear regime are in good agreement with curves shown in [21] (but it is not equal to 1 dB/dB in linear regime due to inline filtering), where the Gaussian-noise model for DU optical systems [22] was assumed, and signal-to-noise ratio (SNR) cuts are drawn versus and .
| # WSS | 1 | 2 | 5 | 10 | 20 | 50 | 100 |
|---|---|---|---|---|---|---|---|
| Power loss | 8% | 14% | 24% | 32% | 39% | 47% | 53% |
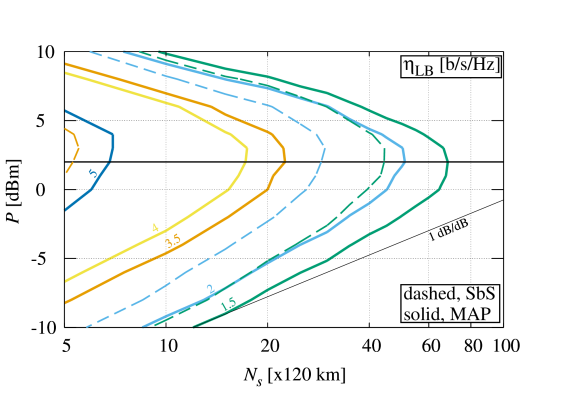
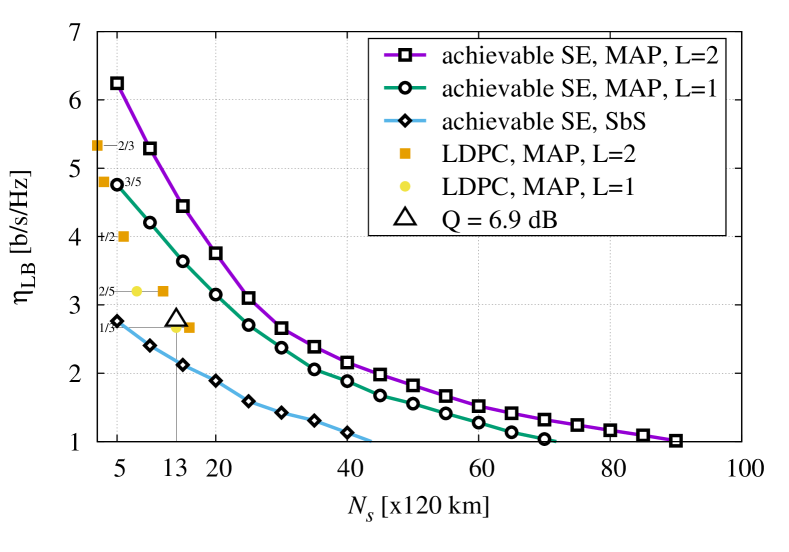
Fig. 3 presents the same horizontal cuts of SE surfaces, for the case =50 Gbaud. We are here in the realm of time-frequency packing [23, 8]. The shape of the contour plots are very similar to those in the previous figure but, in this case, it is possible to appreciate the relevant SE improvement (a back-to-back theoretical value of [b/s/Hz] can be observed at the optimal power), which outlines a clear benefit with MAP symbol detector especially for short distances. On the contrary, the threshold detector performs worse than in the =32.5 Gbaud case already after a few spans, as expected (since it is not able to cope with the intentional intersymbol interference introduced by transmit-side narrow filtering). Fig. 4 further shows results at =75 Gbaud, that is twice the channel spacing. In this case, since the packing is denser, we also plotted curves for (i.e., four states). A significant SE improvement can be noticed at shorter distances, where higher than 6 b/s/Hz is reached. In this scenario, clearly, the symbol-by-symbol dector performs poorly, reaching at most b/s/Hz.
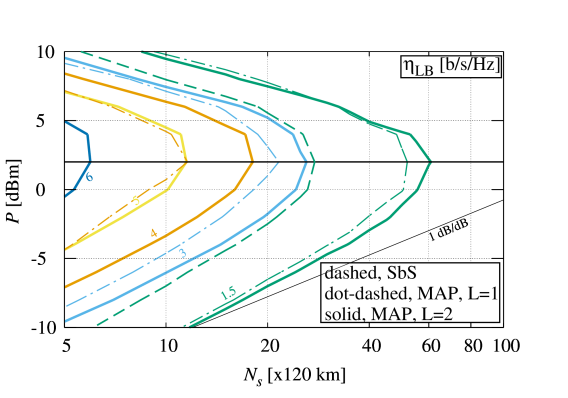
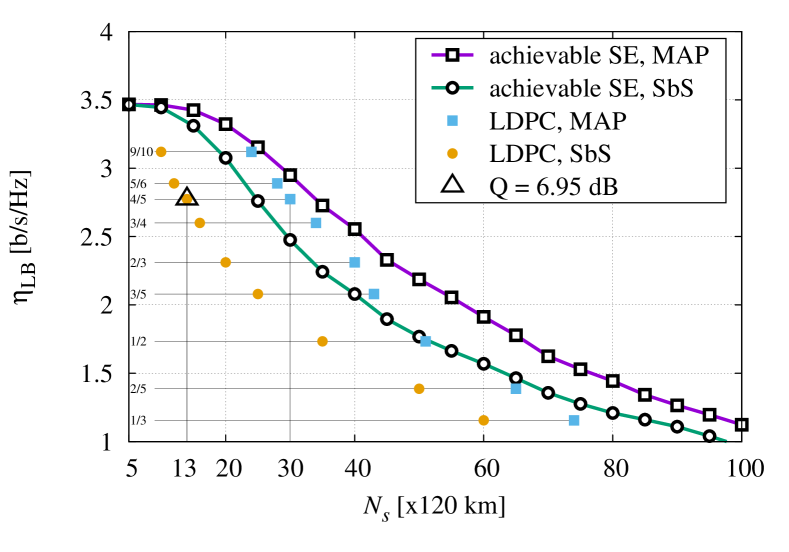
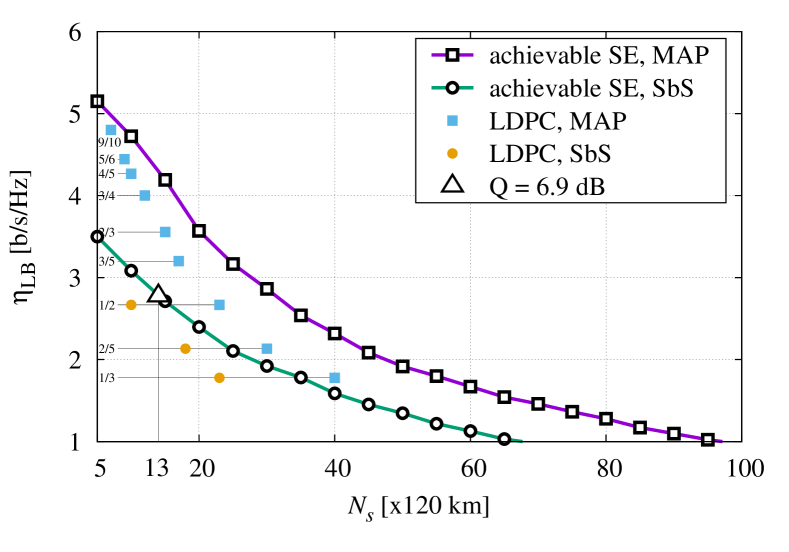
Fig. 5-7 show instead the vertical cuts of the SE surfaces at =2 dBm, for =32.5 Gbaud, =50 Gbaud and =75 Gbaud, respectively. For this scenario, we also simulated coded signaling, by using LDPC codes with rates from 1/3 to 9/10 from [9], and declaring the maximum reach at distances where an estimated post-FEC BER lower than was achieved, which in practice implies convergence of the iterative detection/decoding algorithm.777We consider this value as representative of the error floors of the simulated LDPC codes, which can be usually found at BER values below . From this BER, additional outer codes with 2-3% overhead, tipically BCH, can further reduce the BER down to . We fixed a limit of 40 iterations, and averaged over 500,000 received symbols per step. We found a good agreement between expected results from achievable lower bounds and simulations, with more affinity for the MAP detector at small distances, since in this case the auxiliary channel assumed by the receiver is closer to the true channel (i.e., the effect of cascaded ROADMs is still not critical). However, the gap between achievable SE and simulations becomes larger when the system is more impaired by ISI and at the same time the actual and auxiliary channels are more divergent, as can be inferred from Fig. 7. In this case, the system would benefit from a careful re-design of the employed codes. In any case, simulations with LDPC codes confirm the reliability of the SE analysis performed through the AIR lower bounds computation. It is interesting to notice that our simulated rate-4/5 code with the SbS detector has the same performance as the 6.95-dB reference code indicated by the triangle in Fig. 5, whereas if the same code is used with the MAP detector the reach can be more than doubled.
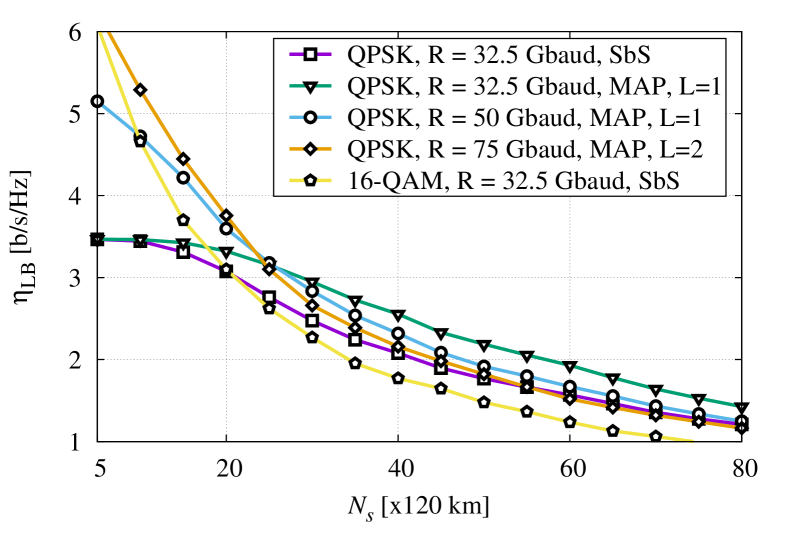
Finally, in Fig. 8 we report the curves of Fig. 5, 6 and 7, in order to provide a direct and clearer comparison of the results. We also included simulations of the 16-quadrature amplitude modulation (QAM) format with the symbol-by-symbol detector at 32.5 Gbaud, in order to provide a more exhaustive comparison. At equal symbol rate, being the launched signal only slightly affected by ISI, benefits are remarkable when the effect of inline WSS filtering starts to significantly impair the signal. On the other hand, if we consider the 50 and 75 Gbaud signals, an impressive SE gain up to 80% is obtained at smaller distances, while there is no gain after about 25 spans, i.e. 3000 km.
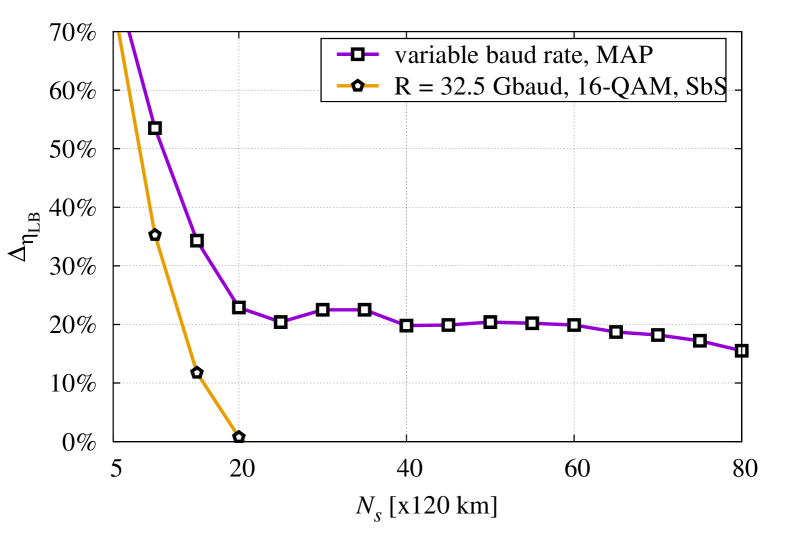
By defining the relative SE gain of the MAP receiver with respect to the SbS receiver as
| (6) |
where is the achievable SE value of the QPSK symbol-by-symbol detector with =32.5 Gbaud at each distance, in Fig. 9 we plot the relative gain in SE of MAP detector versus distance in variable symbol rate scenarios (we simulated 32.5, 37.5, 45, 50, 75 Gbaud channels, in the latest case with ), highlighting the benefits of the chosen 2- and 4-state detectors. The MAP curve is given by the envelope of all simulated symbol rates, so it is possible to infer that the QPSK with MAP detector performs always better than the 16-QAM, and that choosing a suitable symbol rate depending on the link length, allows to keep a consistent SE gain with respect to conventional symbol-by-symbol detector.
V Conclusions
In this paper we investigated the effects of narrow filtering in WDM transmission over flexible grid optical networks, with particular emphasis on 37.5 GHz spacing and 32.5 Gbaud rate. We showed that it is possible to mitigate the detrimental intersymbol interference introduced by cascading WSS along the link by employing a 2-state maximum-a-posteriori symbol detector for each input bit stream. The mitigation is quantified in terms of achievable spectral efficiency versus propagation distance and launch power. Moreover, we proved that it is possible to exploit LDPC codes of different rates in order to achieve a desired spectral efficiency, thus obtaining a remarkable system reach improvement, or, conversely, higher spectral efficiency at equal reach, with respect to the conventional symbol-by-symbol detector. Finally, we proved that by transmitting 50 Gbaud channels on the same DU SMF link a great SE gain can be achieved by working beyond the Nyquist-WDM limit through time-frequency packing, which enables a remarkable spectral efficiency gain for distances up to 3000 km.
Acknowledgment
This work was supported in part by CNIT and by the Italian Ministero dell’Istruzione, dell’Università e della Ricerca (MIUR) under the FIRB project Coherent Terabit Optical Networks (COTONE).
References
- [1] G. Bosco, V. Curri, A. Carena, P. Poggiolini, and F. Forghieri, “On the performance of Nyquist-WDM terabit superchannels based on PM-QPSK, PM-8PSK or PM-16QAM subcarriers,” J. Lightw. Tech., vol. 29, no. 1, pp. 53–61, 2011.
- [2] S. L. Jansen, B. Spinnler, I. Morita, S. Randel, and H. Tanaka, “100GbE: QPSK versus OFDM,” Optical Fiber Technology, vol. 15, no. 5-6, pp. 407–413, Oct-Dec 2009.
- [3] R. Tkach and A. Chraplyvy, “Past/present system advances, with an eye towards the future,” in Proc. European Conf. on Optical Commun. (ECOC’10), Sep. 2010.
- [4] ITU-T G.694.1, “Spectral grids for WDM applications: DWDM frequency grid,” Feb. 2012.
- [5] Finisar, “Balancing performance, flexibility, and scalability in optical networks,” White Paper, Feb. 2012.
- [6] A. Morea, J. Renaudier, A. Ghazisaeidi, O. Bertrand-Pardo, and T. Zami, “Impact of reducing channel spacing from 50 GHz to 37.5 GHz in fully transparent meshed networks,” in Proc. Optical Fiber Commun. Conf., San Francisco, CA, 2014, paper Th1E.4.
- [7] L. R. Bahl, J. Cocke, F. Jelinek, and J. Raviv, “Optimal decoding of linear codes for minimizing symbol error rate,” IEEE Trans. Inform. Theory, vol. 20, pp. 284–287, Mar. 1974.
- [8] G. Colavolpe and T. Foggi, “Time-frequency packing for high capacity coherent optical links,” IEEE Trans. Commun., vol. 62, no. 8, pp. 2986–2995, Aug. 2014.
- [9] ETSI EN 301 307 Digital Video Broadcasting (DVB); V1.1.2 (2006-06), “Second generation framing structure, channel coding and modulation systems for Broadcasting, Interactive Services, News Gathering and other Broadband satellite applications.” [Online]. Available: http://www.etsi.org
- [10] G. Colavolpe, T. Foggi, A. Modenini, and A. Piemontese, “Faster-than-Nyquist and beyond: how to improve spectral efficiency by accepting interference,” Opt. Express, vol. 19, no. 27, pp. 26 600–26 609, Dec 2011.
- [11] O. V. Sinkin, R. Holzlöhner, J. Zweck, and C. R. Menyuk, “Optimization of the split-step fourier method in modeling optical-fiber communications systems,” J. Lightw. Technol., vol. 21, no. 1, pp. 61–68, Jan. 2003.
- [12] G. Colavolpe, T. Foggi, E. Forestieri, and G. Prati, “Multilevel optical systems with MLSD receivers insensitive to GVD and PMD,” J. Lightw. Tech., vol. 26, pp. 1263–1273, May 2008.
- [13] F. Rusek and A. Prlja, “Optimal channel shortening for MIMO and ISI channels,” IEEE Trans. Wireless Commun., vol. 11, no. 2, pp. 810–818, Feb. 2012.
- [14] D. M. Arnold, H.-A. Loeliger, P. O. Vontobel, A. Kavčić, and W. Zeng, “Simulation-based computation of information rates for channels with memory,” IEEE Trans. Inform. Theory, vol. 52, no. 8, pp. 3498–3508, Aug. 2006.
- [15] R. Essiambre and R. W. Tkach, “Capacity trends and limits of optical communication networks,” Proc. IEEE, vol. 100, no. 5, pp. 1035–1055, May 2012.
- [16] R. Essiambre, G. Kramer, P. J. Winzer, G. J. Foschini, and B. Goebel, “Capacity limits of optical fiber networks,” J. Lightw. Technol., vol. 28, no. 4, pp. 662–701, Feb. 2010.
- [17] N. Merhav, G. Kaplan, A. Lapidoth, and S. Shamai, “On information rates for mismatched decoders,” IEEE Trans. Inform. Theory, vol. 40, no. 6, pp. 1953–1967, Nov. 1994.
- [18] P. Serena, A. Bononi, and G. Colavolpe, “On the nonlinear capacity with memory of PS-QPSK and PDM-QPSK in WDM non-dispersion managed links,” in Proc. European Conf. on Optical Commun. (ECOC’12), Sep. 2012, paper We.2.C.1.
- [19] G. Colavolpe and A. Barbieri, “On MAP symbol detection for ISI channels using the Ungerboeck observation model,” IEEE Commun. Letters, vol. 9, no. 8, pp. 720–722, Aug. 2005.
- [20] ITU-T G.675.1, “Forward error correction for high bit-rate DWDM submarine systems,” Feb. 2004.
- [21] A. Bononi, N. Rossi, and P. Serena, “On the nonlinear threshold versus distance in long-haul higly-dispersive coherent systems,” Opt. Express, vol. 20, no. 26, pp. 204–216, Dec. 2012.
- [22] A. Carena, V. Curri, G. Bosco, P. Poggiolini, and F. Forghieri, “Modeling of the impact of nonlinear propagation effects in uncompensated optical coherent transmission links,” J. Lightw. Technol., vol. 30, no. 10, pp. 1524–1539, May 2012.
- [23] A. Barbieri, D. Fertonani, and G. Colavolpe, “Time-frequency packing for linear modulations: spectral efficiency and practical detection schemes,” IEEE Trans. Commun., vol. 57, pp. 2951–2959, Oct. 2009.