Imaging the transition between pre-planetary and planetary nebulae: Integral Field Spectroscopy of hot post-AGB stars with NIFS
Abstract
We present 2–2.4 m integral field spectroscopy of a sample of hot post-AGB stars with early-B spectral types, using the NIFS instrument on Gemini North. These stars are just beginning to ionize their immediate environments and turn into planetary nebulae (PNe). We use molecular hydrogen emission lines together with hydrogen and helium recombination lines to explore the distribution of molecular and atomic gas and the extent of the developing ionized region. We see a range of evolutionary stages: IRAS 18062+2410 and IRAS 18379-1707 have recently developed compact and unresolved regions of photoionized H within axisymmetric molecular envelopes, with the former object increasing its Br flux by a factor of 5.3 in 14 years; IRAS 22023+5249 and IRAS 20462+3416 have extended Br nebulae and in the latter object only weak H2 emission remains; IRAS 19336-0400 is at a more advanced stage of PN formation where H2 is mostly dissociated and we see structure in both the H and He recombination line nebulae. IRAS 19200+3457 is the only object not to show the He I line at m and is probably the least evolved object in our sample; the H2 emission forms a ring around the star and we suggest that this object may be a rare example of a “round” pre-PN in transition to a “round” PN.
keywords:
circumstellar matter – stars: AGB and post-AGB – stars: evolution1 Introduction
In the early stage of post-asymptotic giant branch (post-AGB) evolution, stars have spectral types typically from K to F and the envelope material ejected on the AGB is seen in scattered and thermal emission from dust and in transitions from molecules such as CO and H2. These envelopes form pre-planetary nebulae (pre-PNe). Imaging studies of pre-PNe at optical and infrared (IR) wavelengths have resolved complex structures, with a wide range of bipolar, multipolar and point-symmetric morphologies seen in dust-scattered light (e.g. Ueta, Meixner & Bobrowsky 2000; Gledhill et al. 2001; Gledhill 2005; Ueta et al. 2005; Sahai et al. 2007; Ueta et al. 2007; Siódmiak et al. 2008) as well as in the thermal emission from dust (e.g. Meixner et al. 1999; Lagadec et al. 2011). Although the exact mechanism by which the shaping occurs is still debated, it seems likely that interaction between the mass-losing star and a nearby companion is involved (review by De Marco 2009). It is also apparent from the structures observed and their presence around later spectral type stars, that the shaping process must commence close to the end of the AGB (Ueta et al. 2000; Meixner et al 1999).
As the post-AGB star evolves to hotter temperatures and earlier spectral types it will begin to photodissociate and ionize the pre-PN material. The signatures of ionization, in the form of hydrogen recombination lines, become detectable for early-B spectral types and if evolution to this point occurs before the ejected material disperses into the interstellar medium, then a PN can form. Imaging surveys of young PNe in optical emission lines with HST show strong morphological similarities with the structure seen in the pre-PN phase (Sahai & Trauger 1998; Sahai, Morris & Villar 2011). These surveys select young PNe based on a O[III]/H flux ratio of less than one, corresponding to central stars with in the range K. The H ionization front in these PNe will typically have expanded to encompass all of the material shaped during the pre-PN phase.
| IRAS ID | Other Designation | Obs. Date | Exp. (s) | Integ. (s) | Standard | FWHM (arcsec) | AM |
|---|---|---|---|---|---|---|---|
| 18062+2410 | LSE 162, V886 He | 20070505 | 180 | 1440 | HIP 83274 | ||
| 18379-1707 | LS 5112, PM 2-37 | 20070508 | 200 | 1600 | HIP 96674 | ||
| 19200+3457 | LS II +341, ALS 10266 | 20070506 | 150 | 1200 | HIP 95414 | ||
| 19336-0400 | PN G034.5-11.7 | 20070522 | 400 | 1200 | HIP 102221 | ||
| 20462+3416 | LS II +3426, PN G076.6-05.7 | 20070528 | 150 | 600 | HIP 106674 | ||
| 22023+5249 | LS III +52 24, PN G099.3-01.9 | 20070530 | 85 | 1105 | HIP 103685 |
In the intervening transition stage between pre-PN and PN, the ionization front is beginning to break out of the central region, but most of the nebula material remains molecular. A population of objects thought to be in this transition stage has been identified (e.g. Parthasarathy & Pottasch 1989; Parthasarathy, Vijapurkar, Drilling 2000) and termed ’hot post-AGB stars’, but few imaging studies have been made so far. In these cases we cannot rely exclusively on recombination lines to reveal the nebula structure, but must also include tracers of the molecular material. We find that the -band between 2 and 2.4 m provides a convenient wavelength range for the investigation of these objects, containing a broad range (in excitation) of ro-vibration transitions of H2 as well as the Br and He I m recombination lines. The near-IR is also suited to studies of very early PNe in which the ionized region is expected to be compact and may therefore be optically obscured by circumstellar dust.
The purpose of this study is to image both the molecular pre-PN material and the developing ionized regions in objects that are in transition between the pre-PN and PN phases. The formation and structure of PNe is expected to depend specifically on how the ionization front develops and propagates through the circumstellar material shaped during the pre-PN phase. We use the Near-infrared Integral Field Spectrometer (NIFS) on the 8.2-m Gemini North telescope to investigate the spatial and spectral distribution of emission from neutral and ionized gas in a small sample of objects which are at the point of becoming PNe. Combined with adaptive optics (AO) correction, angular resolutions of up to 0.1 arcsec can be achieved in the -band, with a spectral resolution of about . We observe six post-AGB stars with B1I spectral types, which belong to the class of ‘hot post-AGB stars’. H2 emission has previously been detected spectroscopically in all six objects by Kelly & Hrivnak (2005; hereafter KH05). Radio emission from the ionized region is detected in four objects (Cerrigone et al. 2011).
2 Observations and data reduction
Observations were made in May 2007 using NIFS on the 8.2-m Gemini North Telescope (McGregor et al. 2002), programme number GN-2007A-Q-79. The K-G5605 grating resulted in a usable wavelength range of m in the reduced data, with each spectral channel being m wide, corresponding to approximately 30 km s-1 in the -band. The full-width at half-maximum (FWHM) in the spectral direction is approximately two channels, as measured from the arc lines. AO correction was achieved with the ALTAIR facility, using natural guide stars. Typically 4 pointings were observed for each target, so that the observed area on the sky is slightly larger than the arcsec field of view of NIFS.
Data reduction was accomplished using the Gemini IRAF package, driven in a semi-automated fashion using modified scripts from the Gemini NIFS web pages. The reduction stages included dark and flat-field correction, wavelength calibration, telluric correction and image combination, to form a final 3-dimensional data cube. The cube was then flux calibrated using an appropriate standard star. The reduction process results in a pixel size of arcsec. The point spread function (PSF) size in the reduced images, as measured from the standard star, is given in Table 1 for each target, along with other observational details. The FWHM does not vary by more than 0.02 arcsec across the NIFS wavelength range.
Visualization of the data cubes (along with extraction of images and spectra) used the GAIA image display tool and other applications from the STARLINK software collection. -band spectra were extracted by integrating within a circular aperture centred on each object, and are shown in Fig. 1 along with the aperture size.
To facilitate further analysis, the data cubes for each object were split in the wavelength dimension into smaller cubes, each containing an emission line (or group of lines if close in wavelength) and surrounding continuum. A linear fit to the wavelength-dependence of the continuum was made for each spatial pixel to produce a cube containing the estimated continuum emission. This was then subtracted from the object data cube to produce a continuum-subtracted cube containing only the line emission. These cubes were used to form images of emission lines and to measure the line flux.
| IRAS ID | 1-0 S(1) | 2-1 S(1) | 3-2 S(3) | He I | Br | Mg II | ||||
| 18062+2410 | 3.09 | 0.51 | 0.16 | 1.06 | 4.35 | 0.22, | ||||
| 18379-1707 | 6.26 | 1.16 | 0.50 | 1.32 | 0.67 | 0.21,0.09 | ||||
| 19200+3457 | 6.53 | 1.16 | 0.47 | nd | 1.41 | 0.13,0.07 | - | |||
| 19336-0400 | nd | nd | 0.54 | 13.83 | 0.03,0.01 | - | - | - | ||
| 20462+3416 | 0.15 | 0.03 | 0.02 | 2.41 | 1.59 | 0.35,0.17 | ||||
| 22023+5249 | 4.80 | 1.41 | 0.67 | 4.36 | 5.90 | 0.29,0.15 | ||||
| nd : not detected | ||||||||||
| a : blended with other line(s) | ||||||||||
| b : the emission forms a constant background over the field | ||||||||||
The flux in each emission line was obtained by performing aperture photometry on each spectral channel contributing to the line, using elliptical apertures adjusted to encompass all of the emission. These contributions were then summed to give the total line flux. This approach has the advantage that each channel image is inspected and artefacts (due to the IFU for example) can be recognized and excluded.
Deconvolved emission line images are presented for some objects and these were obtained using the LUCY task within the STSDAS package in IRAF. In each case, individual spectral channels contributing to an emission line were deconvolved using the corresponding (i.e same wavelength) channel from the PSF reference star and the resulting deconvolved channels combined to form the deconvolved line image.
3 Results and analysis
H2 emission is detected strongly in 5 out of 6 objects; IRAS 18062+2410, IRAS 18379-1707, IRAS 19200+3457, IRAS 20462+3416 and IRAS 22023+5249. The emission forms spatially extended nebulae exhibiting a variety of structures and we detect a rich H2 spectrum including several faint lines originating from high vibrational states. In the case of one object, IRAS 19336-0400111Hereafter we use abbrieviated IRAS designations for these objects, such as I19336., we see only weak H2 1–0 S(1), Q(1) and Q(3) lines which appear constant over the NIFS field-of view, with no obvious structure. The spectra are shown in Fig. 1 with key line fluxes and ratios given in Table 2. A complete list of detected H2 lines is given in Appendix B.
The -band H2 lines, and in particular their flux relative to the 1–0 S(1) transition, provide information on how the molecule is excited. The presence of higher vibrational lines, such as 8–6 O(3), means that the B-type central stars in these objects are photo-exciting H2. UV photons ( nm) can excite H2 via the Lyman and Werner bands, followed by decay to a vibrationally-excited level of the electronic ground state. Subsequent electric quadrupole decays through lower ro-vibrational states produce the H2 spectrum, including the higher vibrational transitions that we observe. A purely UV-pumped spectrum will result in characteristic values for the ratios of certain lines, such as 1–0 S(1)/2–1 S(1) and 1–0 S(1)/3–2 S(3) (e.g. Black & Dalgarno 1976; Black & van Dishoeck 1987).

Our measured values for the 1–0 S(1)/2–1 S(1) and 1–0 S(1)/3–2 S(3) line ratios lie in the range 3–6 and 7–20 respectively (Table 2), so that at first sight they may not seem consistent with UV-pumped excitation. However, in dense gas subject to intense UV radiation, excitation of the lower () vibrational levels of H2 can be significantly affected by collisional heating which acts to raise these ratios above their radiative values (Sternberg & Dalgarno 1989). The values we measure can be obtained in photodissociation region (PDR) models with gas densities greater than cm-3 and UV intensities times the interstellar value (Burton, Hollenbach & Tielens 1990). These values are likely to be encountered in our objects. We estimate average densities in the ionized regions to be to cm-3 (Table 4) so that it does not seem unreasonable to expect regions with density in excess of cm-3, especially if the gas is clumpy. The UV field at a distance of pc (1 arcsec at 4 kpc) from a B1 post-AGB star ( K, L⊙) is times the interstellar value, for 100 nm photons (equation A7 in Sterberg & Dalgarno 1989).
The lower vibrational levels of H2 can also be excited thermally by shocks in high velocity gas. The typical value for the 1–0 S(1)/2–1 S(1) ratio in molecular shocks is often quoted as , although a wide range of values is possible from 4 upwards (e.g. Shull & Hollenbach 1978; Smith et al. 1995). However, we see little evidence for shock structures in our objects, with the possible exception of I22023 (Sec. 3.6). In general, the H2 emission line spectra seem consistent with radiative excitation, giving rise to the high vibrational level transitions observed, combined with varying degrees of thermalisation of the level due to heating by UV radiation from the B1 spectral type central stars.
Br emission is seen in all objects confirming that these stars are beginning to photoionize their environments and create H II regions. In three cases (I19336, I20462 and I22023) the Br emission forms an extended nebula, giving an indication of the geometry of the ionized region. I18062, I19336 and I22023 have also been imaged at 8.4 GHz with the VLA (Cerrigone et al. 2008) and in the latter two cases resolved structure is seen which is consistent with that seen in Br.
We detect the m He I line in all objects except I19200. This line can be produced as part of the recombination spectrum of He+, indicating that the stars are becoming hot enough to singly ionize He. In I19336 we detect spatial structure in the He I 2.058 m emission and in two objects, I18379 and I20462, this line is stronger than Br. The He I 2.058/Br ratio is discussed further in Sec. 4.3.
In all objects apart from I19336 the continuum emission is not obviously extended and instead is dominated by a central point source (the FWHM of the PSF is listed in Table 1). In I19336 the extended continuum is likely to be due to free-bound emission. This is in contrast to earlier phase pre-PNe where the circumstellar material is often revealed by dust-scattered star light. Dust scattering around these more evolved hot post-AGB stars is not a major contributor to their near-IR emission and therefore broadband imaging at these wavelengths is not an effective tool for studying their circumstellar material. Instead, outflows in this phase are seen in molecular and atomic lines.
In Table 3 we give the heliocentric radial velocities obtained from gaussian-fitting the line centres. In two cases, I18379 and I22023, the H2 emission shows velocity structure across the object. We now discuss the results for individual objects in more detail.
| IRAS ID | Br | He I | 1–0 S(1) | Ref | |
| 18062+2410 | 26 | 47 | 38 | 1 | |
| 18379-1707 | -156 | -132 | -188-109 | -133 | 2 |
| 19200+3457 | -64 | nd | -52 | ||
| 19336-0400 | 55 | 93 | 75 | 20334 | 3 |
| 20462+3416 | -92 | -57a | -67 | -756 | 4 |
| 22023+5249 | -170 | -140a | -185-146 | -148.3 | 5 |
| nd : not detected | |||||
| : this line has a blue-shifted absorption feature | |||||
3.1 IRAS 18062+2410
This high galactic latitude () post-AGB star (SAO 85766, HD 341617) appears to have evolved rapidly, from a spectral type of A5 in the 1924 HDE catalogue to B1-1.5 based on a 1995 spectrum (Arkhipova et al. 1999). The evolution may be even more dramatic, as Parthasarathy et al. (2000a) point out that the spectral type was still consistent with A5I in 1973 UV observations, but had become B1I in their 1993 high resolution spectroscopy. This would correspond to an incease in effective temperature from to K in 20 years. Ryans et al. (2003) determine K and , from high-resolution optical spectroscopy and a non-LTE atmosphere model, placing the star close to the M⊙ post-AGB track of Blöcker & Schönberner (1990). A high remnant mass would seem consistent with the rate of spectral evolution, with the M⊙ model evolving from A5 to B1 in yr. Distance estimates range from 4.8 to 8.1 kpc (Arkhipova et al. 1999; Mooney et al. 2002).
The detection of low-excitation nebula emission lines such as [SII] and [NII] (Arkhipova et al. 1999; Parthasarathy et al. 2000a; Arkhipova et al. 2007) indicates that the object has just entered the PN phase. This is consistent with the observed linear increase in the 8.4 GHz radio flux density from 1.46 mJy in 2001 (Umana et al. 2004) to 2.7 mJy in 2009 (Cerrigone et al. 2009), which is interpreted as an ionization front expanding at km s-1 through the envelope (Cerrigone et al. 2011). Their model predicts an ionized region with outer radius arcsec assuming a distance of kpc. The object was not resolved in 8.4 GHz VLA observations with a beam size of 0.2 arcsec (Cerrigone et al. 2008). Based on the linear increase in 8.4 GHz emission, these authors suggest that the ionization began around 1991.
Optical spectroscopy shows carbon underabundance (Ryans et al. 2003; Parthasarathy et al. 2000a) and observations with ISO and subsequently Spitzer show strong amorphous silicate emission features peaking at 10.8 and 17.6 m, with no evidence for the PAH features seen in C-rich or mixed chemistry sources (Gauba & Parthasarathy 2004; Cerrigone et al. 2009). Both of these authors model the SED as a spherical shell of silicate dust using the DUSTY code with an inner shell radius of cm (0.1 arcsec at 6.4 kpc). This places the dust emission region just outside the central ionized region.
Cerrigone et al. (2009) estimate an envelope mass from the SED fit of M⊙, assuming a gas-to-dust ratio of 200. Although this will be an underestimate of the true envelope mass, especially as there are no submm/mm SED constraints on the contribution from cold dust, it is surprisingly low if the star has evolved from an initial mass of M⊙ to a post-AGB mass of 0.836 M⊙ and if the post-AGB evolution has taken years (Ryans et al. 2003). Ryans et al. (2003) note that an error in their estimation of of dex would place the star on a significantly lower-mass post-AGB track, with a consequently longer evolutionary timescale over which the envelope material may have dissipated. However, the rapid increase in Br and radio flux lends support to a shorter evolutionary timescale.
Our NIFS spectrum is shown in Fig. 1. We see strong Br and He I 2 (2.058 m) lines, centred on the continuum peak and spatially unresolved, associated with the central ionized region. The Br flux has increased by a factor of from the 1993 measurement of García-Hernández et al. (2002) to W m-2 in our 2007 NIFS data. KH05, measure an intermediate flux of W m-2 in 1999, so that the increase in Br between 1993 and 2007 is linear. Projecting this trend to earlier times suggests that photoionization began around 1990. This is consistent with the linear trend in the 8.4 GHz flux over the same period; as the ionization front expands through the envelope, the free-free and recombination emission should scale in the same way with the increasing volume of ionized material.
We have combined the continuum channels, avoiding prominent emission lines, to produce an image of the continuum emission. However, we find that there is no indication of an extended dust-scattered continuum in I18062; this is again suprising if the star has lost several solar masses of material on the AGB and then rapidly evolved through the post-AGB stages. This is a common theme for the hot post-AGB stars in this study; although we detect extended molecular and/or atomic emission, there is little evidence for any extended dust scattering region.
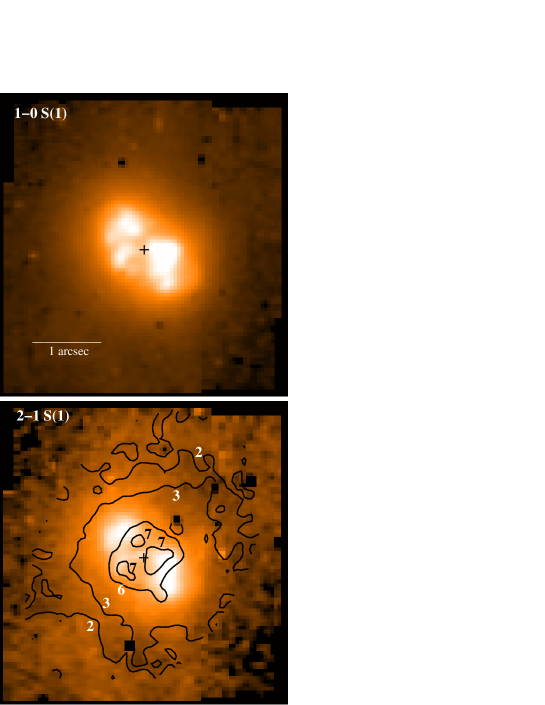
Fig. 1 shows that all v=1–0, 2–1 and 3–2 H2 transitions within the wavelength range are present. In addition we see higher vibrational lines such as 4–3 S(3), 8–6 O(3) and 9–7 O(3). We measure a flux of W m-2 in the 1–0 S(1) line, which, in contrast with Br, is the same as the 1993 measurement of García-Hernández et al. (2002) and close to the 1999 value ( W m-2) obtained by KH05. In 1993 the 1–0 S(1) line was 3.8 times stronger than the Br whereas in 2007 Br was 1.4 times stronger.
Fig. 2 (top) shows the continuum-subtracted 1–0 S(1) emission, providing the first image of the extended nebula in this object. The centroid of the continuum and recombination line emission is marked with a plus sign, scaled to have the same size as the central radio-emitting region (radius 0.06 arcsec from Cerrigone et al. 2011). On either side of this position we see peaks of H2 emission, with clumpy structure. The peaks are offset by arcsec from the continuum centroid. Images of the higher vibrational level transitions, such as 2–1 S(1), 3–2 S(3) and even 8–6 O(3), have a very similar appearance so that the H2 emission from these peaks is at least partly due to UV pumped fluorescence. Faint extended emission can be seen in the 2–1 S(1) line (Fig. 2 bottom), along PA °. This morphology is similar to that of IRAS 19306+1407, a B0/B1 post-AGB star, where arcs of clumpy H2 emission are seen on either side of the star and along a line perpendicular to a larger-scale bipolar nebula (Lowe & Gledhill 2006). A key difference is that in the case of I19306, the arcs correspond to a dusty torus seen in near-IR polarized light images (Lowe & Gledhill 2007) whereas, as noted above, we do not see any evidence for extended dust-scattered light in I18062. We also obtained imaging polarimetry for I18062 in 2006 using the UK Infrared Telescope and the same set-up as for I19306, but failed to detect any intrinsic polarization in the - or -bands.
The 1–0 S(1)/2–1 S(1) and 1–0 S(1)/3–2 S(1) line ratios are in the range and respectively in the region of the peaks, decreasing to and , typical of a UV-pumped spectrum, in the fainter outer regions (as measured from line ratio images. Contours of the 1–0 S(1)/2–1 S(1) line ratio are shown in Fig. 1. These ratios are consistent with the lower vibrational levels being thermally excited to some degree in the region of the peaks, where the gas density and UV intensity are expected to be higher, whereas in the lower density outer regions of the nebula further from the UV source, they retain their radiative values.
Davis et al. (2003) measured and , respectively, for 1–0 S(1)/2–1 S(1) and 1–0S(1)/3–2 S(1) in 2001, using an E-W-oriented arcsec-wide slit which would have included the central peaks. However, the 1999 line ratios quoted by KH05 are 3.8 and 9.6, which are more comparable with our line ratios for the outer faint material. This is due to their 2–1 S(1) and 3–2 S(1) line fluxes being significantly higher than ours. Although KH05 used a wider ( arcsec) slit than Davis et al. (2003), their measurements should still be dominated by the bright central emission. It is not clear why these line ratios should have decreased in the 2 years between the measurements of KH05 and Davis et al., and then remained constant until our 2007 measurement.
We also note emission at 2.1375 m, centred on the star and spatially unresolved, which we believe to be a component of the Mg II doublet (rest wavelengths 2.1375 and 2.1438 m). The longer wavelength component is blended with other unidentified lines. The Mg II doublet is common in hot B-type stars with photoionized regions and is present in all our spectra (Sec. 4.2).
3.2 IRAS 18379-1707

I18379 (LSS 5112) is classified as a hot post-AGB star by Parthasarathy, Vijpurkar & Drilling (2000) with a spectral type of B1IIIpe and IRAS colours typical of pre-PNe and PNe. Gauba & Parthasarathy (2004) model the double-peaked infrared SED as a spherically-symmetric detached circumstellar envelope and determine an inner angular radius of 0.64 arcsec, assuming silicate dust grains. Spitzer observations by Cerrigone et al. (2009) show the dust to have a mixed chemistry, with emission in the near-IR PAH bands as well as the 10 m silicate feature. These authors also present a DUSTY model of the continuum and SED, using a silicate-only dust composition, but a hotter stellar temperature (24 000 K) than Gauba & Parthasarathy (2004) (19 000 K). Interestingly the object is not detected in the radio at 3.6 cm (Umana et al. 2004).
The spectrum (Fig. 1) shows Br and He I emission, which is centrally located and spatially unresolved, indicating a still-compact ionized region. Br is weaker than He I in our data ( and W m-2 respectively), although the Br line sits on a depression in the continuum which may lead to a slight underestimate of the flux; KH05 quote W m-2 for their 1999 Br measurement.

KH05 detect H2 emission with a E-W spatial extent of 3 arcsec, including the 1–0 S(0) and S(1), 2–1 S(1) and 3–2 S(3) lines, and a 1–0 S(1)/2–1 S(1) line ratio of 3.1. They suggest a thermal contribution to the H2 excitation of 40 per cent. KH05 note an unidentified line at 2.154 m, which is not present in our spectrum. However this is close to the 2–1 S(2) line which extends to 2.1535 m (the H2 lines are doppler broadened, see below). We detect all the H2 lines identified in I18062, with the addition of 7–5 O(5). We also note Mg II emission at 2.1362 and 2.1426 m, centred on the star and spatially unresolved.
The detailed structure of the H2 nebula can be seen in the NIFS images shown in Fig. 3, each summed over the width of the respective line. Hrivnak, Kelly & Su (2004) show a HST narrowband image of the 1–0 S(1) emission, with a ring-like structure which the authors interpret as an equatorial disc. Our images show that the emission takes the form of an oval shell of dimensions arcsec oriented with long axis at 38°E of N, and a bar-like feature across the minor axis of the shell which appears to curve round at the ends and merge into the rim of the SW half of the shell. In the 1–0 S(1) line the equatorial bar is much brighter than the shell, but this contrast diminishes for the higher vibrational transitions.
The 1–0 S(1)/2–1 S(1) and 1–0 S(1)/3–2 S(3) line ratios are shown as contours in Fig. 3 and have values of typically and respectively in the bar, but drop to 2 and at the NE and SW tips of the shell. As in the case of I18062, this is consistent with high densities ( cm-3) and UV intensities ( times interstellar) in the inner regions, which act to drive the line ratios from their UV-pumped values towards thermal values (Sternberg et al. 1989; Burton et al. 1990). In the outer shell the line ratios retain their UV-pumped values as would be expected in a lower density and less UV-intense environment further from the source.
We detect radial velocity structure in the H2 emission across this object spanning 80 km s-1 (Table 3). Fig. 4 shows a “velocity map” obtained by gaussian-fitting the 1–0 S(1) line centre at each spatial position and converting to heliocentric radial velocity. The structure would be consistent with a bipolar outflow tilted so that the NE/SW rims are approaching/receeding.
3.3 IRAS 19200+3457

This object is listed as a H emission-line star (StHA 161) in the catalogue of Stephenson (1986). Optical and infrared photometry (Gauba et al. 2003) shows a double-peaked SED, typical of a post-AGB object with a dust envelope. Low-resolution spectroscopy (Arkhipova et al. 2004) indicates a B-type star, with hydrogen lines in emission which are variable and associated with the circumstellar envelope. These authors note that the star shows irregular brightness changes, similar to I18062. Emprechtinger et al. (2005) and Suarez et al. (2006) also detect H in emission, however Suarez et al. (2006) give the object a Fe spectral classification. Spitzer spectroscopy (Cerrigone et al. 2009) shows strong near-IR emission features often attributed to PAHs as well as a broad 30 m feature that may be due to MgS. The absence of silicate features leads them to classify the object as C-rich. KH05 detect H2 emission with a line ratio of 1–0 S(1)/2–1 S(1), inferring a thermal origin for per cent of the H2 emission. They measure a Br flux of W m-2.
We show the first resolved images of the circumstellar envelope in Fig. 5; the H2 emission takes the form of a roughly-circular ring with an average radius of about 0.8 arcsec. The interior of the ring contains emission, so that a likely configuration is a thin shell with edge brightening. Alternatively, but less likely, the object may have a bipolar structure oriented pole-on. We discuss the morphology of this object in more detail in Sec. 4.4.
The ring deviates from circularity, bulging out to the SW slightly. The distribution of 1–0 S(1) and 2–1 S(1) emission around the ring also differs; the W side of the ring is fainter in 1–0 S(1) than the E side, whereas this is not the case for 2–1 S(1). This leads to a 1–0 S(1)/2–1 S(1) ratio of in the E side and in the W side (see Fig. 5). The average value of is comparable to that of KH05. The equivalent values for the 1–0 S(1)/3–2 S(3) ratios are , and .
The nebular structure is similar in other lines of H2, and all of the stronger lines are detected (Fig. 1). We also detect Br with a flux of W m-2 but do not detect the 2.058 m line of He I. This is the only object in our sample in which the He I line is not detected. The Br emission is not spatially resolved, and has the same centroid and FWHM as the continuum. We detect the Mg II doublet lines at and m. A smaller aperture centred on the star shows the hydrogen Pfundt series (inset spectrum).
3.4 IRAS 19336-0400
A summary of some of the properties of this object from the literature is given by Arkhipova et al. (2012); they present UBV photometry and find that the star exhibits the irregular brightness fluctuations seen in other B-type post-AGB objects, which they attribute to an unsteady stellar wind. Optical spectroscopy shows Balmer lines in emission as well as forbidden lines such as [NII], [SII], [OI], suggesting a B1 supergiant and a very young and low-excitation PN (Downes & Keyes 1988; Van de Steene et al. 1996; Parthasarathy et al. 2000b; Pereira & Miranda 2007). The object is detected in the radio with a flat spectrum between 1.4 and 8.4 GHz ( cm) (Van de Steene & Pottasch 1995; Umana et al. 2004) indicating an optically thin nebula at these frequencies and being consistent with the earliest stages of the ionization-bounded phase (Umana et al. 2004). Further radio monitoring by Cerrigone et al. (2011) shows that the radio flux has not varied significantly between 2001 and 2009. Observations with Spitzer show a mixed chemistry with both PAH-like and silicate features evident, with crystalline silicate features also present (Cerrigone et al. 2009).
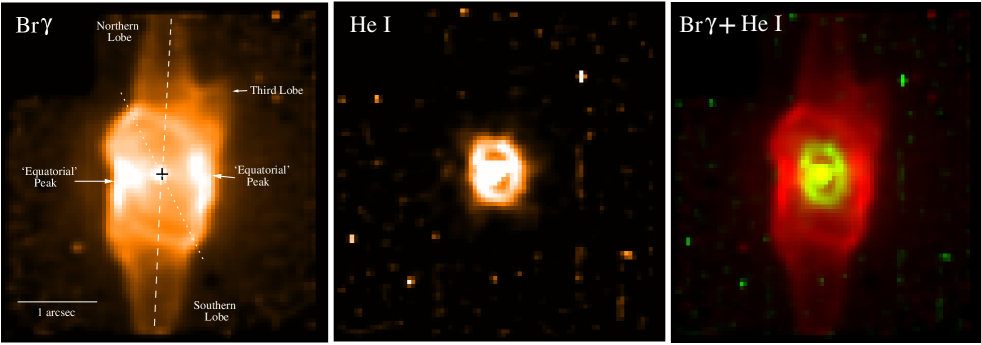
KH05 report that this is the only object in their sample where the Br line is stronger than the 1–0 S(1) H2 line with fluxes of and W m-2 respectively. We detect weak 1–0 S(1), Q(1) and Q(3) lines, but the emission appears constant across the NIFS field-of-view, with no discernible structure. This is consistent with KH05’s observation that “the H2 1–0 S(1) line extends for 11 arcsec along the slit, with a fairly constant brightness distribution”. As we have imaged only a small part of the H2 emission, we do not give a flux measurement. Our Br flux is W m-2. In Fig. 6 (left) we show the Br image, deconvolved with the standard star and with a square-root scaling to display both the bright and faint emission. The object is clearly bipolar, with two narrow, tapering edge-brightened lobes, extending beyond the edge of our field ( arcsec from the star) at a PA of 358° E of N (shown as a dashed line in the Figure). There is evidence for a third, smaller lobe to the NW of the star. The brighter part of the nebula is bounded by a rim of emission, which appears stretched along a PA of 26°, shown by the dotted line. This line joins two brighter spots of emission on the rim. These various structures and axes give the object a multi-polar appearance. The brightest emission lies along a line perpendicular to the main lobes, most likely corresponding to an enhancement in the gas density in the plane perpendicular to the bipolar axis. These bright “equatorial peaks” can be clearly seen in the GHz image of Cerrigone et al. (2008). We have also deconvolved the He I image using the standard star, to reveal a ring of emission (Fig. 6 middle) with extent arcsec and PA 10° E of N. The He I ring sits within the cavity of the Br nebula, as shown in the righthand panel.
The continuum image of the object is dominated by the bright central star although there is faint emission, with structure similar to that of the Br image, so this is likely due to free-free and free-bound continuum rather than scattering from dust.
We again see the Mg II emission lines, at 2.1378 and 2.1442 m. The separation is m and the flux ratio approximately 2:1, as for the other objects. Although the lines are faint, the emission is strongest in the “equatorial peaks”. The Pfundt series is visible to the 21–5 line at m; images of the Pfundt emission have a similar structure to that of the Br emission, as expected.
3.5 IRAS 20462+3416

I20462 was identified as a hot post-AGB star at a distance of kpc (Parthasarathy 1993), having previously been classified as a population I B1.5 supergiant at large distance (Turner & Drilling 1984). Photometric and spectroscopic variations are thought to be due to stellar pulsations and ongoing mass loss (García-Lario et al. 1997; Arkhipova et al. 2001). The mid-IR spectra show PAH as well as crystalline silicate features (Cerrigone et al. 2009). The object is detected at radio frequencies between 1.4 and 22.2 GHz with a flat spectrum (spectral index -0.02) apart from the 22.4 GHz measurement which shows an excess possibly due to cold dust (Cerrigone et al. 2008, 2009).
We detect strong Br and He I emission from this object, with fluxes of and W m-2 respectively. The Br is clearly extended, forming a boxy nebula with dimensions arcsec oriented along a PA of 49° (Fig. 7 top). We have deconvolved the image using the standard star, to highlight the edge-brightened structure of the nebula and also reveal faint emission extending to the NW and SE (Fig. 7 middle). The object is also extended in the and band HST imaging of Ueta et al. (2000), forming a faint elliptical nebula of arcsec with a similar orientation. The Br nebula appears to sit inside the optical nebula, which has a limb-brightened shell appearance in the HST images.
The 1–0 S(1) image is shown in Fig. 7 (bottom). There appears to be faint H2 emission covering our arcsec field, which is consistent with KH05’s observation that the emission extends over 12 arcsec along their arcsec-wide EW-oriented slit. There is also a concentration of H2 emission arcsec to the NW of the star with an arc-like feature below it, located along the major axis of the extended Br nebula (shown contoured in the Figure). The faint emission covering the field is blue-shifted by one spectral channel (m) relative to the other H2 features, and may represent the front surface of a molecular envelope, surrounding the dust shell and ionized region.
All 1–0 transitions in the wavelength range are detected, along with 2–1 S(1) and 3–2 S(3). The flux measured in the 1–0 S(1) line is W m-2, and the 1–0 S(1)/2–1 S(1) line ratio is . The He I emission is spatially unresolved in our observations and displays a clear blue-shifted P Cygni absorption feature, with a velocity separation of km s-1 from the emission peak, or km s-1 from the peak to the blue edge of the absorption. P Cygni profiles are also seen in optical H and He lines and indicate ongoing mass loss from the star (García-Lario et al. 1997; Arkhipova et al. 2001).
KH05 report “additional lines” at and m; the m line may be H2 S(2), which we do not detect. As in all our targets, we also detect the Mg II doublet in this object, at and m with an intensity ratio of approximately 2:1 (Table 2). Both these lines appear spatially extended beyond the central peak, with faint emission extending over the region covered by the Br nebula.
3.6 IRAS 22023+5449
Sarkar et al. (2012) classify this object as a hot B0-B1 post-AGB star, with K, , using a high-resolution () optical spectrum. They note P Cygni profiles in the Balmer and He lines, suggesting on-going mass loss. Multi-frequency radio observations give a spectral index in agreement with an optically thin shell model (Cerrigone et al. 2011). KH05 detect a number of H2 emission lines with spatial extent arcsec including the 9–7 O(3) transition. They also note that the Br line has an extent of 2–3 arcsec.
The H2 spectrum (Fig. 1) is particularly rich, with all lines listed by Black & van Dishoeck (1987) in our wavelength range detected, including vibrational states up to v=10. We see strong Br and Pfundt series lines (inset spectrum) and the weaker Mg II doublet. The He I line at 2.058 m is strong and has a P Cygni absorption profile, blue shifted from the line peak by km s-1.
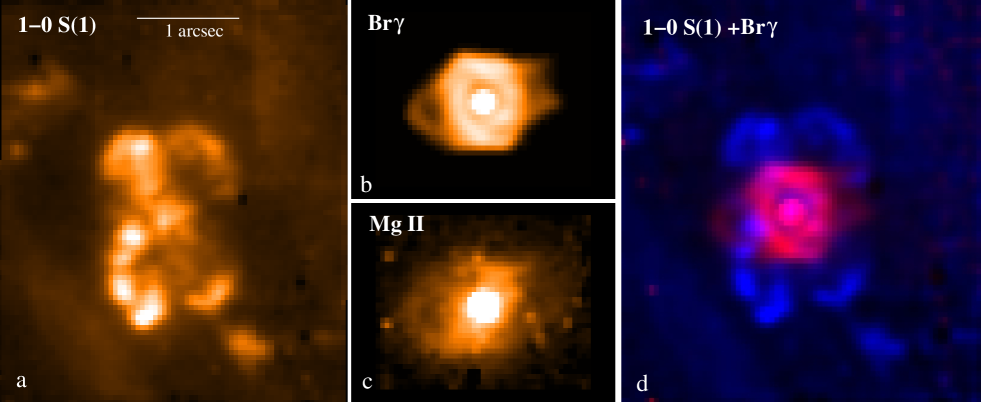
In Fig. 8(a) we show the continuum-subtracted image of the 1–0 S(1) line. As well as faint diffuse emission extending over much of the NIFS field, we see a number of bright distinct knots and curved features, reminiscent of bow shocks, arranged around the stellar centroid. Two fainter knots are offset arcsec from the star to the NE and SW. The Br emission is also spatially extended (as noted by KH05) and a deconvolution using the standard star is shown in Fig. 8(b). The Br forms a 0.6 arcsec-diameter ring-like structure around the star, with a fainter elliptical shell or bubble extending along PA 100°, which appears open to the NW. There is a central unresolved peak of Br emission. The Br image (red) and 1–0 S(1) image (blue) are shown together in Fig. 8(d) to illustrate the relative location and extent of the photoionized region and molecular emission. We also see extended emission from the Mg II lines at 2.1362 and 2.1424 m, with a structure similar to that of the Br line, showing an extended elliptical shell or bubble but without the ring structure seen in Br; we show the summed images of these two lines in Fig. 8(c). The He I emission is centrally located and not resolved.
We would expect the free-free emission seen at radio wavelengths to show similar structure to the H recombination lines, and indeed most of the 8.4 GHz emission is located in a central 1 arcsec-diameter region (Cerrigone et al. 2008). However, the 8.4 GHz image also shows two protrusions of emission extending out to arcsec from the star along PA°, which do not appear to correspond to any of the recombination line structures seen in our data. It is possible that these extensions represent structures distinct from the photoionized region, and instead may be related to jets, as suggested by Cerrigone et al. (2008).
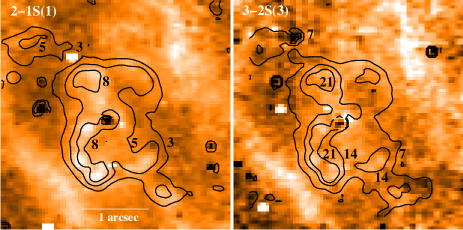
In constrast to the v=1–0 H2 transitions, which are strong in the central knots and arcs, higher vibrational transitions appear more prominent in the diffuse nebulosity at larger angular offset from the centre. This is shown in Fig. 9 for the 2–1 S(1) and 3–2 S(3) lines, where in the latter case the knot structure is almost absent. This leads to variation in emission line ratios across the object: the 1–0 S(1)/2–1 S(1) ratio is in the knots, and in the diffuse nebulosity. The 1–0 S(1)/3–2 S(3) ratio varies from in the knots, and in the diffuse nebulosity. As discussed for I18062 and I18379, this is consistent with a degree of thermalization of the lower vibrational level populations in the denser region of the knots, whereas the line ratios in the diffuse regions have their UV-pumped values, typical of a low-density gas. However, if jets are present in this object then heating of the gas by shocks may be important. As mentioned earlier, some of the knots resemble bow shocks.
We see radial velocity structure across the object in the H2 lines (Fig. 10), with a split between blue-shifted emission to the W of the star and red-shifted emission to the E.
4 Discussion
4.1 The photoionized region
Br emission is detected in all 6 objects, indicating that photoionization of the circumstellar environment has begun. In I18062, I18379 and I19200 the photoionized region is still too compact to spatially resolve in our observations whereas for I19336, I20462 and I22023 we see a Br nebula. We can use the angular extent of the ionized region and the Br flux to estimate the hydrogen number density and the mass of ionized material , assumng a constant density spherically symmetric ionization region (see Table 4 and Appendix A).
For the 3 objects with resolved photoionized regions we find cm-3 whereas the unresolved objects have higher density, cm-3 with I18062 being the most dense, which would be consistent with it being in the early stages of photoionization. We have used a radius of 0.06 arcsec for the ionized region in I18062, consistent with the Cerrigone et al. (2011) radio model. They find that the ionized mass increased from to M⊙ between 2003 and 2009, which agrees well with our estimate, considering the approximate nature of our calculation. For I18379 and I19200 we can only place upper limits on the radius of the ionized region and hence lower and upper limits, respectively, on the density and ionized mass.
| IRAS ID | ||||
|---|---|---|---|---|
| kpc | arcsec | cm-3 | M⊙ | |
| 18062+2410 | 6.4a | 0.06a | 2.0 | |
| 18379-1707 | 3.7b | |||
| 19200+3457 | 3.8c | |||
| 19336-0400 | 4.0d | 1.5 | 140 | |
| 20462+3416 | 3.8e | 0.6 | 10.6 | |
| 22023+5249 | 3.9b | 0.7 | 27.3 | |
| aCerrigone et al. (2011); bGauba & Parthasarathy (2004); | ||||
| cGauba, Parthasarathy et al. (2003); dCerrigone et al. (2008); | ||||
| eParthasarathy (1993) | ||||
Ionized masses are M⊙ and M⊙ for objects with unresolved and resolved ionized regions respectively, with the exception of the most extended object I19336. Bearing in mind the uncertain distances, this is consistent with the unresolved objects being at a relatively early stage in ionizing their envelopes. The ionized mass in I19336 is of the same order of magnitude as the envelope mass (Cerrigone et al. 2009), so that the ionization front has propagated through the nebula and most of the molecular material has been dissociated (as indicated by the very weak H2 emission in this object).
It is, however, evident from the structure in these emission line nebulae that the ionized regions are not spherically symmetric and the assumption of constant density is not realistic, especially once the ionization front encounters material shaped during the pre-PN phase. The values in Table 4 are intended as order of magnitude estimates.

4.2 Mg II lines
The Mg II doublet, resulting from the (m) and (m) transitions, is seen in each of our targets (see Table 2). The and levels can be populated from the Mg+ ground state by line overlap with Ly (Bowen 1947) with a velocity difference of 73 and 116 km s-1, respectively (e.g. Simon & Cassar 1984). The Mg II doublet has been noted in the PN Hubble 12 (Hb 12) (Luhman & Rieke 1996) where the assumption of a Ly line wide enough to fluoresce both levels leads to an expected Mg II line ratio of 2 to 1, which is consistent with our observations.
The Mg II emission in our targets is very strong with respect to Br, with a ratio greater than in all cases apart from I19336, the object with the most extended region of ionized emission, with Mg II/Br. Luhman & Rieke (1996) measure Mg II/Br towards the centre of Hb 12. Where the Br emission is extended (I19336, I20462, I22023), the Mg II emission shows the same extended structure. The flourescence process appears to be very efficient, suggesting that Ly is optically thick in these very early PNe and that there are velocity gradients in the ionized region allowing the line overlap to occur.
4.3 He I 2.058 m/Br ratios
Photons with energies greater than 24.6 eV (m) are capable of ionizing He as well as H, and as the number of these photons increases with increasing of the central star, a volume of singly ionized He will develop at the centre of the H+ region. Recombination of He+ can populate the 2 state with the 22 transition resulting in emission of a He I m photon (we use a rest wavelength of m calculated from the energy levels quoted in Benjamin et al. 1999). The He+ region is expected to extend throughout the H+ region for stars with greater than about 40 000 K (e.g. Shields 1993), corresponding to a spectral type of O5I (Martins, Schaerer & Hillier 2005). For our cooler B1 stars, the radius of any He+ zone should be considerably smaller; if we assume that the ratio of the ionizing fluxes with eV and eV is for a B1I star (see fig. 17 of Martins et al. 2005), a helium fraction , and spherical symmetry then, using equations 15.35 and 15.36 of Draine (2010), the radius of the He+ zone will be that of the H+ zone. This fits with our observations of I19336, which has the most extended Br nebula with an extent of arcsec and a resolved He I extent of arcsec. In the case of I20462 and I22023 which have equal to 0.6 and 0.7 arcsec respectively (Table 4), the He I emission is still not spatially resolved in our data.
We detect the He I line in all targets apart from I19200, indicating that He+ is present in these objects. The strength of this line relative to hydrogen Br will depend on the relative volumes of recombining helium and hydrogen, and hence on the effective temperature of the exciting star. However there are a number of issues that complicate the interpretation of the He I 2.058 m/Br ratio. The 2 level can also decay to 1 resulting in a m photon. Treffers et al. (1976) point out that this line must be optically thick to avoid depopulating the 2 state; the m photons then scatter within the nebula and are converted into m photons by a process of resonant fluorescence, substantially enhancing the m emission. The efficiency of this process is reduced, however, if the short wavelength photons are intercepted by dust or neutral hydrogen within the H II region (Shields 1993). Also, for gas densities greater than cm-3, collisional transfer from the metastable triplet 2 state becomes the principal route to populate 2, so that the m emission scales with density as well as with .
Depoy & Shields (1994) calculate the He I 2.058 m/Br ratio for a grid of (, ) values using the CLOUDY photoionization code and parameter values applicable to planetary nebulae. For a given density, their He I 2.058 m/Br ratio increases with , peaking around K, before declining again as He+ is ionized to He++ at high temperatures. For a given , the He I 2.058 m/Br scales with due to collisional population of 2. For K (the minimum temperature in their plot) we find that He I 2.058 m/Br and require cm-3 and cm-3 respectively. The B1 stars in our sample will be cooler, K, and so should be higher for the same line ratios. This is consistent with our average density estimates (Table 4) where is in the range .
4.4 Dust and morphology
The SEDs of our NIFS targets are double-peaked, with a dust emission peak in the mid-IR, between 20 and 30 m (Cerrigone et al. 2009). They belong to the Type IVb SED class of van de Veen, Habing & Geballe (1989) produced by post-AGB stars surrounded by optically thin dust envelopes. At optical wavelengths, these objects often appear as bright stars surrounded by faint reflection nebulosity, some with multiple symmetry axes, and were termed SOLE (Star-Obvious Low-level-Elongated) objects by Ueta et al. (2000); in mid-IR images they may appear “toroidal” with two peaks of emission, one on either side of the star (e.g Meixner et al. 1999).
Only one of our targets, I20462, has previous optical imaging; it appears in and filter WFPC2 images as a faint elliptical reflection nebulosity surrounding the bright star (Ueta et al. 2000). If we assume that the dust-scattered intensity of the nebulosity varies as a power law with wavelength, so that , then the values of Ueta et al. for the specific intensity in the nebulosity in the and filters (their Table 1) suggest that . Assuming that this wavelength dependency continues into the IR then we would expect roughly W m-2 arcsec-2 due to scattered continuum per spectral channel at m. This is close to the noise level in our NIFS data, and equivalent to about 10 per cent of the surface brightness in Br in the faint regions of the nebulosity (Fig. 7). We have not detected any extended continuum above this level outside the region of the Br nebula. Imaging polarimetry in the band (Gledhill 2005) shows a faint reflection nebula of radius arcsec around the star, with some evidence for a concentration of scattering material along the minor axis of the Br and optical nebulae. I20462 is the only B-type SOLE object in the compilation of Ueta et al. (2000), other targets being proto-PNe with cooler F-G spectral type central stars. These younger objects are clearly more dusty, with brighter reflection nebulosites, also detected in the near-IR (Gledhill et al. 2001; Gledhill 2005).
None of the hot post-AGB objects in our NIFS sample show evidence for extended dust envelopes, so they are similar in this respect to I20462, and would likely appear at optical wavelengths as faint reflection nebulosities around bright central stars. This similarity is underscored by their location in the two-colour vs. 222 compares the band flux to the IRAS m flux, defined as in Ueta et al. (2000). diagram, where they occupy similar locations to I20462 (Fig. 11). With the exception of I19200, the hot post-AGB stars lie to the right of the pre-PNe (F to G spectral type) SOLE objects, in a region also occupied by ionized PNe such as Hb 12.

Spectroscopy with Spitzer shows that I19200 is the only C-rich object in our sample, I18062 being O-rich and the remaining four targets having mixed envelope chemistries with both O-rich and C-rich features (Cerrigone et al. 2009). These authors find that 40 per cent of their sample of hot post-AGB stars have mixed chemistry, compared with an expected fraction of less than 10 per cent, and link this to the presence of a dusty torus which renders these objects bright in the mid-IR and therefore more likely to appear in IR-selected samples. A correlation between mixed chemistry and a torus is noted in Galactic bulge PNe by Guzman-Ramirez et al. (2011) who conclude that in these objects the mixed chemistry arises due to UV irradiation of a dense torus. The mixed chemistry objects in our sample also have morphologies in H2 or Br which are consistent with the presence of a torus and in I18379 and I22023 we also see velocity structure in the H2 lines consistent with bipolar outflow.
I19200, however, is located in a region of the versus diagram occupied by cooler G and F-type SOLE pre-PNe (Fig. 11), having a bluer colour than our other targets. The m flux is 4 times weaker than that of I19336 and 10 times weaker than that of I18379 and I22023. This suggests that I19200 is less dusty, and has ejected a lower-mass envelope than the other objects. This is supported by modelling of the thermal dust emission which gives a total envelope mass of M⊙ (Cerrigone et al. 2009). The weak mid-IR continuum from I19200 makes it unlikely that this object harbours a dusty torus, which would be consistent with its C-rich nature. In a Spitzer survey of 140 young Galactic PNe, Stanghellini et al. (2012) find that C-rich PNe tend to be more symmetric (i.e. round or elliptical) than O-rich or mixed chemistry nebulae.
The H2 emission in I19200 appears as a ring around the stellar position with a radius of 0.8 arcsec. As noted in Sec. 3.3, the ring bulges out slightly to the SW. The H2 quadrupole transitions are optically thin and so trace the distribution of molecular material. The simplest interpretation is that the H2 emission region forms a shell around the star and may have a mildly ovoid geometry.
It is possible that I19200 has a more axisymmetric structure, such as an hourglass or cylinder, and is viewed pole-on. The bulge PN G357.2+02.0 may be such an object, appearing perfectly ring-like in H images but having a velocity profile in [O III] which suggests a more complicated geometry (Gesicki et al. 2014); this object also has mixed chemistry (Stanghellini et al. 2012). The C-rich nature of I19200, its weak mid-IR flux when compared with our other targets which do show axisymmetry, and the circular projection of the H2 emission on the sky collectively lead us to believe that this object most likely has a shell-like envelope. We do not detect a variation in radial velocity across the shell in the 1–0 S(1) line with an upper limit of 15 km s-1. In addition, the velocities obtained from the 1–0 S(1) and Br lines agree within error (Table 3), even though these lines are emitted on very different spatial scales, which suggests that they are systemic velocities.
I19200 may be evolving into a “round” PN, a rare morphological group comprising less than 4 per cent of PNe in the survey of Sahai et al. (2011). These objects may arise from the post-AGB evolution of single stars which, lacking a binary companion, do not develop fast collimated winds and instead expel a spherical, low mass shell (Soker 2002). So far no round pre-PNe have been discovered (Sahai et al. 2011, 2007), most likely because their dust envelopes are too tenuous to be detected by scattered light.
4.5 Evolutionary status of the objects
I19200 is the only object in our sample without a He I detection, so that it is not yet hot enough to ionize He and is therefore likely to be the least evolved object. Arkhipova et al. (2004) detect strong but variable H and H emission between 2001 and 2003 and classify the star as early B-type. H was also detected in 2003 by Emprechtinger et al. (2005). However Gauba et al. (2003) did not detect H in their 2000 observations and Suarez et al. (2006) classify the star as Fe. The hydrogen densities and ionized masses determined from the Br emission (Table 4) are also consistent with the recent onset of photoionization.
I18062 and I18379 are very young PNe. Both objects show Br and He I emission indicating ionized H and He, but their photoionized regions are still unresolved in our observations and have densities cm-3. I18062 appears to have evolved rapidly in spectral type over the last few decades, with a linearly increasing Br and radio flux pointing to the onset of ionization around 1990, so that we are witnessing the birth of this PN. Both objects also have an axisymmetric structure to their molecular envelopes due to previous shaping processes occurring in the pre-PN phase. The H2 emission peaks seen in I18062 resemble an edge-on torus and in this respect it is similar to the B-type very early PN IRAS 19306+1407 (Lowe & Gledhill 2006). Pre-PN objects such as IRAS 17436+5003, IRAS 06530-0213 and IRAS 19374+2359 have similar structure, with dust peaks to either side of the star, visible in the near-IR (Gledhill et al. 2001, Gledhill 2005), indicating a modest degree of axisymmetry in the envelope. We suggest that as the ionized region expands into and dissociates the molecular envelope, I18062 will become an elliptical PN. I18379 also has an elliptical structure in H2 emission, with an edge-brightened shell with the NE rim approaching us and the SW rim receding.
I22023 and I20462 are at a more advanced phase of evolution, where the region of ionized hydrogen has expanded into the molecular envelope. I22023 is the most morphologically complex object in our sample with distinct knots of H2 emission arranged around the star; there is no obvious single axis although we see a distinct velocity gradient of km s-1 E-W across the object. The Br emission shows a different structure with a central ring and protrusions along PA 100 and this in turn is offset from the major axis of the 8.4 GHz emission. In I20462 the molecular material appears to have been mostly dissociated, with just a localised blob of H2 emission left against a constant low-level background. The Br nebula forms an edge-brightened ring which sits within the optical dust-scattering nebula seen in -band HST images (Ueta et al. 2000). Both I22023 and I20462 show blue-shifted absorption in the m He I line.
I19336 has the most extended Br nebula in our sample, a resolved torus of He I emssion, and appears to be at the most advanced stage of PN formation. The H2 emission forms a weak background across the field but with a similar radial velocity (within errors) to that of the Br and He I emission, so that we believe it to be associated with the object. The Br emission shows distinct collimated lobes extending from a ring with peaks on either side of the star. In contrast, the He I emission forms a smaller central ring sitting within, but with similar geometry to, the Br ring. These structures give two snapshots in time showing the propagation of the ionization fronts in this young PN. When the star was cooler, the Br emission presumably also formed a central ring but the H ionization front has since expanded and been shaped by the molecular gas which it has now dissociated. The He ionization front is now tracing the same path followed by the H ionization front. The total mass and the mass of ionized gas estimated from dust models, radio flux and Br emission (Cerrigone et al. 2009, 2008 and this work, respectively) are of the same order, so that nearly all of the H in this object appears to be ionized.
5 Conclusions
Integral field spectroscopy in the band is a powerful tool for the investigation of hot post-AGB objects which are about to become PNe. This wavelength range contains a rich spectrum of ro-vibrational H2 lines, fluoresced by the increasing UV flux from the central star, and revealing the distribution of molecular material in these objects. The line ratios highlight regions of the objects where the H2 excitation deviates from pure UV pumping and includes a thermal contribution, likely due to UV heating in dense gas.
The developing photoionization regions immediately surrounding the stars are traced by hydrogen Br, and for hotter stars He I m lines. When combined with AO correction on an 8 m telescope such as Gemini the line emission and continuum can be imaged with a spatial resolution of better than arcsec, which can be improved further with image deconvolution.
We have applied the technique to six hot post-AGB stars. All six objects show Br emission and evidence for photoionization, with I19336, I20462 and I22023 having extended Br nebulae. Although the distances are uncertain, it seems likely that I19336, I20462 and I22023 are more evolved than I18062, I18379 and I19200, where the ionized regions are still unresolved.
I19336 appears to be the most evolved object, with a bipolar H II region extending beyond our NIFS field of view; the He+ region in this object is also resolved as a ring-like structure revealed by the He I m line. The absence of any strong H2 emission suggests that molecular material has been dissociated over the inner volume of the emission line nebula. This is also the case in I20462, although a clump of emitting H2 remains in this object.
The H2 emission in I19200 forms a ring around the star. It has a weak 25 m flux compared with the other targets suggesting a low dust mass and we do not detect any strong radial velocity signatures. We argue that this C-rich object has a shell-like envelope and may be about to evolve into a “round” PN.
I18062 appears to be a rapidly evolving object. The linear increase in the Br and 8.4 GHz fluxes between 1999 and 2007 implies that the ionization began recently, around 1990. The H2 emission is suggestive of a toroidal distribution of material, with faint orthogonal bipolar entensions. The developing H II region is unresolved at present, but we may expect it to expand and eventually encounter the molecular material, at which point it may begin to resemble I19336, as the molecular torus is gradually dissociated and then ionized, forming a bipolar emission line nebula with equatorial desnity enhancements. Objects such as these should give important clues as to how the exapnding photoionized regions interact with molecular material expelled and shaped during the pre-PN phase, leading to the formation of PNe.
In contrast to the extended and structured line emission from
molecular and atomic material, we do not find any strong evidence for
dust-scattered continnum in these objects. In Section 4.4 we compare these embryonic PNe with the pre-PN SOLE objects of Ueta
et al. (2000), which are characterised by faint reflection nebulae
surrounding bright stars. We suggest that the objects in our sample
would have been SOLE type pre-PNe, before their stars began to ionize
the envelopes.
Acknowledgments
We thank the anonymous referee whose valuable comments have significantly improved the paper. We thank James Hilling for assistance with the initial processing of the observations. Based on observations obtained at the Gemini Observatory, which is operated by the Association of Universities for Research in Astronomy, Inc., under a cooperative agreement with the NSF on behalf of the Gemini partnership: the National Science Foundation (United States), the National Research Council (Canada), CONICYT (Chile), the Australian Research Council (Australia), Ministério da Ciência, Tecnologia e Inovação (Brazil) and Ministerio de Ciencia, Tecnología e Innovación Productiva (Argentina).
References
- Antoniucci (2008)
- Arkhipova (1999) Arkhipova V.P., Ikonnikova N.P., Noskova R.I., Sokol G.V., Esipov V.F., Klochkova V.G., 1999, Astronomy Letters, 25, 25
- Arkhipova (2001) Arkhipova V.P., Ikonnikova N.P., Noskova R.I., Komissarova G.V., Klochkova V.G., Esipov V.F., 2001, Astronomy Letters, 27, 719
- Arkhipova (2004) Arkhipova V.P., Ikonnikova N.P., Noskova R.I., Komissarova G.V., Esipov V.F., 2004, Astronomy Letters, 30, 779
- Arkhipova (2007) Arkhipova V.P., Esipov V.F., Ikonnikova N.P., Komissarova G.V., Noskova R.I., 2007, Astronomy Letters, 33, 604
- Arkhipova (2012) Arkhipova V.P., Burlak M.A., Esipov V.F., Ikonnikova N.P., Komissarova G.V., 2012, Astronomy Letters, 38, 157
- Benjamin (1999) Benjamin R.A., Skillman E.D., Smits D.P., 1999, ApJ, 514, 307
- Black (1976) Black J.H., Dalgarno A., 1976, ApJ., 203, 132
- Black (1987) Black J.H., van Dishoeck E.F., 1987, ApJ., 322, 412
- Bloeker (1990) Blöcker, T., Schönberner, D., 1990, A&A, 240, 11
- Bowen (1947) Bowen I.S., 1947, PASP, 59, 196
- BHT (1990) Burton M.G., Hollenbach D.J., Tielens A.G.G.M., 1990, ApJ, 365, 620
- Burton (1992) Burton M.G., 1992, Aust. J. Phys., 45, 463
- Cerrigone (2008) Cerrigone L., Umana G., Trigilio C., Leto P., Buemi C.S., Hora J.L., 2008, MNRAS, 390, 363
- Cerrigone (2009) Cerrigone L., Hora J.L., Umana G., Trigilio C., 2009, ApJ, 703, 585
- Cerrigone (2011) Cerrigone L., Trigilio C., Umana G., Buemi C.S., Leto P., 2011, MNRAS, 412, 1137
- Davis (2003) Davis C.J., Smith M.D., Stern L., Kerr T.H., Chiar J.E., 2003, MNRAS 344, 262
- Demarco (2009) De Marco O., 2009, PASP, 121, 316
- Depoy (1994) DePoy D.L., Shields J.C., 1994, ApJ, 422, 187
- Downes (2008) Downes R.A., Keyes C.D., 1988, AJ, 96, 777
- Draine (2010) Draine B.T., 2010, Physics of the Interstellar and Intergalactic Medium, Princeton University Press
- Emprechtinger (2005) Emprechtinger M., Kimeswenger S., Kronberger T., Mair M., Weratschnig, 2005, Astron. Nachr., 326, 115
- Garcia (2002) García-Hernández D.A., Manchado A., García-Lario P., Domínguez-Tagle C., Conway G.M., Prada F., 2002, A&A, 387, 955
- GarcL (1997) García-Lario P., Parthasarathy M., de Martino D., Sanz Fernández de Córdoba L., Monier R., Manchado A., Pottasch S.R., 1997, A&A, 326, 1110
- Gauba (2003) Gauba G., Parthasarathy M., Kumar B., Yadav R.K.S., Sagar R., 2003, A&A, 404, 305
- Gauba (2004) Gauba G., Parthasarathy M., 2004, A&A, 417, 201
- Gesicki (2014) Gesicki K., Zijlstra A.A., Hajduk M., Szyszka C., 2014, A&A, 566, A48
- Gledhill (2001) Gledhill T.M., Chrysostomou A., Hough J.H., Yates J.A., 2001, MNRAS, 332, 321
- Gledhill (2005) Gledhill T.M., 2005, MNRAS, 356, 883
- Guzman (2011) Guzman-Ramirez L., Zijlstra A.A., NíChuimín R., Gesicki K., Lagadec E., Millar T.J., Woods P.M., 2011, MNRAS, 414, 1667
- Hrivnak (2004) Hrivnak, B.J., Kelly, D.M., Su K.Y.L., 2004, in Asymmetrical Planetary Nebuae III eds: Meixner M., Kastner J., Ballick B., Soker N., ASP Conference Series, Vol. 313, 175
- Kelly (2005) Kelly D.M., Hrivnak B.J., (KH05), 2005, ApJ, 629, 1040
- Kwok (2000) Kwok, S., 2000, The Origin and Evolution of Planetary Nebulae, Cambridge Astrophysics Series, 31, University Press, Cambridge
- Lagadec (2011) Lagadec E., et al., 2011, MNRAS, 417, 32
- Lowe (2006) Lowe K.T.E., Gledhill T.M., 2006, Planetary Nebulae in our Galaxy and beyond, eds. M.J. Barlow & R.H. Méndez, IAU Symp No. 234, p451
- Lowe (2007) Lowe K.T.E., Gledhill T.M., 2007, MNRAS, 374, 176
- Luhman (1996) Luhman K.L., Rieke G.H., 1996, ApJ, 461, 298
- Martins (2005) Martins F., Schaerer D., Hillier D.J., 2005, A&A, 436, 1049
- McGregor (2002) McGregor P., et al., 2002, SPIE 4841, 178
- Meixner99 (1999) Meixner M., et al., 1999, ApJS, 122, 221
- Mooney (2002) Mooney C.J., Rolleston W.R.J., Keenan F.P., Dufton P.L., Smoker J.V., Ryans R.S.I., Aller L.H., 2002, MNRAS, 337, 851
- Parthasarathy (1989) Parthasarathy M., Pottasch S.R., 1989, A&A, 225, 521
- Parthasarathy (1993) Parthasarathy M., 1993, ApJ., 414, L109
- Parthasarathy (2000a) Parthasarathy M., García-Lario P., Sivarani T., Manchado A., Sanz Fernández de Córdoba L., 2000a, A&AS, 357, 241
- Parthasarathy (2000b) Parthasarathy M., Vijapurkar J., Drilling J.S., 2000b, A&AS, 145, 269
- Pereira (2007) Pereira C.B., Miranda L.F., 2007, A&A, 467, 1249
- Rosen (2004) Ryans R.S.I., Dufton P.L., Mooney C.J., Rolleston W.R.J., Keenan F.P., Hubeny I., Lanz T., 2003, A&A, 401, 1119
- Sahai (1998) Sahai R., Trauger J.T., 1998, AJ, 116, 1357
- Sahai (2007) Sahai R., Morris M., Sánchez Contreras C., Claussen M., 2007, A.J., 134, 2200
- Sahai (2011) Sahai R., Morris M.R., Villar G.G., 2011, A.J., 141, 134
- Sarkar (2012) Sarkar G., García-Hernández D.A., Parthasarathy M., Manchado A., García-Lario P., Takeda Y., 2012, MNRAS, 421, 679
- Shields (1993) Shields J.C., 1993, ApJ, 419, 181
- Shull (1978) Shull J.M., Hollenbach D.J., 1978, ApJ, 220, 525
- Simon (1984) Simon M., Cassar L., 1984, ApJ, 283, 179
- Siodmiak (2008) Siódmiak N., Meixner M., Ueta T., Sugerman B.E.K., Van de Steene G.C., Szczerba R., 2008, ApJ, 677, 382
- Smith2 (1995) Smith M.D., 1995, A&A, 296, 789
- Smoker (2004) Smoker J.V., et al., 2004, MNRAS, 352, 1279
- Soker (2002) Soker N., 2002, A&A, 386, 885
- Stang (2012) Stanghellini L., García-Hernández D.A., García-Lario P., Davies J.E., Shaw R.A., Villaver E., Manchado A., Perea-Calderón J.V., 2012, ApJ, 753, 172
- Stephenson (1986) Stephenson C.B., 1986, Ap.J., 300, 779
- Sternberg (1989) Sternberg A., Dalgarno A., 1989, ApJ, 338, 197
- Suarez (2006) Suárez O., García-Lario P., Manchado A., Manteiga M., Ulla A., Pottasch S.R., 2006, A&A, 458, 173
- Treffers (1976) Treffers R.R., Fink U., Larson H.P., Gauthier T.N., 1976, ApJ, 209, 793
- Turner (1984) Turner D.G., Drilling J.S., 1984, PASP, 96, 292
- Ueta (2000) Ueta T., Meixner M., Bobrowsky M., 2000, ApJ, 528, 861
- Ueta (2005) Ueta T., Murakawa K., Meixner M., 2005, AJ, 129, 1625
- Ueta (2007) Ueta T., Murakawa K., Meixner M., 2007, AJ, 133, 1345
- Umana (2004) Umana G., Cerrigone L., Trigilio C., Zappalà R.A., 2004, A&A, 428, 121
- VanDeSteene (1995) Van de Steene G.C., Pottasch S.R., 1995, A&A, 299, 238
- VanDeSteene (1996) Van de Steene G.C., Jacoby G.H., Pottasch S.R., 1996, A&AS, 118, 243
- vandeveene (1989) van der Veen W.E.C.J., Habing H.J., Geballe T.R., 1989, A&A, 226, 108
Appendix A Ionized mass
Kwok (2000) give an expression for the Br flux from an optically thin nebula of radius and distance (their equation 3.25):
| (1) |
where is the filling factor and and are the hydrogen (proton) and electron densities. This expression can be used to obtain a relationship between the observed angular radius () and line flux of the nebula, and the distance and density, giving:
| (2) |
where is the Br flux in units of W m-2 and is the distance in kpc. For a He/H fraction of 0.11 (He abundance of 0.1) and assuming that 50 per cent of the He is ionized, then . Inserting into Equation 2 and rearranging gives an expression for the density in cm-3:
| (3) |
The ionized mass in the nebula is given by (Kwok 2000 equation 4.36):
| (4) |
where is the mass of a hydrogen atom and (the mean atomic weight per proton) is 1.44 for a He fraction of 0.11. Substitution of (3) into (4), replacing by the angular radius and converting to solar masses gives:
| (5) |
We assume that corresponding to a shell of thickness .
Appendix B H2 line fluxes and peak wavelengths
| Line | I18062 | I18379 | I19200 | I20462 | I22023 | |||||
|---|---|---|---|---|---|---|---|---|---|---|
| F | F | F | F | F | ||||||
| 7-5 O(5) | 0.03 | 2.0226 | 0.21 | 2.0213 | 0.22 | 2.0219 | - | - | 0.23 | 2.0213 |
| 6-4 O(7) | - | - | - | - | 0.08 | 2.0296 | - | - | - | - |
| 1-0 S(2) | 0.78 | 2.0343 | 2.13 | 2.0329 | 1.76 | 2.0335 | 0.07 | 2.0336 | 1.65 | 2.0328 |
| 8-6 O(3) | 0.14 | 2.0423 | 0.29 | 2.0407 | 0.57 | 2.0415 | - | - | 0.46 | 2.0408 |
| 3-2 S(5) | - | - | 0.15 | 2.0645 | 0.13 | 2.0652 | - | - | 0.10 | 2.0647 |
| 2-1 S(3) | 0.32 | 2.0737 | 0.98 | 2.0722 | 1.24 | 2.0731 | - | - | 1.45 | 2.0722 |
| 9-7 Q(2) | 0.03 | 2.0844 | - | - | 0.05 | 2.0837 | - | - | 0.12 | 2.0830 |
| 9-7 Q(3) | 0.04 | 2.1008 | 0.09 | 2.0995 | 0.11 | 2.1002 | - | - | 0.25 | 2.0995 |
| 7-5 O(6) | - | - | - | - | 0.06 | 2.1085 | - | - | 0.11 | 2.1077 |
| 1-0 S(1) | 3.09 | 2.1219 | 6.26 | 2.1206 | 6.53 | 2.1213 | 0.15 | 2.1213 | 4.80 | 2.1205 |
| 3-2 S(4) | 0.04 | 2.1281 | 0.18 | 2.1268 | 0.16 | 2.1275 | - | - | 0.15 | 2.1266 |
| 4-3 S(6) | - | - | - | - | 0.05 | 2.1513 | - | - | - | - |
| 2-1 S(2) | 0.14 | 2.1544 | 0.63 | 2.1530 | 0.50 | 2.1536 | - | - | 0.63 | 2.1529 |
| 9-7 O(2) | 0.02 | 2.1729 | - | - | 0.06 | 2.1721 | - | - | 0.13 | 2.1713 |
| 3-2 S(3) | 0.16 | 2.2015 | 0.50 | 2.2000 | 0.47 | 2.2007 | 0.02 | 2.2006 | 0.67 | 2.2000 |
| 4-3 S(5) | - | - | - | - | 0.05 | 2.2044 | - | - | 0.13 | 2.2036 |
| 8-6 O(5) | 0.06 | 2.2109 | 0.16 | 2.2094 | 0.10 | 2.2101 | - | - | 0.35 | 2.2094 |
| 1-0 S(0) | 0.78 | 2.2234 | 1.78 | 2.2220 | 1.68 | 2.2227 | 0.06 | 2.2226 | 1.56 | 2.2218 |
| 2-1 S(1) | 0.51 | 2.2478 | 1.16 | 2.2463 | 1.16 | 2.2471 | 0.03 | 2.2469 | 1.41 | 2.2463 |
| 9-7 O(3) | 0.08 | 2.2538 | 0.17 | 2.2523 | 0.23 | 2.2532 | - | - | 0.32 | 2.2523 |
| 4-3 S(4) | 0.02 | 2.2669 | - | - | 0.05 | 2.2662 | - | - | 0.10 | 2.2654 |
| 3-2 S(2) | 0.10 | 2.2873 | 0.23 | 2.2858 | 0.20 | 2.2865 | - | - | 0.41 | 2.2857 |
| 10-8 Q(1) | 0.02 | 2.3227 | 0.04 | 2.3213 | 0.05 | 2.3220 | - | - | 0.10 | 2.3211 |
| 4-3 S(3) | 0.07 | 2.3447 | 0.17 | 2.3434 | 0.19 | 2.3441 | - | - | 0.33 | 2.3432 |
| 9-7 O(4) | 0.03 | 2.3460 | 0.08 | 2.3444 | 0.05 | 2.3452 | - | - | 0.15 | 2.3445 |
| 2-1 S(0) | 0.14 | 2.3560 | 0.48 | 2.3545 | 0.38 | 2.3553 | - | - | 0.72 | 2.3544 |
| 3-2 S(1) | 0.16 | 2.3869 | 0.58 | 2.3854 | 0.39 | 2.3862 | - | - | 0.92 | 2.3854 |
| 1-0 Q(1) | 2.37 | 2.4071 | 6.24 | 2.4057 | 5.69 | 2.4065 | 0.20 | 2.4064 | 4.73 | 2.4056 |
| 1-0 Q(2) | 0.83 | 2.4141 | 2.04 | 2.4125 | 1.84 | 2.4134 | 0.06 | 2.4134 | 1.89 | 2.4125 |
| 1-0 Q(3) | 1.47 | 2.4245 | 4.13 | 2.4228 | 3.99 | 2.4238 | 0.12 | 2.4236 | 3.62 | 2.4229 |