Thermodynamics and Widom lines in supercritical carbon dioxide
Abstract
Behavior of supercritical fluids attracts a lot of attention nowadays. It is important both from the point of view of fundamental science and technological applications. However, up to now the progress in the field is rather moderate. In this article we report a computational study of supercritical carbon dioxide which is one of the most important fluids for chemical industry. We study the response functions of in supercritical regime and calculate the locations of their maxima (Widom lines). We also make preliminary calculations of the line of crossover of microscopic dynamics of particles (Frenkel line). The conclusions on the Frenkel line location can be applied to study of the atmosphere of Venus.
pacs:
61.20.Gy, 61.20.Ne, 64.60.KwI I. Introduction
It is well known that many thermodynamic functions demonstrate maxima in the vicinity of a critical point. Among these values are, for example, heat capacity, isothermal compression, heat expansion coefficients etc. Investigation of supercritical maxima gave an incredible effect on a phase transition theory and in particular the theory of critical phenomena. However, it also has an important technological impact. Supercritical liquids can be used in chemical industry as they have high solubility, rate of chemical reactions etc.
Recently it was proposed that the locations of maxima of different quantities lie not far from each other in or plane. In this case one introduces a single line of supercritical maxima. This line was named as a Widom line widomstanley . However, later it was shown that even in the simplest liquids like van der Waals widomvdw , Lennard-Jones (LJ) widomlj ; may , square well (SW) widomsw and a toy model studied in the work widomindusy maxima of different thermodynamic functions can be rather far from each other. Moreover, the lines of maxima of different quantities behave qualitatively different: some lines go to higher densities as temperature increases while others go to lower densities with increasing temperature. As a result all the curves rapidly diverge and form a wide bunch rather than a line. In Refs. imre ; franzesestanley ; vega Widom line of water was considered and it was shown that the qualitative behavior of supercritical maxima of water looks very similar to the one of the model liquids mentioned above. However, the locations of the maxima points in or planes are reported in literature only for a few systems widomvdw ; widomlj ; may ; widomsw ; widomindusy ; imre .
Some system can demonstrate multiple Widom lines. One can expect the appearance of multiple Widom lines in the systems with complex phase diagrams like water. In particular, multiple Widom line looks natural in the systems with liquid-liquid phase transition. According to recent studies carbon dioxide can also possess very complex phase diagram which includes molecular, polymeric and dissociated metallic fluid phases bonev . In addition to conventional liquid - gas Widom line of in this paper the authors report the Widom line appearing due to the transition between molecular and polymeric liquids calculated by isothermal compressibility maxima. One can expect that the qualitative behavior of this second Widom line of carbon dioxide will be similar to the behavior of the usual gas - liquid Widom line. However, this question requires further clarification.
Another line which divides a fluid in two domains - low-temperature ”rigid” one and high-temperature non-rigid fluid was proposed in the literature ufn ; frpre ; frprl ; bolm . It was named as Frenkel line. Frenkel line separates fluid by means of its microscopic dynamics. In case of rigid regime the particles of liquid perform several oscillations around an equilibrium position and then the equilibrium position changes. In non-rigid regime the oscillations are not observed.
Several methods to locate the Frenkel line in or plane were proposed. Among them two the most convenient are based on velocity autocorrelation function and isochoric heat capacity.
Oscillations of the particle motion in rigid fluid are easily recognized in velocity autocorrelation function by its non-monotonous behavior. In case of non-rigid regime the velocity autocorrelation function simply monotonically decay to zero.
The isochoric heat capacity criterium is based on the following reasoning. Consider a monatomic system. The heat capacity of monatomic crystal (in units of ) is equal to . The heat capacity of crystal is defined by both longitudinal and transverse excitations. The difference between rigid and non-rigid fluids is that the former can sustain transverse excitations while the later cannot. The contribution of transverse excitations into the heat capacity is , so the crossover line is defined as .
This article presents a computational study of supercritical carbon dioxide . We report the thermodynamical properties of (equation of state and response functions) and location of supercritical maxima in plane. This particular system was chosen for its importance in chemical industry and planetary science. We investigate the behavior of the heat capacity, the isobaric expansion, the isothermal compressibility and the density fluctuations in the framework of computer simulation. We also perform a preliminary study of Frenkel line of carbon dioxide.
II II. System and Methods
We studied the supercritical maxima of by means of molecular dynamics simulation. The model potential proposed in Ref. pot was used. This potential was optimized for simulation of the liquid-gas coexistence, and it gives the saturation curve and critical point in close agreement with experimental data.
In this model carbon dioxide molecules are considered as rigid bodies, i.e. bond length and angle are fixed. It has an important consequence for heat capacity. One can show that the heat capacity of ideal gas of rigid triatomic molecules is (here and later talking about heat capacity we implicity assume that energy and temperature are measured in the same units (), so heat capacities are dimensionless). The value comes from thermal motion of the atoms and from rotation of the molecules.
A system of molecules was simulated in a cubic box with periodic boundary conditions in canonical ensemble (fixed number of particles , volume of the system and temperature ). The timestep was set to fs. A period of ps was used to equilibrate the system. Then the system was simulated for more ps in order to compute the averages. So short simulations were enough due to high temperature regimes studied in the work. The system was simulated at the densities from up to with the step . The temperatures studied were from up to with step and then up to with step . Critical parameters of the model were reported in Ref. pot : , and . So the parameters used in our work correspond to the temperatures from a bit above to approximately and from the densities from approximately up to almost . In total different densities and different temperatures were studied. It gives us large data set of energies and pressures as functions of and . These data were fitted to polynomial functions of the form . The fitting parameters for pressure and energy are given in the table I. These fitting functions were used to compute the thermodynamic response functions: density fluctuations , isothermal compressibility , thermal expansion coefficient , constant volume heat capacity and constant pressure heat capacity where and are internal energy and enthalpy of the system.
We also calculate the Frenkel line of the system. For doing this we employ isochoric heat capacity method described in Introduction. However, since carbon dioxide is not monotonic the threshold values have to be modified. In case of rigid threeatomic molecules the heat capacity criterium gives that the Frenkel line corresponds to . Here we neglect the anharmonic effects. Although this is a strong assumptions we believe that it does not affect the qualitative behavior of the system. This criteria is used in the present article for preliminary estimation of the Frenkel line location. In order to compute the Frenkel line the simulations were extended up to the densities .
All simulations were performed using lammps simulation package lammps .
| p | q | for P | for En |
|---|---|---|---|
| 0 | 0 | -59.199 | 8884.811 |
| 1 | 0 | -12.402 | -5347.037 |
| 2 | 0 | -1889.319 | 4859.453 |
| 3 | 0 | 4090.029 | 823.207 |
| 4 | 0 | -7561.170 | -1968.605 |
| 5 | 0 | 3396.4327 | 286.739 |
| 0 | 1 | 0.365 | 16.137 |
| 1 | 1 | 1.041 | 18.175 |
| 2 | 1 | -3.832 | -23.120 |
| 3 | 1 | 4.0548 | 2.038 |
| 4 | 1 | 4.704 | 2.006 |
| 0 | 2 | ||
| 1 | 2 | ||
| 2 | 2 | ||
| 3 | 2 | ||
| 0 | 3 | ||
| 1 | 3 | ||
| 2 | 3 | ||
| 0 | 4 | ||
| 1 | 4 | ||
| 0 | 5 |
III Results and Discussion
First we report the equations of state of the supercritical carbon dioxide (Fig. 1). This figure shows our MD data in comparison to experimental results from NIST database nist . One can see that the MD data are in good agreement with experimental results. The figure also demonstrates the polynomial fit of the data. These fit also well describe the molecular dynamics results
An important conclusion from Fig. 1 is that the results of simulations are in good agreement with experimental results which justifies the reliability of our study. It means that even if the potential we employ in the present study pot was fitted to reproduce the liquid-gas saturation line it can be also successfully used to study the system and analyze its properties in supercritical region.
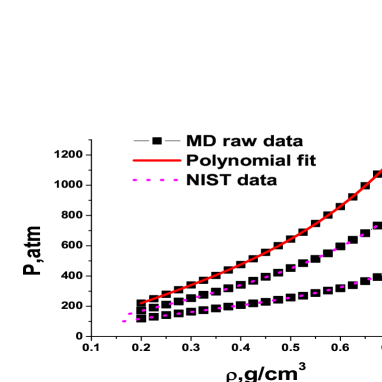
Fig. 2 demonstrates the density fluctuations at a set of temperatures slightly above the critical one. One can see that at the lowest temperatures there is a well defined maximum. However, this maximum rapidly decays. In fact, the maximum is observed even at quite high temperatures (as high as ), but it becomes of the order of numerical errors.
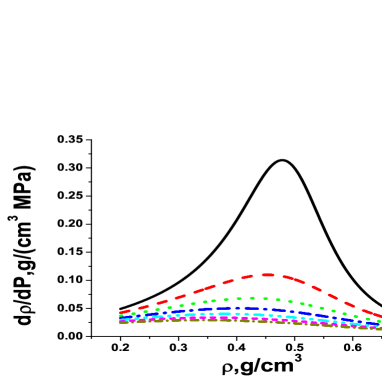
Fig. 3 shows the behavior of isothermal compressibility at the same set of temperatures. Unlike the previous case the maximum quickly vanish. Even at the temperature as low as it is already unobservable.
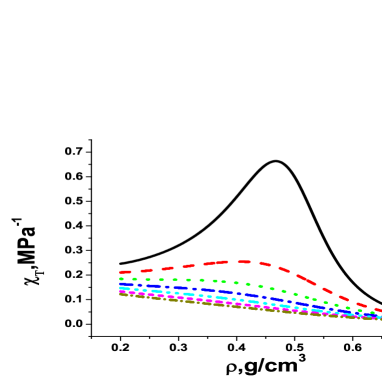
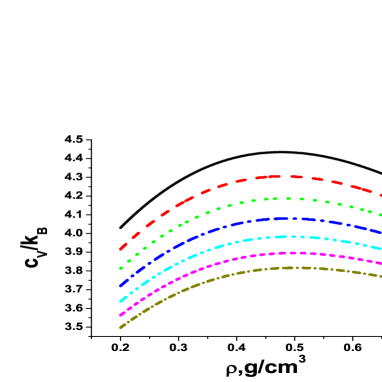
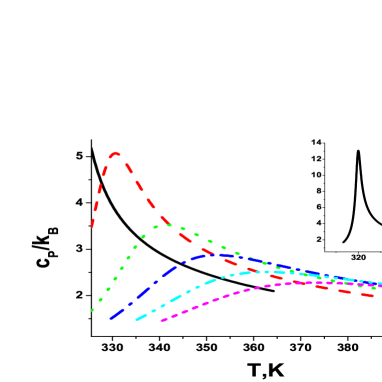
Fig. 4 demonstrates the isochoric heat capacity along the same set of isotherms. Again there are well defined maxima. The maxima can be traced to the temperatures as high as .
The behavior of isobaric heat capacity was studied both along isobars and isotherms. Fig. 5 shows that demonstrates a sharp maxima when approaching along the isobars. As pressure increases the maximum becomes broader and less pronounced. It can be observed even at the pressures up to . However, at so high pressures the maximum becomes of the order of the numerical errors.
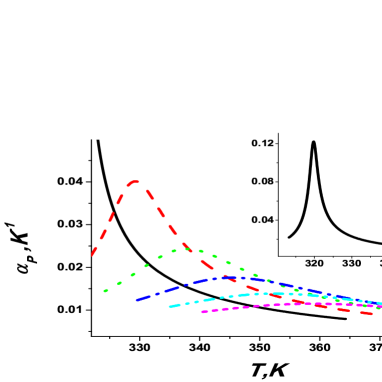
The last quantity studied is isobaric expansion coefficient (Fig. 6). This coefficient was also calculated both along isobars and isotherms. Similar to it also demonstrates sharp maxima at temperatures close to . These maxima rapidly decrease with increasing pressure. The largest pressure we were able to observe the maximum is .
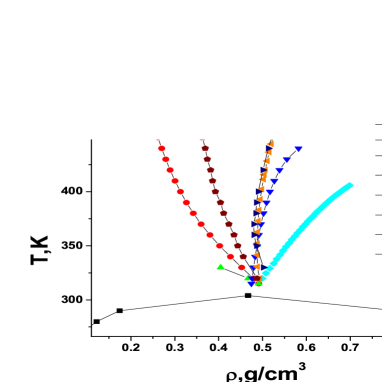
The location of maxima of different quantities is shown in Fig. 7. One can see that the qualitative behavior of different quantities is analogous to the case of LJ fluid. The fluctuations of density and isothermal compressibility maxima move to the lower densities with increasing temperature while heat capacities and isobaric expansion coefficient maxima shift to higher densities at higher temperatures. As a result the lines of maxima rapidly diverge forming a bunch of lines. For example, already at ( above the critical point) the difference between the densities of maxima of different quantities is as large as approximately . So one can estimate that the lines of maxima of different quantities fall onto the same line only at very small temperatures above the critical one.
Importantly, even maxima of the same quantity taken along different thermodynamic trajectories (isotherms, isochors, isobars) can have different location. One can see, that the maxima of along isotherms and isobars are very different. At the same time the locations of isothermal and isobaric maxima of are almost identical.
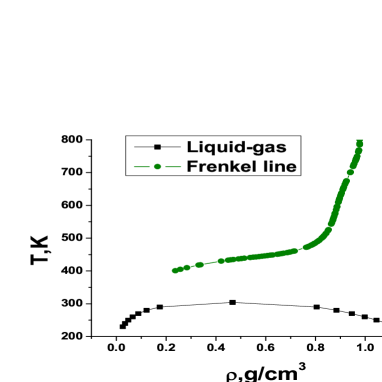
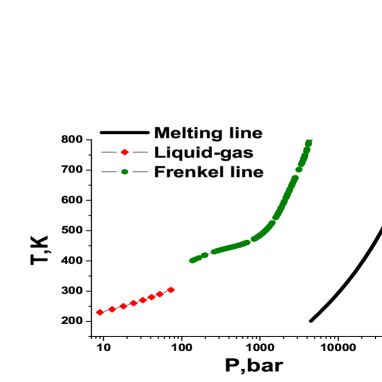
At last we present a preliminary estimation of Frenkel line of . Several methods to find the location of Frenkel line were proposed earlier ufn ; frpre ; frprl . In the current publication we use the method based on isochoric heat capacity . Figs. 8 (a) and (b) show the location of Frenkel line in and planes. In case of coordinates we add also an experimental melting line from Ref. melting (Eq. (3)).
One can see from the Figs. 8 (a) and (b) that Frenkel line calculated from criterium demonstrates a bend at relatively low temperatures. This bend is related to supercritical maximum of heat capacity and does not correspond to rigid - non-rigid fluid crossover. At higher temperatures and pressures Frenkel line becomes approximately parallel to the melting line in logarithmic coordinates in .
Investigation of is important for planetary science and in particular Venus. The concentration of carbon dioxide in the atmosphere of Venus is approximately . The current temperature of Venus is estimated as high as while atmospheric pressure is . One can see from Fig. 8 (b) that this (P,T) point lies deeply inside gaseous phase. However, it is argued in the literature urey that at earlier stages the atmospheric pressure of Venus could be as high as several dozen of MPa. It means that early Venus atmosphere was consisted of rigid carbon dioxide fluid while later on it experienced crossover into non-rigid state. This crossover is related to change of microscopic dynamics of the fluid which leads to altering many physical properties which could strongly affect the formation of the Venus relief.
IV VI. Conclusions
We study the equation of state and superctiritical maxima of carbon dioxide in molecular dynamics simulation. Comparing the MD results with experimental data we conclude that they are in excellent agreement. We show that similar to model liquids studied before the lines of supercritical maxima of rapidly diverge forming a wide bunch of lines. Moreover even the maxima of the same quantity taken along different lines (isotherms or isobars) form different lines. These results justify our earlier conclusion that the concept of Widom line as the line of supercritical maxima is ill defined and does not have clear physical sense widomsw .
In our recent publications we proposed that supercritical fluids can exist in two states which differ in microscopic dynamics - rigid and non-rigid fluid. These states are separated by so called Frenkel line which can be determined from heat capacity criterium. For rigid triatomic molecules this criterium approximately corresponds to in units of . We report the calculations of Frenkel line of and show that it goes approximately parallel to the melting line in coordinates .
Acknowledgements.
Y. F. thanks the Russian Scientific Center at Kurchatov Institute and Joint Supercomputing Center of Russian Academy of Science for computational facilities. Y. F., E. Ts. and V. R. are grateful to the Russian Science Foundation (Grant No 14-12-00820) for the support. V. B. is grateful to the Russian Science Foundation (Grant No 14-12-00093).References
- (1) L. Xu, P. Kumar, S. V. Buldyrev, S.-H. Chen, P. H. Poole, F. Sciortino, and H. E. Stanley, PNAS 102, 16558 (2005).
- (2) V.V. Brazhkin, V.N. Ryzhov, J. Chem. Phys. 135, 084503, (2011).
- (3) V. V. Brazhkin, Yu. D. Fomin, A. G. Lyapin, V. N. Ryzhov, and E. N. Tsiok, J. Phys. Chem. B, 115 (48),14112 (2011).
- (4) H.-O. May and P. Mausbach, Phys. Rev. E 85, 031201 (2012).
- (5) V. V. Brazhkin, Yu. D. Fomin, V. N. Ryzhov, E. E. Tareyeva, and E. N. Tsiok, Phys. Rev. E 89, 042136 (2014).
- (6) A. Dey, P. Roy, T. Sarkar, Physica A, 392, 6341 (2013).
- (7) A.R. Imre, U.K. Deiters, T. Kraska, I. Tiselj, Nuclear Engineering and Design 252, 179 (2012).
- (8) G. Franzese, H. Eugene Stanley, J. Phys.: Condens. Matter 19, 205126(2007).
- (9) J. L. F. Abascal and C. Vega, J. Chem. Phys. 133, 234502 (2010).
- (10) V.V. Brazhkin, A.G. Lyapin, V.N. Ryzhov, K. Trachenko, Yu.D. Fomin, E.N. Tsiok, Phys. Usp. 55 1061 (2012).
- (11) V. V. Brazhkin, Yu. D. Fomin, A. G. Lyapin, V. N. Ryzhov, and K. Trachenko, Phys. Rev. E 85, 031203 (2012).
- (12) V. V. Brazhkin, Yu. D. Fomin, A. G. Lyapin, V. N. Ryzhov, E. N. Tsiok, and Kostya Trachenko, Phys. Rev. Lett. 111, 145901 (2013).
- (13) D. Bolmatov, V. V. Brazhkin, Yu. D. Fomin, V. N. Ryzhov and K. Trachenko, J. Chem. Phys. 139, 234501 (2013).
- (14) Zh. Zhang and Zh. Duan, J. Chem. Phys. 122, 214507 (2005).
- (15) S. Plimpton, J. Comp. Phys, 117, 1-(1995), http://lammps.sandia.gov/index.html
- (16) http://webbook.nist.gov/chemistry/fluid/
- (17) V M. Giordano, F. Datchi, and A. Dewaele, J. Chem. Phys. 125, 054504 (2006).
- (18) H. C. Urey ,The Planets, Their Origin and Development Yale Univ. Press, (1952).
- (19) B. Boates, A.M. Teweldeberhan and S.A. Bonev, PNAS 109, 14808 (2012).