Statistical theory of thermal evolution of neutron stars
Abstract
Thermal evolution of neutron stars is known to depend on the properties of superdense matter in neutron star cores. We suggest a statistical analysis of isolated cooling middle-aged neutron stars and old transiently accreting quasi-stationary neutron stars warmed up by deep crustal heating in low-mass X-ray binaries. The method is based on simulations of the evolution of stars of different masses and on averaging the results over respective mass distributions. This gives theoretical distributions of isolated neutron stars in the surface temperature–age plane and of accreting stars in the photon thermal luminosity–mean mass accretion rate plane to be compared with observations. This approach permits to explore not only superdense matter but also the mass distributions of isolated and accreting neutron stars. We show that the observations of these stars can be reasonably well explained by assuming the presence of the powerful direct Urca process of neutrino emission in the inner cores of massive stars, introducing a slight broadening of the direct Urca threshold (for instance, by proton superfluidity), and by tuning mass distributions of isolated and accreted neutron stars.
keywords:
dense matter – equation of state – neutrinos – stars: neutron1 Introduction
In this paper we study neutron stars of two types. First, they are cooling isolated middle-aged ( yr) neutron stars which are born hot in supernova explosions but gradually cool down mostly via neutrino emission from their superdense cores. They are mainly thermally relaxed and isothermal inside. A noticeable temperature gradient still persists only in their thin heat blanketing envelopes (e.g., Gudmundsson, Pethick, & Epstein 1983; Potekhin, Chabrier, & Yakovlev 1997).
Secondly, we study old ( yr) transiently accreting quasi-stationary neutron stars in low-mass X-binaries (LMXBs); such transient systems are called X-ray transients (XRTs). These neutron stars accrete matter from time to time (in the active states of XRTs) from their low-mass companions. The accreted matter is compressed under the weight of newly accreted material and the compression is accompanied by deep crustal heating (Haensel & Zdunik, 1990, 2008) due to beta-captures, neutron absorption and emission, and pycnonuclear reactions with characteristic energy release of 1–2 MeV per accreted nucleon deeply in the crust. The accretion episodes are supposed to be neither too long (months– weeks) nor too intense to overheat the crust and destroy the internal equilibrium between the crust and the core. Nevertheless, the deep crustal heating should be sufficiently strong to keep the neutron stars warm and explain observable thermal emission of such neutron stars during quiescent states of XRTs (Brown, Bildsten, & Rutledge, 1998). The mean neutron star heating rate is determined by the average mass accretion rate ; the averaging has to be performed over characteristic cooling times of such stars (typically yr).
The isolated cooling neutron stars are usually studied by calculating their theoretical cooling curves (time dependence of their effective surface temperature or (equivalently) thermal surface luminosity , redshifted or non-redshifted for a distant observer). The curves are calculated under different assumptions on the neutrino emission in the stellar core, and then they are compared with observations (to reach the best agreement).
The transiently accreting neutron stars in XRTs are investigated by simulating their theoretical heating curves, which give average or for accreting neutron stars in quiescent states as a function of . The heating curves are also compared with observations.
It is important that the cooling and heating curves have much in common (e.g., Yakovlev & Haensel 2003; Yakovlev, Levenfish, & Haensel 2003) and allow one to study fundamental physics of neutron stars. As a rule, one plots the cooling and heating curves to interpret observations of individual stars. The most important cooling/heating regulators to be tested are as follows.
-
1.
A level of neutrino luminosity of the star. Specifically, it is the neutrino cooling rate for a cooling neutron star or neutrino luminosity for a transiently accreting star ( being the heat capacity of the star).
-
2.
Stellar mass and equation of state (EOS) of superdense matter in the stellar core which regulate the level of the neutrino emission in the core.
-
3.
Composition of the heat blanketing envelope of a cooling or heating star which determines the relation between the internal and surface temperature of the star.
Since observations of isolated and transiently accreting neutron stars are rapidly progressing, it is instructive to utilize the accumulated statistics of the sources and develop a statistical theory of their evolution. It is the aim of this paper to put forward such a theory. It will take into account that the cooling and heating curves can strongly depend on neutron star masses. Then, one can introduce the probability to find a source in different places of the cooling/heating diagram by averaging these curves over mass distributions of isolated or accreting stars. Naturally, these mass distributions can be different. Comparing theoretical and observational distributions of the sources one can study not only individual cooling regulators mentioned above but also the mass distributions of neutron stars of different types. The problem would be to find out which physical models of neutron stars and mass distributions of isolated and accreting neutron stars give the best agreement of calculated and observed distributions of such stars on the cooling and heating diagrams.
2 Observational basis
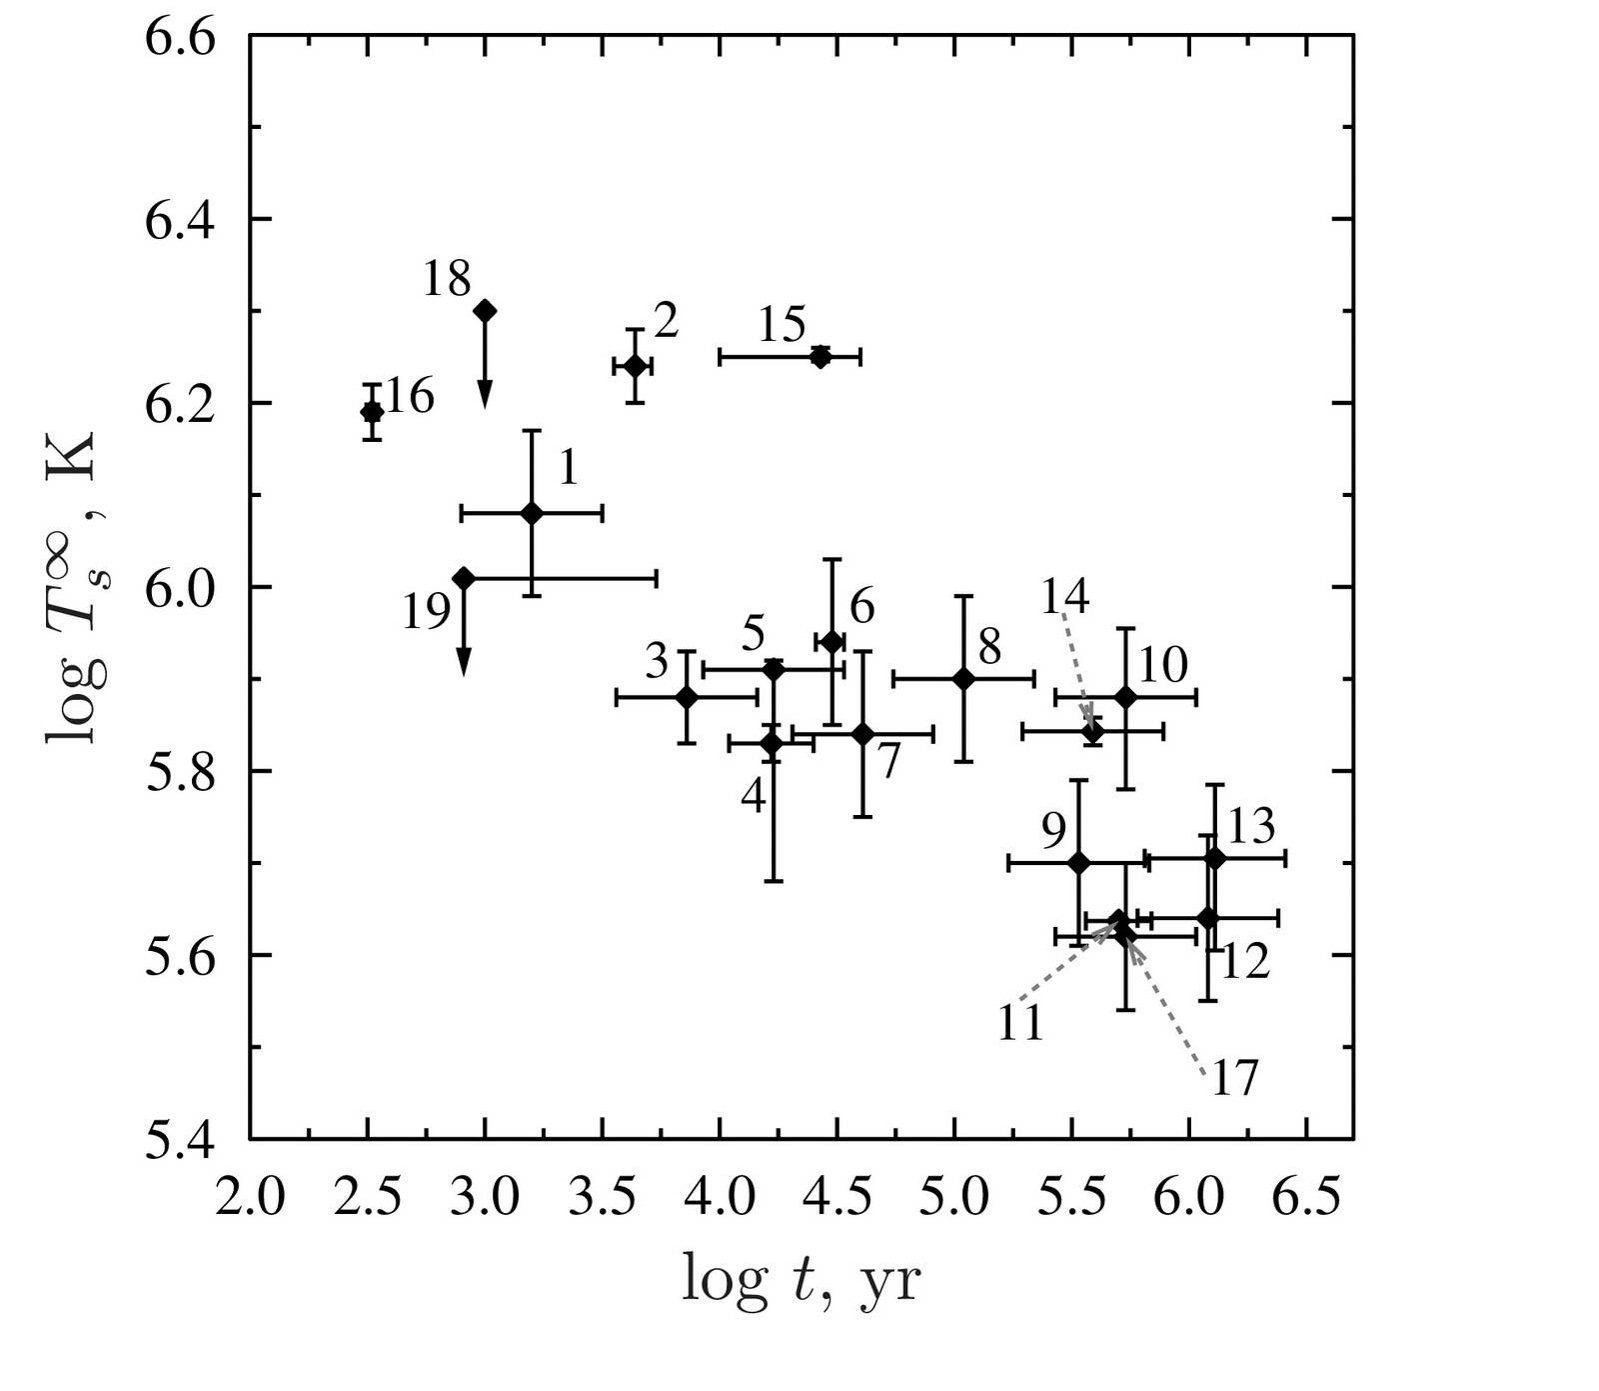
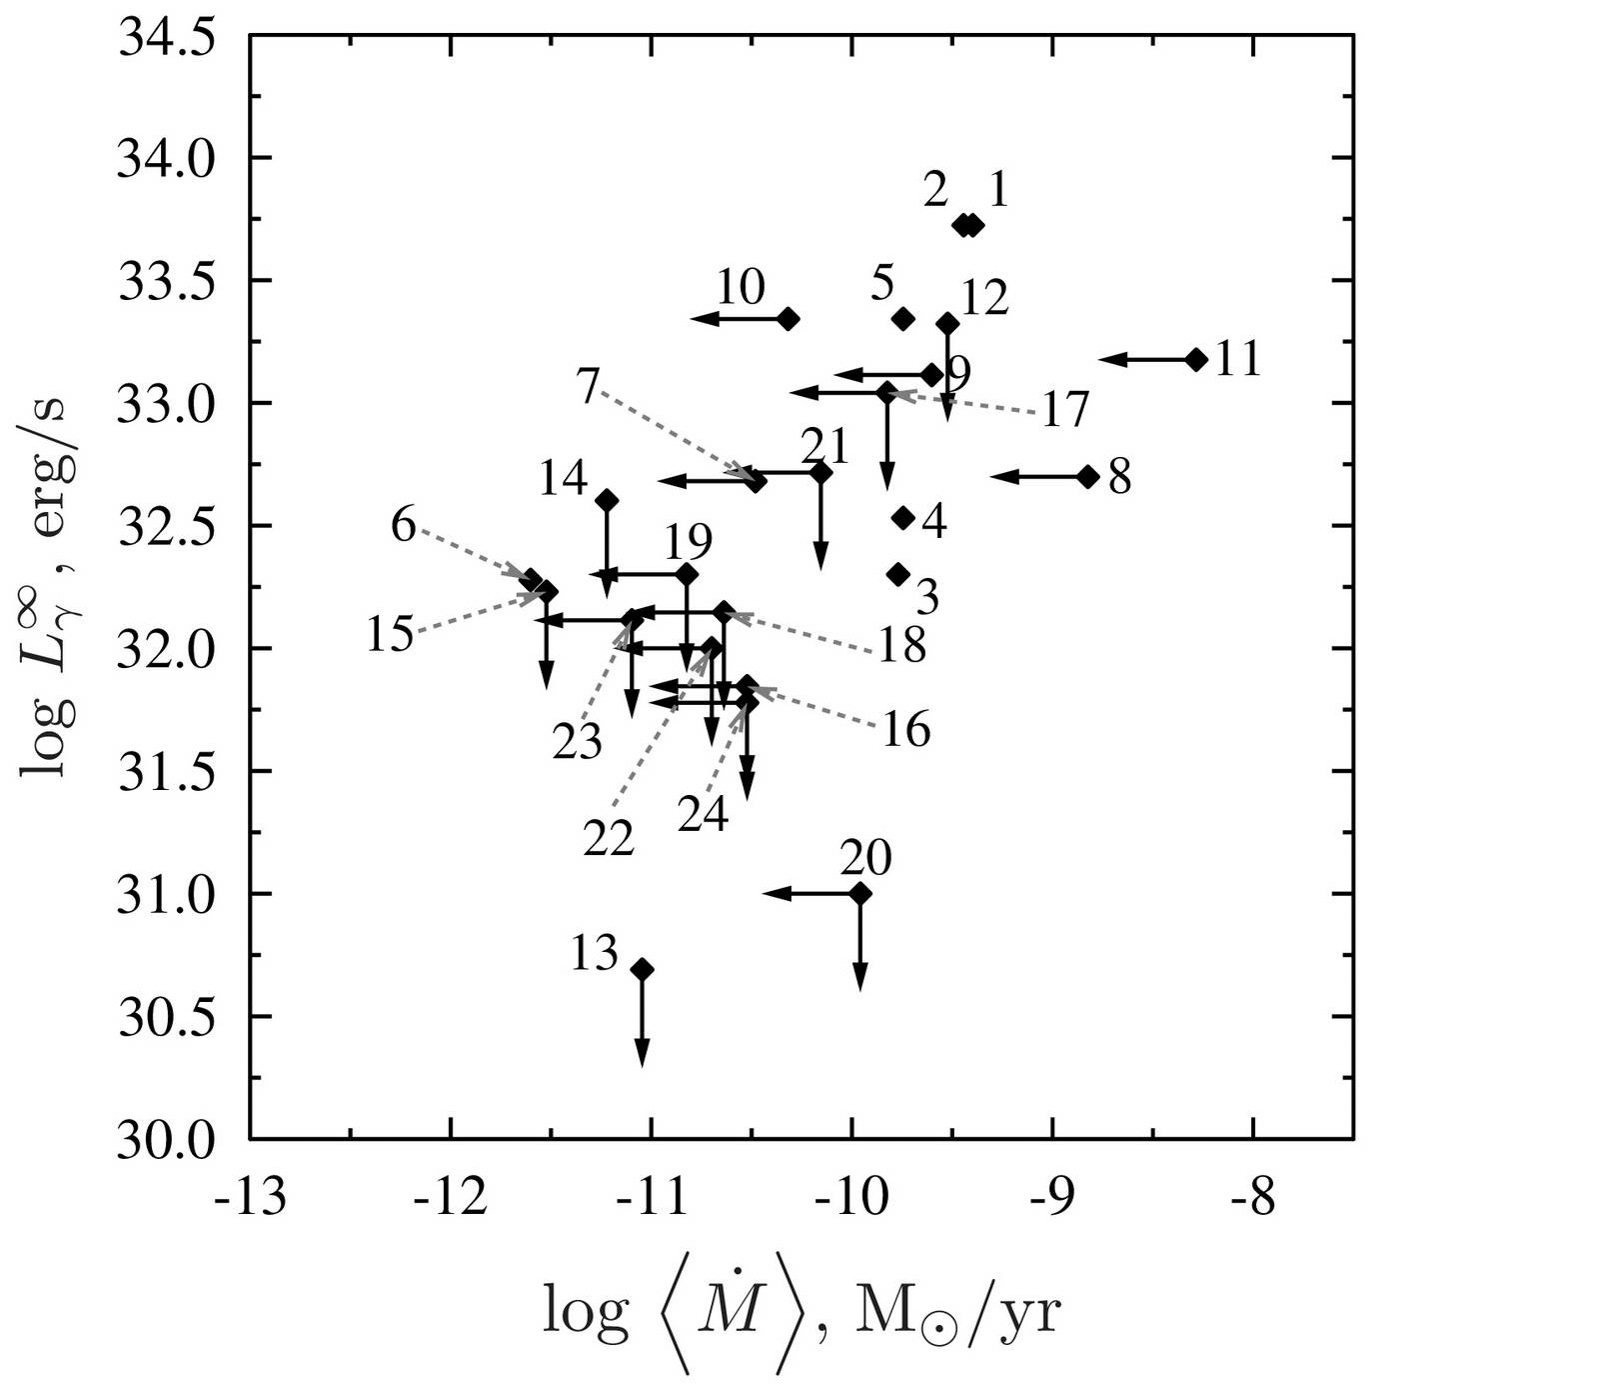
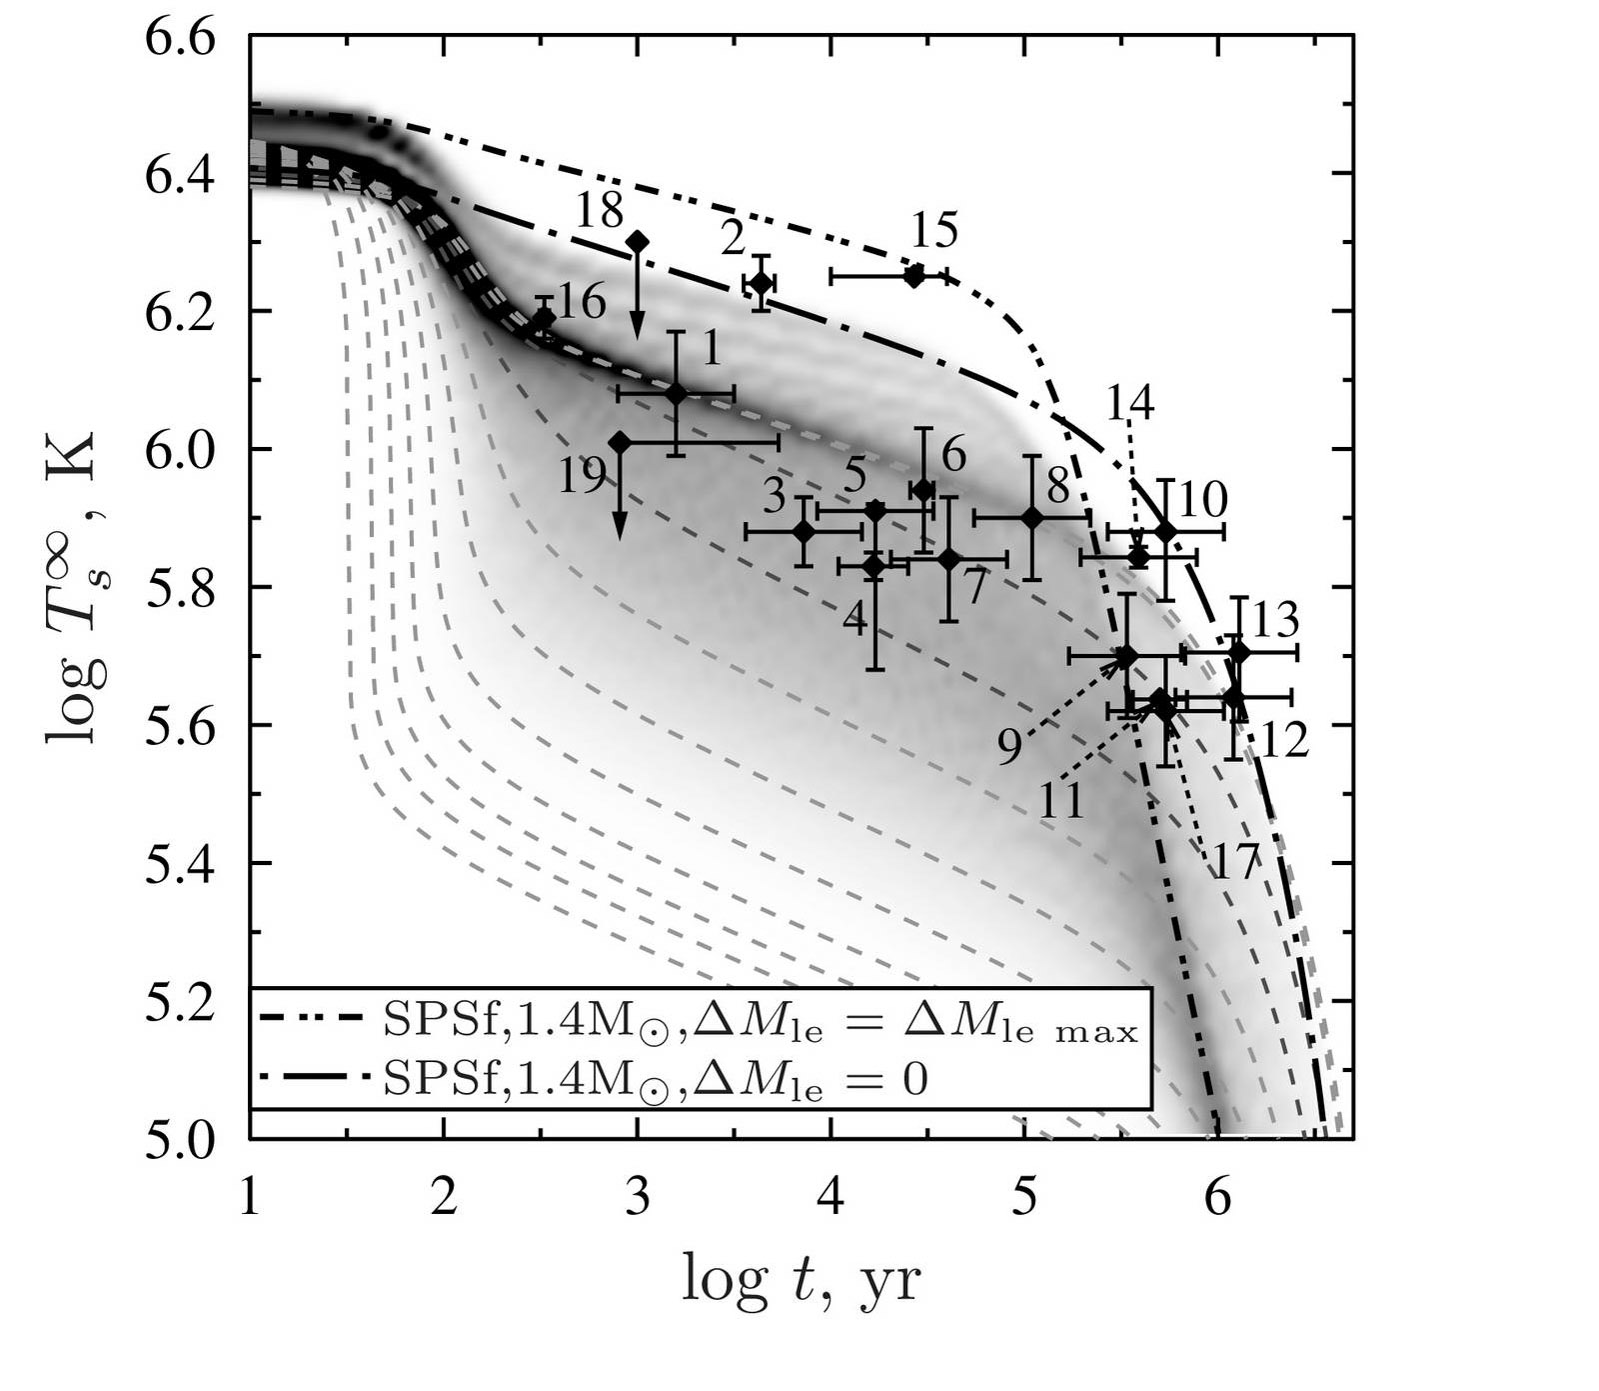
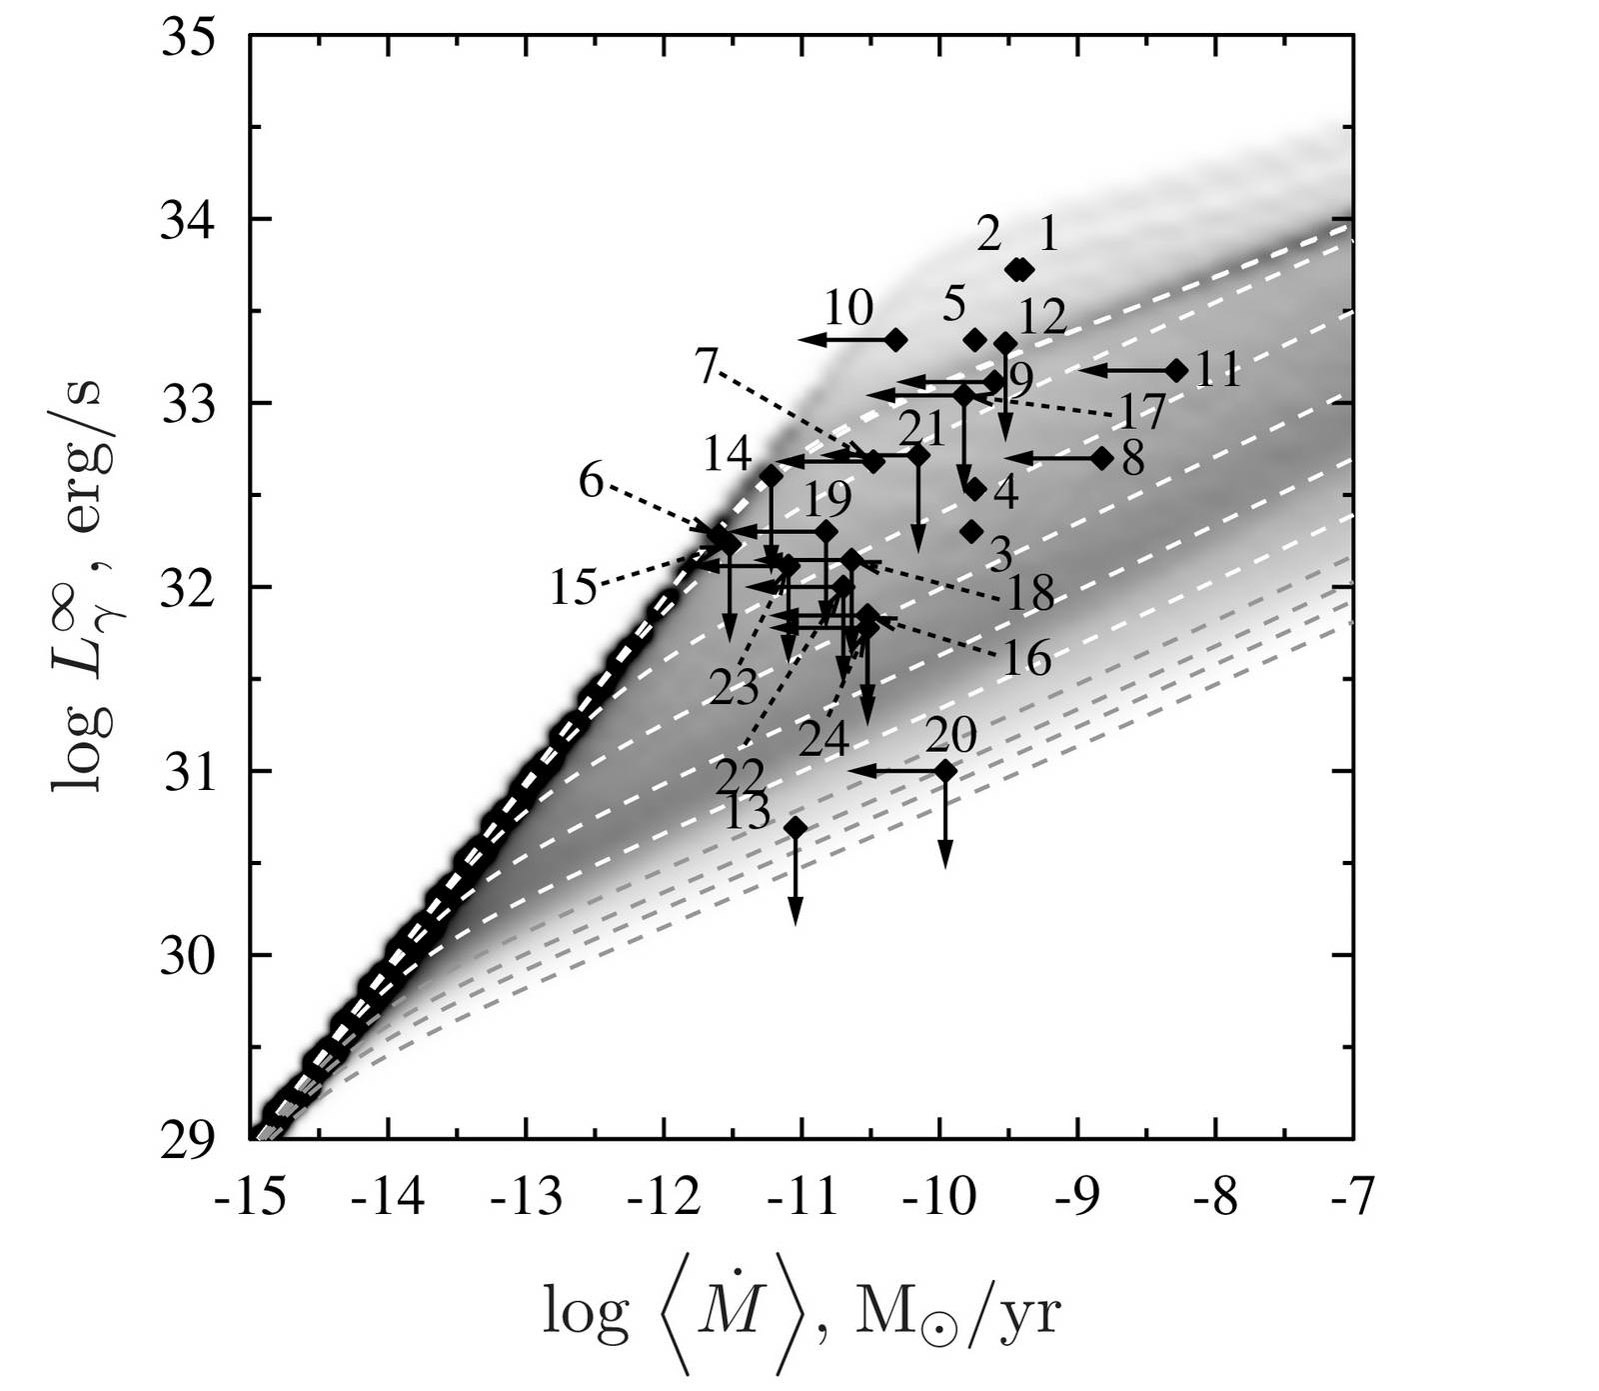
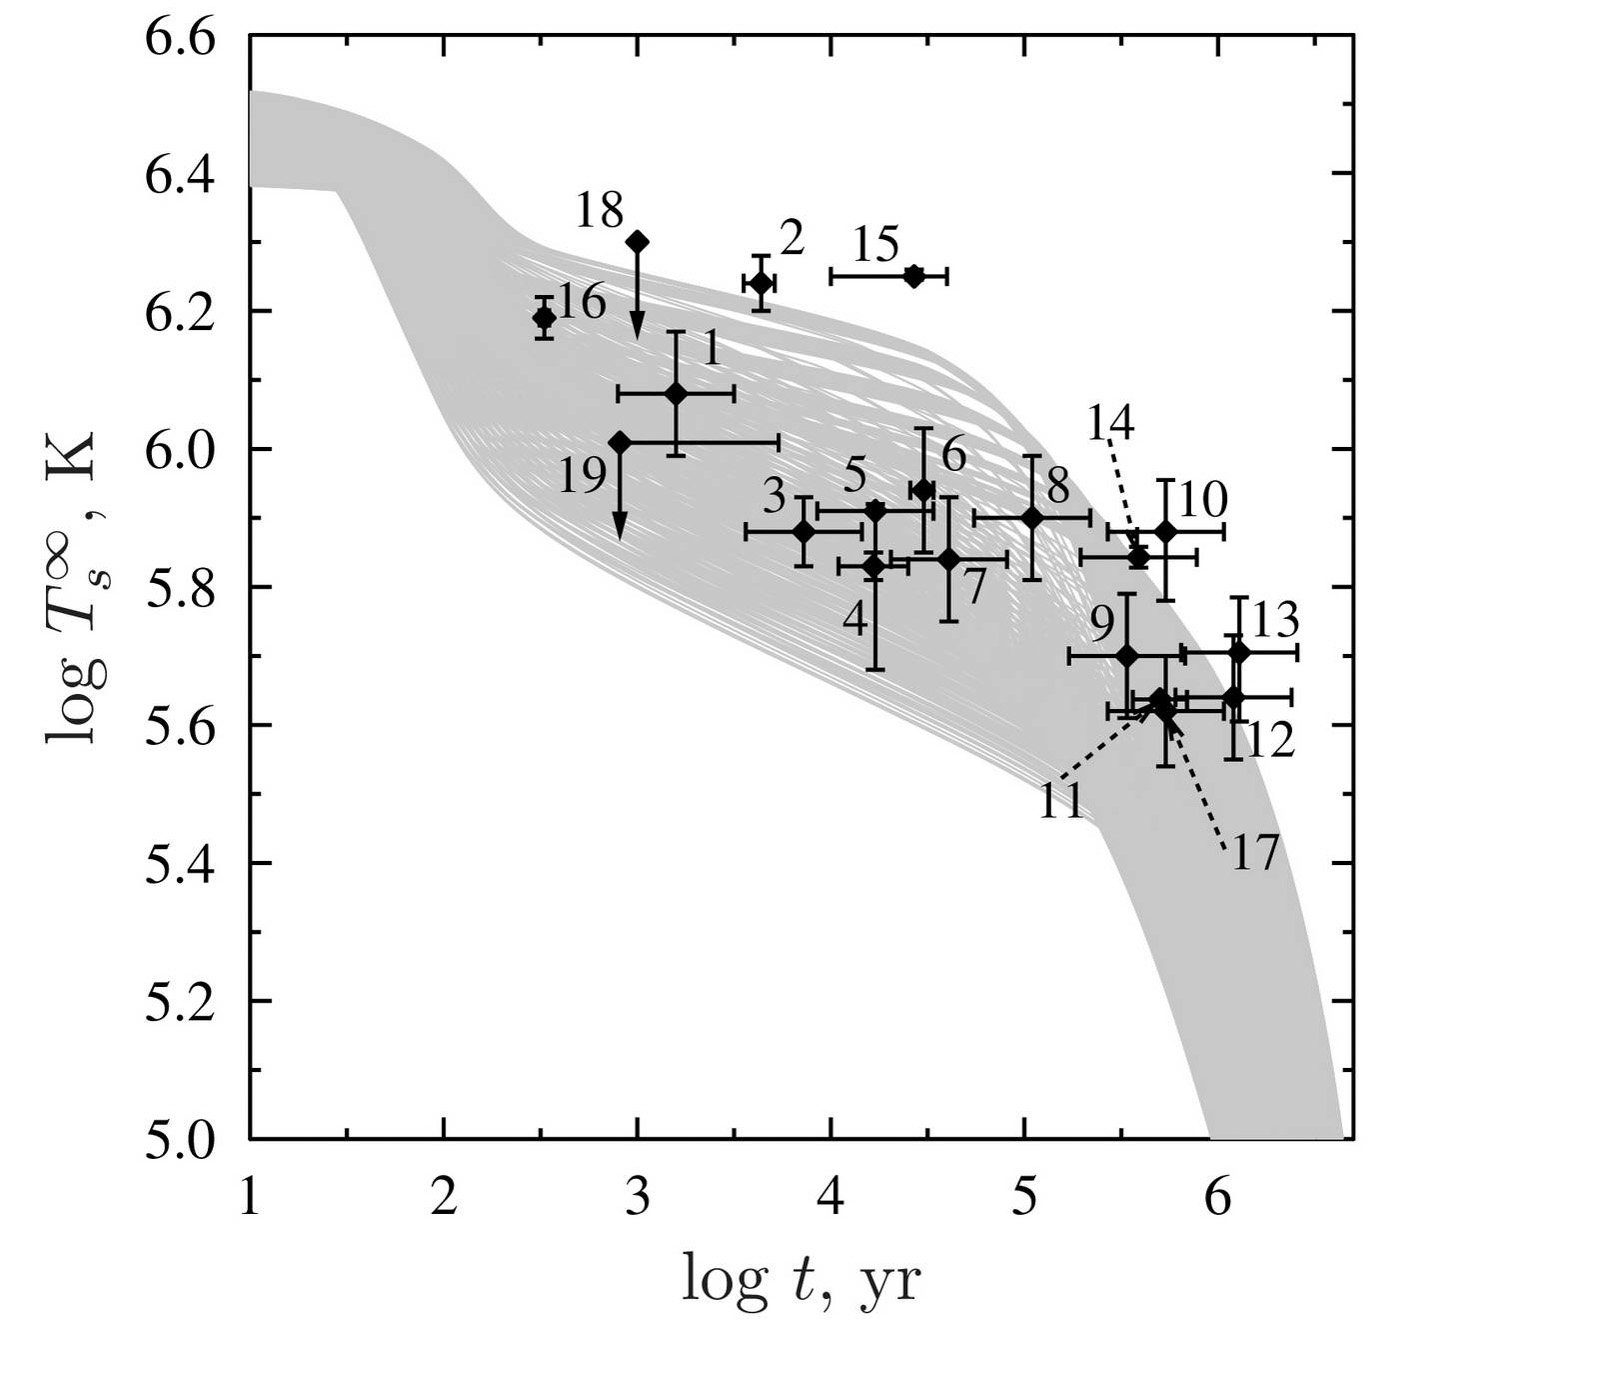
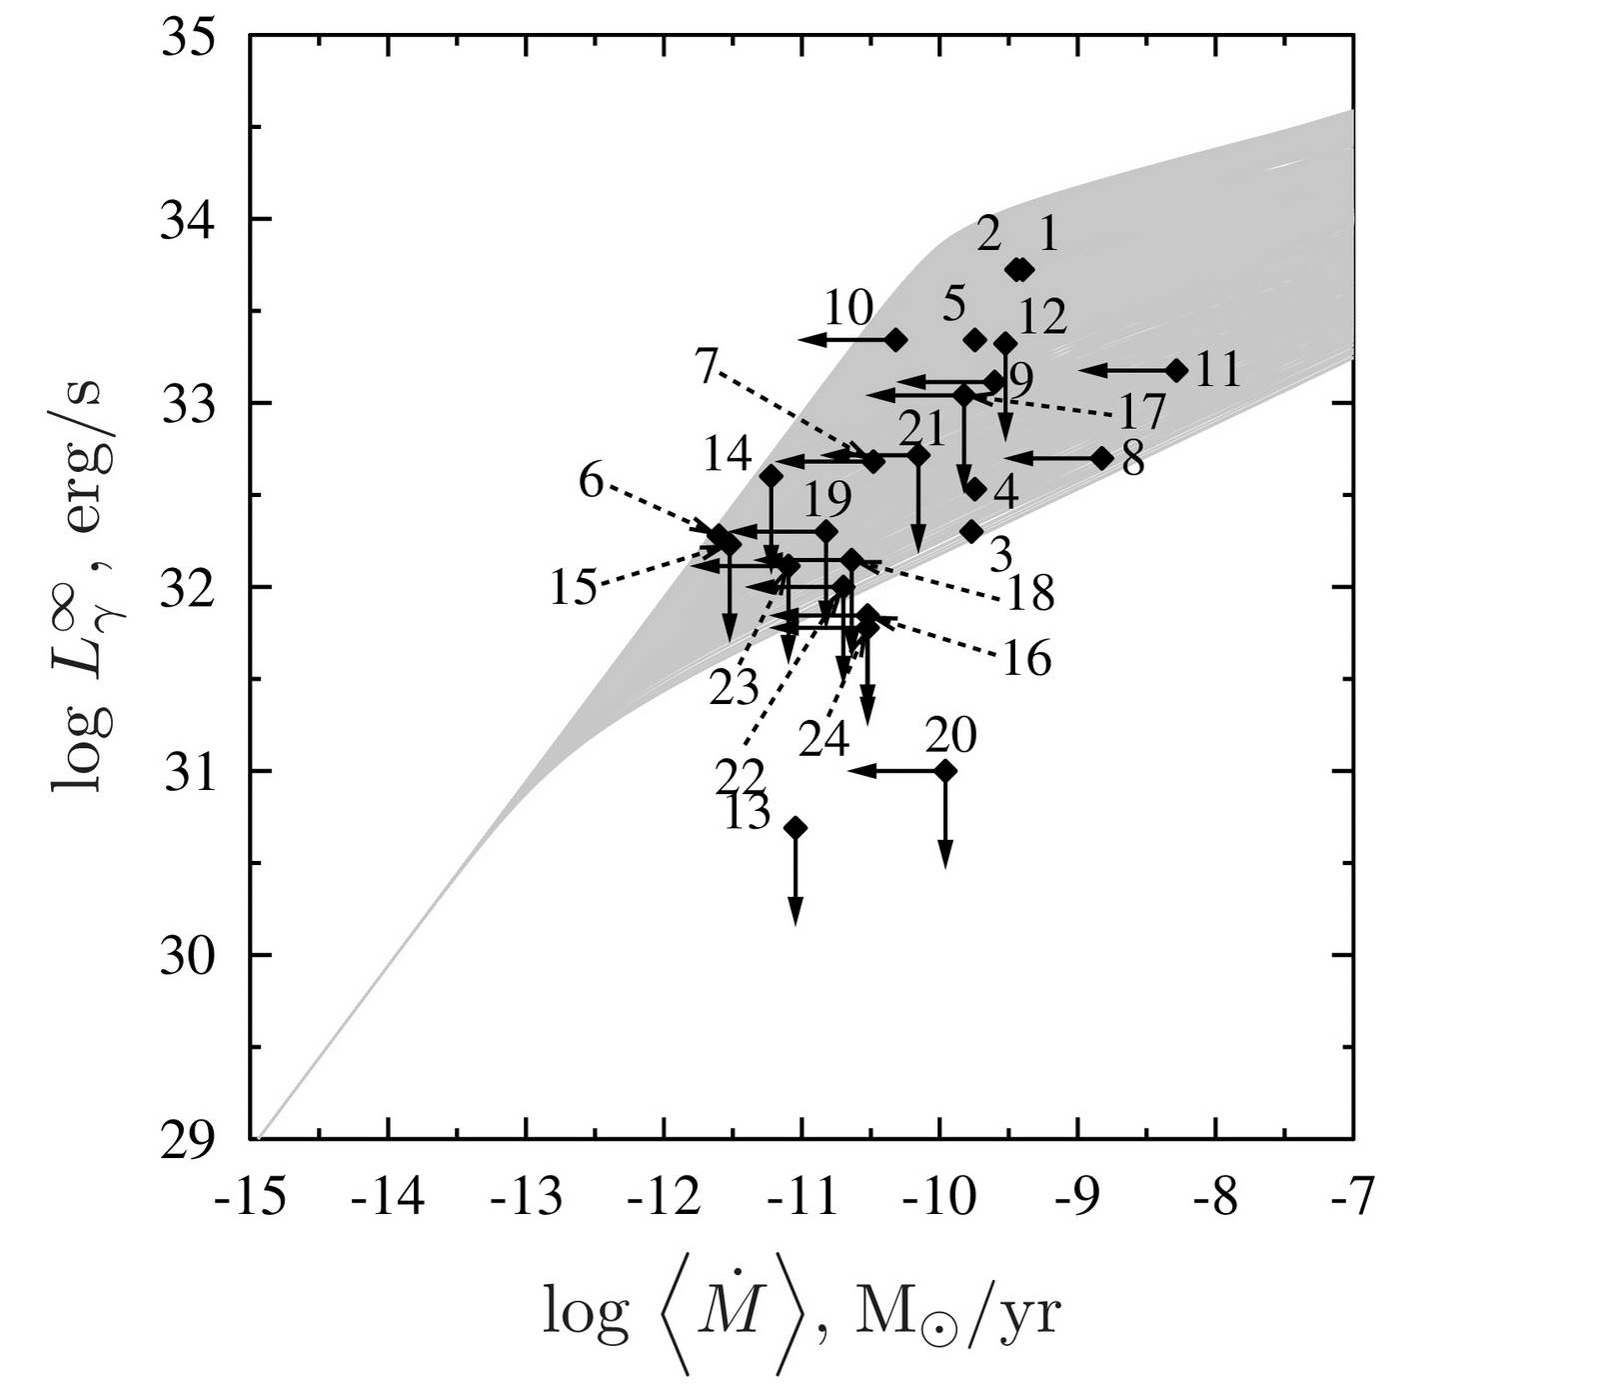
Before describing statistical theory of thermal evolution of neutron stars, in Tables 1 and 2 and Figs 1 and 2 we present the observational basis for our analysis.
Table 1 gives the data on 19 isolated middle-aged neutron stars whose thermal surface radiation has been detected or constrained. The table gives the source number, source name, estimated age, the effective surface temperature (redshifted for a distant observer) as inferred from observations, the confidence level of , a model which has been used to infer , and references to original publications from which the results are taken. The data have been collected in the same way as in Yakovlev & Pethick (2004) and Yakovlev et al. (2008) but supplemented by new results. The data contain neutron stars in supernova remnants (like the Crab pulsar), the famous Vela pulsar and its twin PSR 1706–44, compact stellar objects in supernova remnants (like neutron star in Cas A), the “dim” (“truly” isolated) stars (e.g., RX J1865.4–3754), etc. The distances are not very certain even if parallaxes are measured (see a discussion on RX J1865.4–3754 in Potekhin 2014). In many cases the ages are uncertain as well. The presented values of refer to thermal emission from the entire surface of the stars. These temperatures are inferred from the observed spectra using blackbody (BB) model for thermal emission, the models of nonmagnetic and magnetic hydrogen atmospheres (HA and mHa, respectively), the models of hydrogen atmospheres of finite depth, HA∗ and mHA∗, as well as the carbon atmosphere (CA) models (as reviewed, e.g., by Potekhin 2014).
Table 2 gives the data on neutron stars in 26 XRTs. It presents the number and name of the source, estimated (constrained) mean mass accretion rates , themal surface luminosities of neutron stars in quasi-stationary quiescent states, and respective references. Extracting and from observations is a very complicated problem as discussed in many references cited in Table 2. Both quantities are often constrained (given as upper limits) rather than measured. If measured, their values are rather uncertain (the error bars are large and difficult to estimate, often not presented). Therefore, one should be careful in dealing with these data. The statistical approach we describe here seems most suitable for this situation.
3 Statistical theory
Now we present the simplest version of the statistical theory for cooling isolated neutron stars and heating transiently accreting quasi-stationary neutron stars in LMXBs.
| Num. | Source | Age, kyr | , MK | Confid. level for | Model | Ref. |
|---|---|---|---|---|---|---|
| 1 | PSR J1119–6127 | 1.6 | 1.2 | – | mHA | Z09 |
| 2 | RX J0822–4300 (in Pup A) | 1.6–1.9 | 90% | HA | Z99, B12 | |
| 3 | PSR J1357–6429 | – | mHA | Z07 | ||
| 4 | PSR B0833–45 (Vela) | 11–25 | 68% | mHA | P01 | |
| 5 | PSR B1706–44 | 17 | 68% | mHA | MG04 | |
| 6 | PSR J0538+2817 | – | mHA | Z04 | ||
| 7 | PSR B2334+61 | 41 | – | mHA | Z09 | |
| 8 | PSR B0656+14 | 110 | – | BB | Z09 | |
| 9 | PSR B0633+1748 (Geminga) | 340 | – | BB | K05 | |
| 10 | PSR B1055–52 | 540 | – | BB | PZ03 | |
| 11 | RX J1856.4–3754 | 500 | 68% | mHA∗ | Ho07, P14 | |
| 12 | PSR J2043+2740 | 1200 | – | mHA | Z09 | |
| 13 | RX J0720.4–3125 | 1300 | – | HA∗ | M03 | |
| 14 | PSR J1741–2054 | 391 | 90% | BB | Ka14 | |
| 15 | XMMU J1732–3445 | 27 | – | CA | K15 | |
| 16 | Cas A NS | – | CA | H09 | ||
| 17 | PSR J0357+3205 (Morla) | 540 | 90% | mHA | M13, Ki14 | |
| 18 | PSR B0531+21 (Crab) | 1 | 99.8% | BB | W04, W11 | |
| 19 | PSR J0205+6449 (in 3C 58) | 0.82–5.4 | 99.8% | BB | S04, S08 |
| [Z09] Zavlin (2009); [Z99] Zavlin, Trümper, & Pavlov (1999); [B12] Becker et al. (2012); [Z07] Zavlin (2007); [P01] Pavlov et al. (2001); [MG04] McGowan et al. (2004); [Z04] Zavlin & Pavlov (2004); [K05] Kargaltsev et al. (2005); [PZ03] Pavlov & Zavlin (2003); [Ho07] Ho et al. (2007); [P14] Potekhin (2014); [M03] Motch, Zavlin, & Haberl (2003); [Ka14] Karpova et al. (2014); [K15] Klochkov et al. (2015); [H09] Ho & Heinke (2009); [M13] Marelli et al. (2013); [Ki14] Kirichenko et al. (2014); [W04] Weisskopf et al. (2004); [W11] Weisskopf et al. (2011); [S04] Slane et al. (2004); [S08] Shibanov et al. (2008). |
| Num. | Source | , yr-1 | , erg s-1 | Ref. |
|---|---|---|---|---|
| 1 | Aql X-1 | H07, R01a, C03, T04 | ||
| 2 | 4U 1608–522 | H07, T04, R99 | ||
| 3 | MXB 1659–29 | H07, C06a | ||
| 4 | NGC 6440 X-1 | H07, C05 | ||
| 5 | RX J1709–2639 | H07, J04a | ||
| 6 | IGR 00291+5934 | H09b, G05, J05, T08 | ||
| 7 | Cen X-4 | T04, R01b | ||
| 8 | KS 1731–260 | H07, C06a | ||
| 9 | 1M 1716–315 | J07a, H09b | ||
| 10 | 4U 1730–22 | H09b, T07, C97 | ||
| 11 | 4U 2129+47 | H09b, N02, P86, W83 | ||
| 12 | Terzan 5 | H07, H06b, W05a | ||
| 13 | SAX J1808.4–3658 | H09b, GC06, CS05 | ||
| 14 | XTE J1751–305 | H09b, M02, M03, W05b | ||
| 15 | XTE J1814–338 | H09b, K05, W03, G06 | ||
| 16 | EXO 1747–214 | T05, H07 | ||
| 17 | Terzan 1 | C06b, H07 | ||
| 18 | XTE J2123–058 | H07, T04 | ||
| 19 | SAX J1810.8–2609 | H07, T04, J04b | ||
| 20 | 1H 1905+000 | J06, J07b, H09b | ||
| 21 | 2S 1803–45 | H09b, C07 | ||
| 22 | XTE J0929–314 | G02, G06, J03, CF05, W05b, H09b | ||
| 23 | XTE J1807–294 | H09b, G06, CF05 | ||
| 24 | NGC 6440 X-2 | H10 |
| [H07] Heinke et al. (2007); [R01a] Rutledge et al. (2001a); [C03] Campana & Stella (2003); [T04] Tomsick et al. (2004); [R99] Rutledge et al. (1999); [C06a] Cackett et al. (2006b); [J04a] Jonker et al. (2004); [H09b] Heinke et al. (2009); [G05] Galloway et al. (2005); [J05] Jonker et al. (2005); [C05] Cackett et al. (2005); [T08] Torres et al. (2008); [R01b] Rutledge et al. (2001b); [J07a] Jonker, Bassa & Wachter (2007); [T07] Tomsick, Gelino, & Kaaret (2007); [C97] Chen, Shrader, & Livio (1997); [N02] Nowak, Heinz, & Begelman (2002); [P86] Pietsch et al. (1986); [W83] Wenzel (1983); [H06b] Heinke et al. (2006); [W05a] Wijnands et al. (2005a); [GC06] Galloway & Cumming (2006); [CS05] Campana et al. (2002) [M02] Markwardt et al. (2002); [M03] Miller et al. (2003); [W05b] Wijnands et al. (2005b); [K05] Krauss et al. (2005); [W03] Wijnands & Reynolds (2003); [G06] Galloway (2006); [T05] Tomsick, Gelino, & Kaaret (2005); [C06b] Cackett et al. (2006a); [J04b] Jonker, Wijnands, & van der Klis (2004); [J06] Jonker et al. (2006); [J07b] Jonker et al. (2007); [C07] Cornelisse, Wijnands, & Homan (2007); [G02] Galloway et al. (2002); [J03] Juett, Galloway, & Chakrabarty (2003); [CF05] Campana et al. (2005); [H10] Heinke et al. (2010) |
| Model | (km) | ||
|---|---|---|---|
| Maximum mass | 2.16 | 10.84 | 24.5 |
| Direct Urca onset | 1.72 | 12.46 | 10.0 |
The theory is based on ordinary theory of neutron star cooling and heating (e.g., Page et al. 2009; Yakovlev & Pethick 2004). By way of illustration we consider neutron stars with nucleonic cores and some phenomenological EOS in the core described by Kaminker et al. (2014). The authors denoted this EOS as HHJ; it belongs to the family of parameterized EOSs suggested by Heiselberg & Hjorth-Jensen (1999). The parameters of two HHJ models (gravitational masses , circumferential radii , and central densities in units of g cm-3) are presented in Table 3. The first is the maximum mass model, with (to be consistent with recent measurements of masses of two neutron stars by Demorest et al. 2010 and Antoniadis et al. 2013). The circumferencial radius of the most massive stable star in this case is km and the central density g cm-3. The second model in Table 3 is the model with . At lower the powerful direct Urca process of neutrino emission (Lattimer et al., 1991) is forbidden in a neutron star core, while at higher it is allowed in the central kernel of a star (at densities g cm-3). Such high-mass stars undergo very rapid neutrino cooling.
We calculate thermal evolution of cooling and heating neutron star models using our generally relativistic cooling code (Gnedin, Yakovlev & Potekhin, 2001) on a dense grid of masses , from to . The cooling curves of isolated neutron stars are obtained by directly running the code (although we are most interested in the ages from to yr at which the stars are isothermal inside and cool via neutrino emission so that the cooling problem is considerably simplified).
The heating curves of transiently accreting neutron stars are calculated as stationary solutions of the heat balance equation (e.g., Haensel & Zdunik 2003),
| (1) |
where is the averaged deep crustal heating power (redshifted for a distant observer and determined by the time-averaged mass accretion rate ). The interior of the star is assumed to be isothermal (with general relativistic effects properly included) while the internal temperature is related to the effective surface one by corresponding heat blanketing solution (e.g., Potekhin, Chabrier & Yakovlev 1997). Calculated cooling curves will be plotted on the diagram, while heating curves will be plotted on the diagram. These will be ordinary cooling and heating curves which have been extensively studied by the theory. As a rule, the highest cooling or heating curve corresponds to the low-mass neutron star (with rather slow neutrino emission) while the lowest curve belongs to the maximum-mass star with highest neutrino cooling rate. The space between the highest and lowest cooling curves is filled by the curves for stars of different masses but this filling can be very non-uniform (e.g., Gusakov et al. 2005).
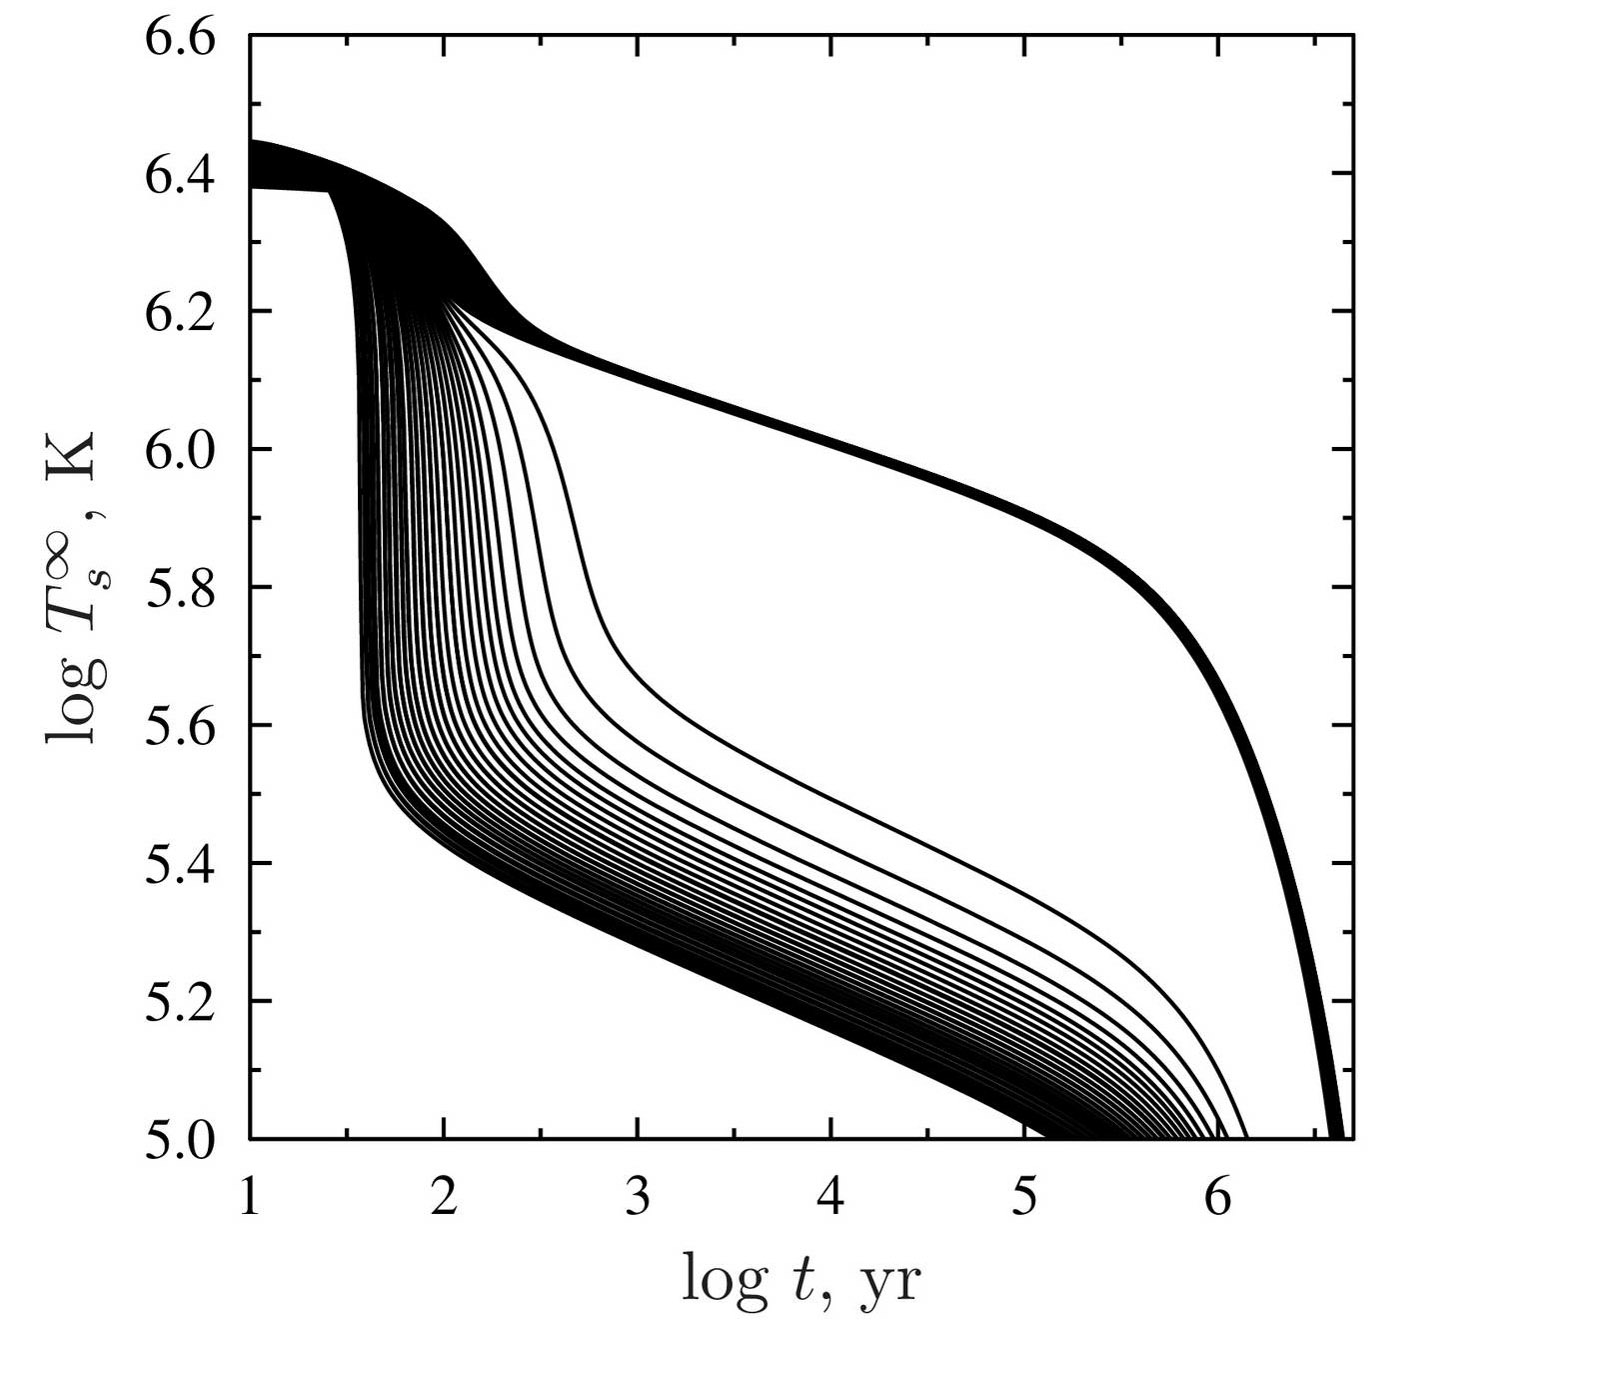
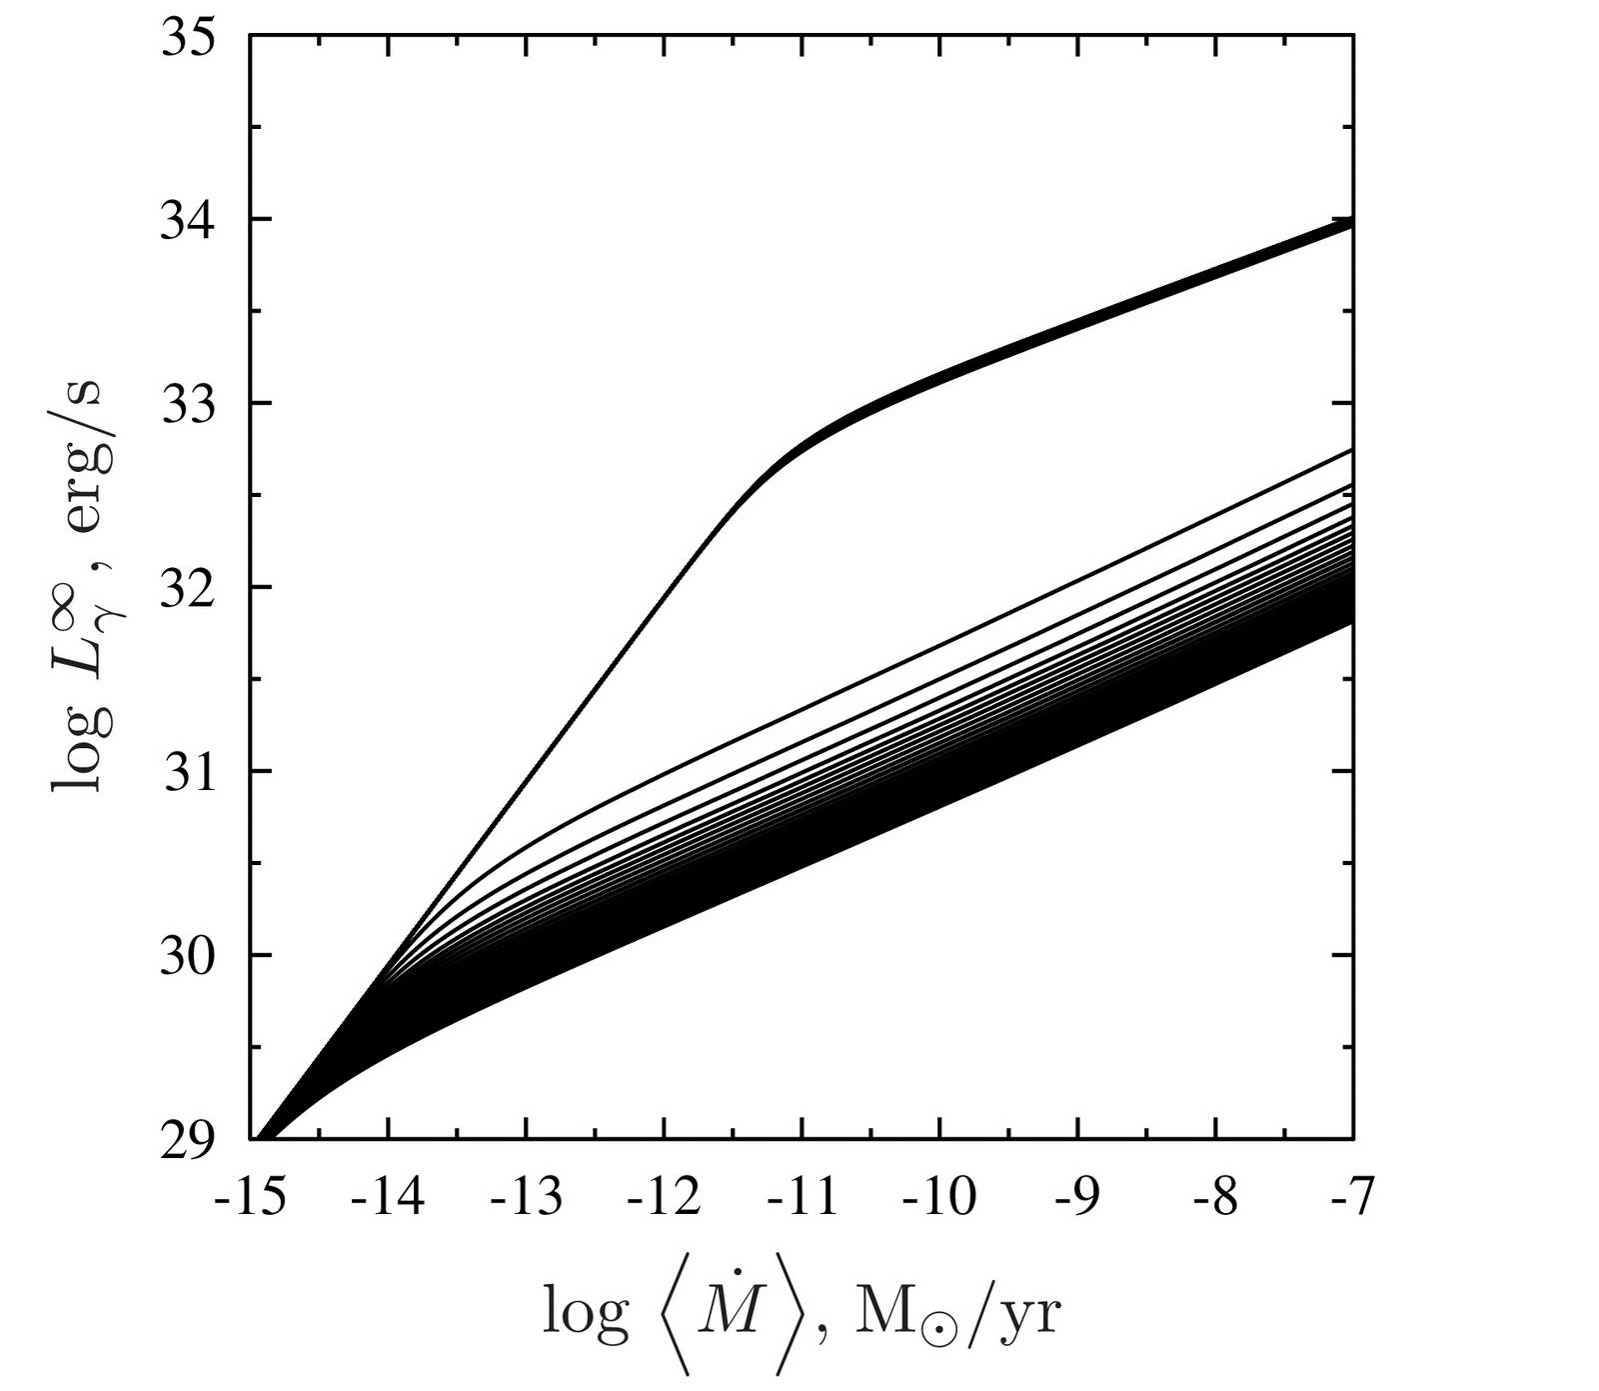
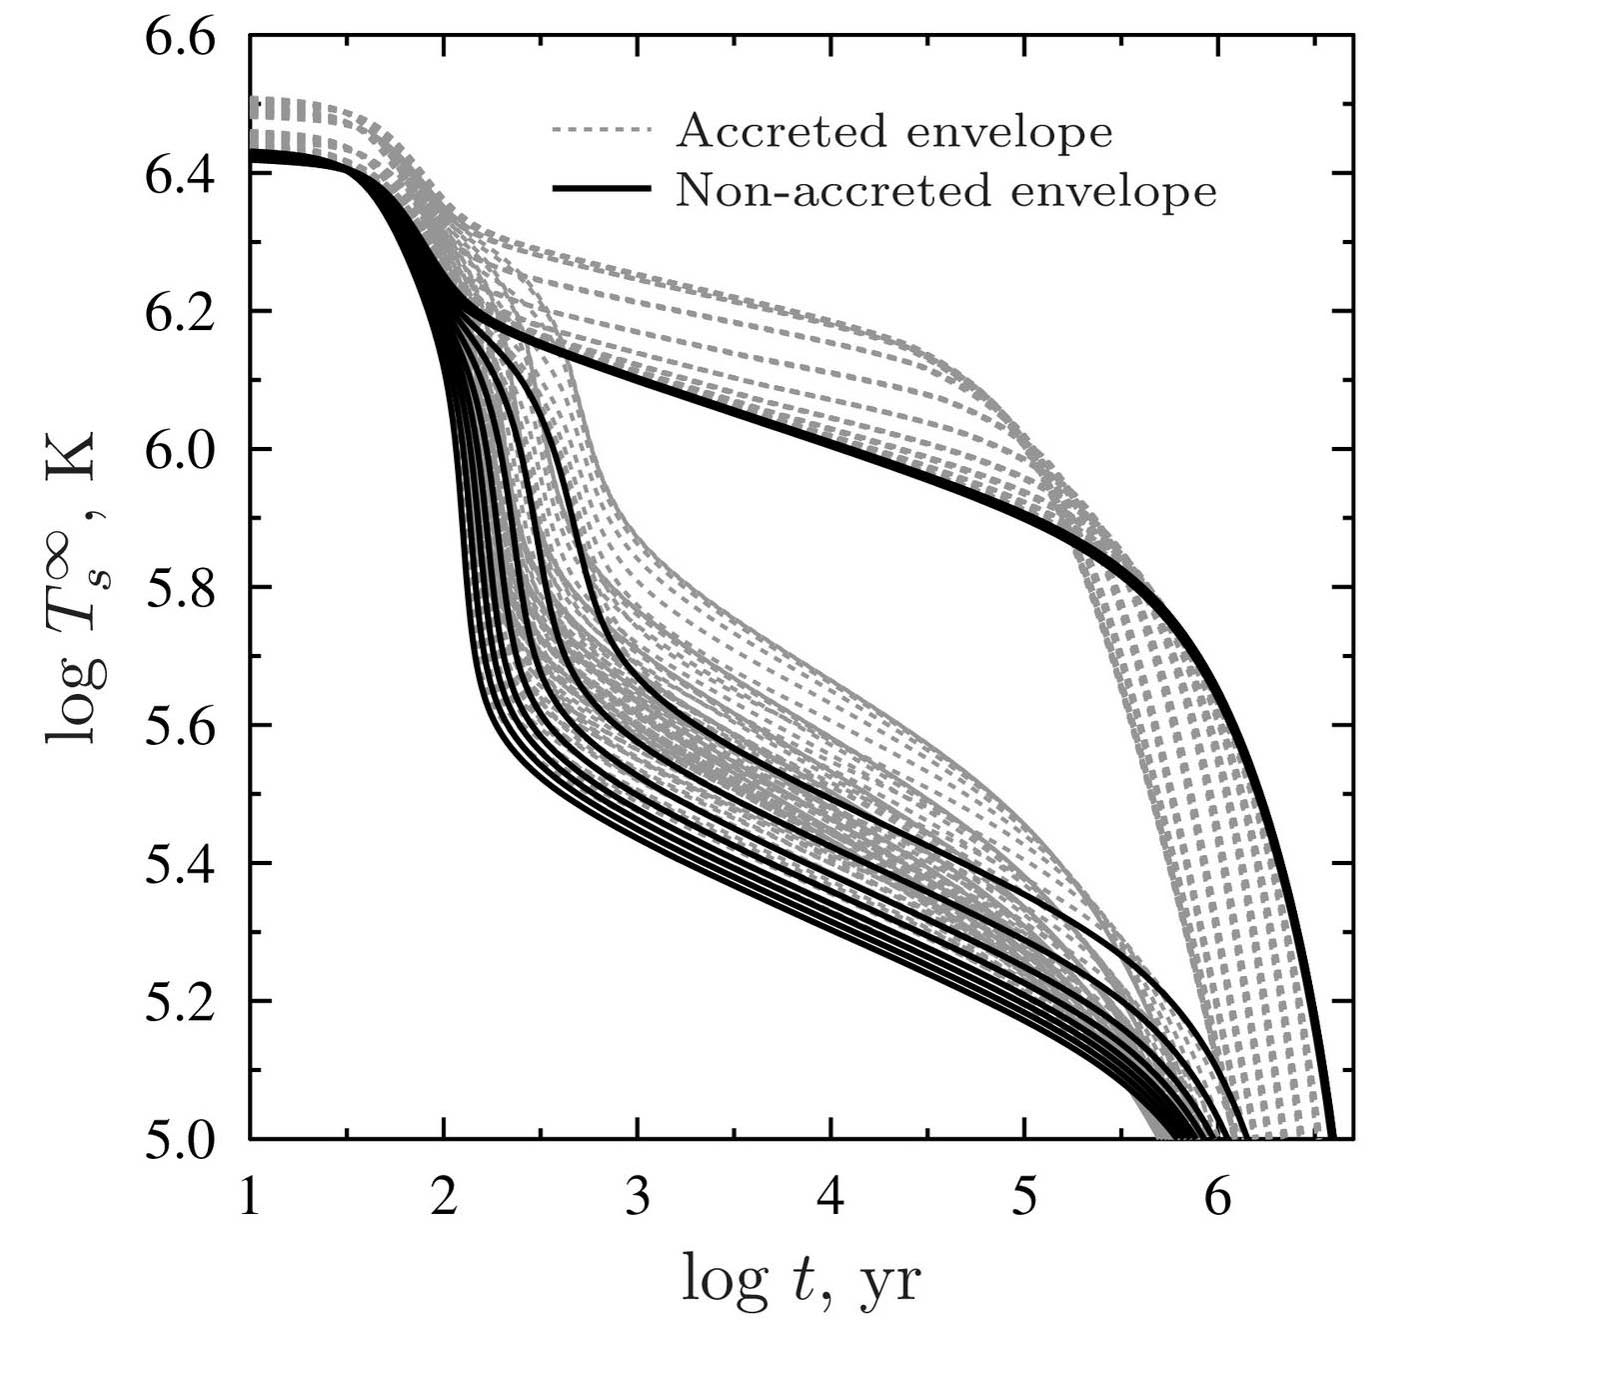
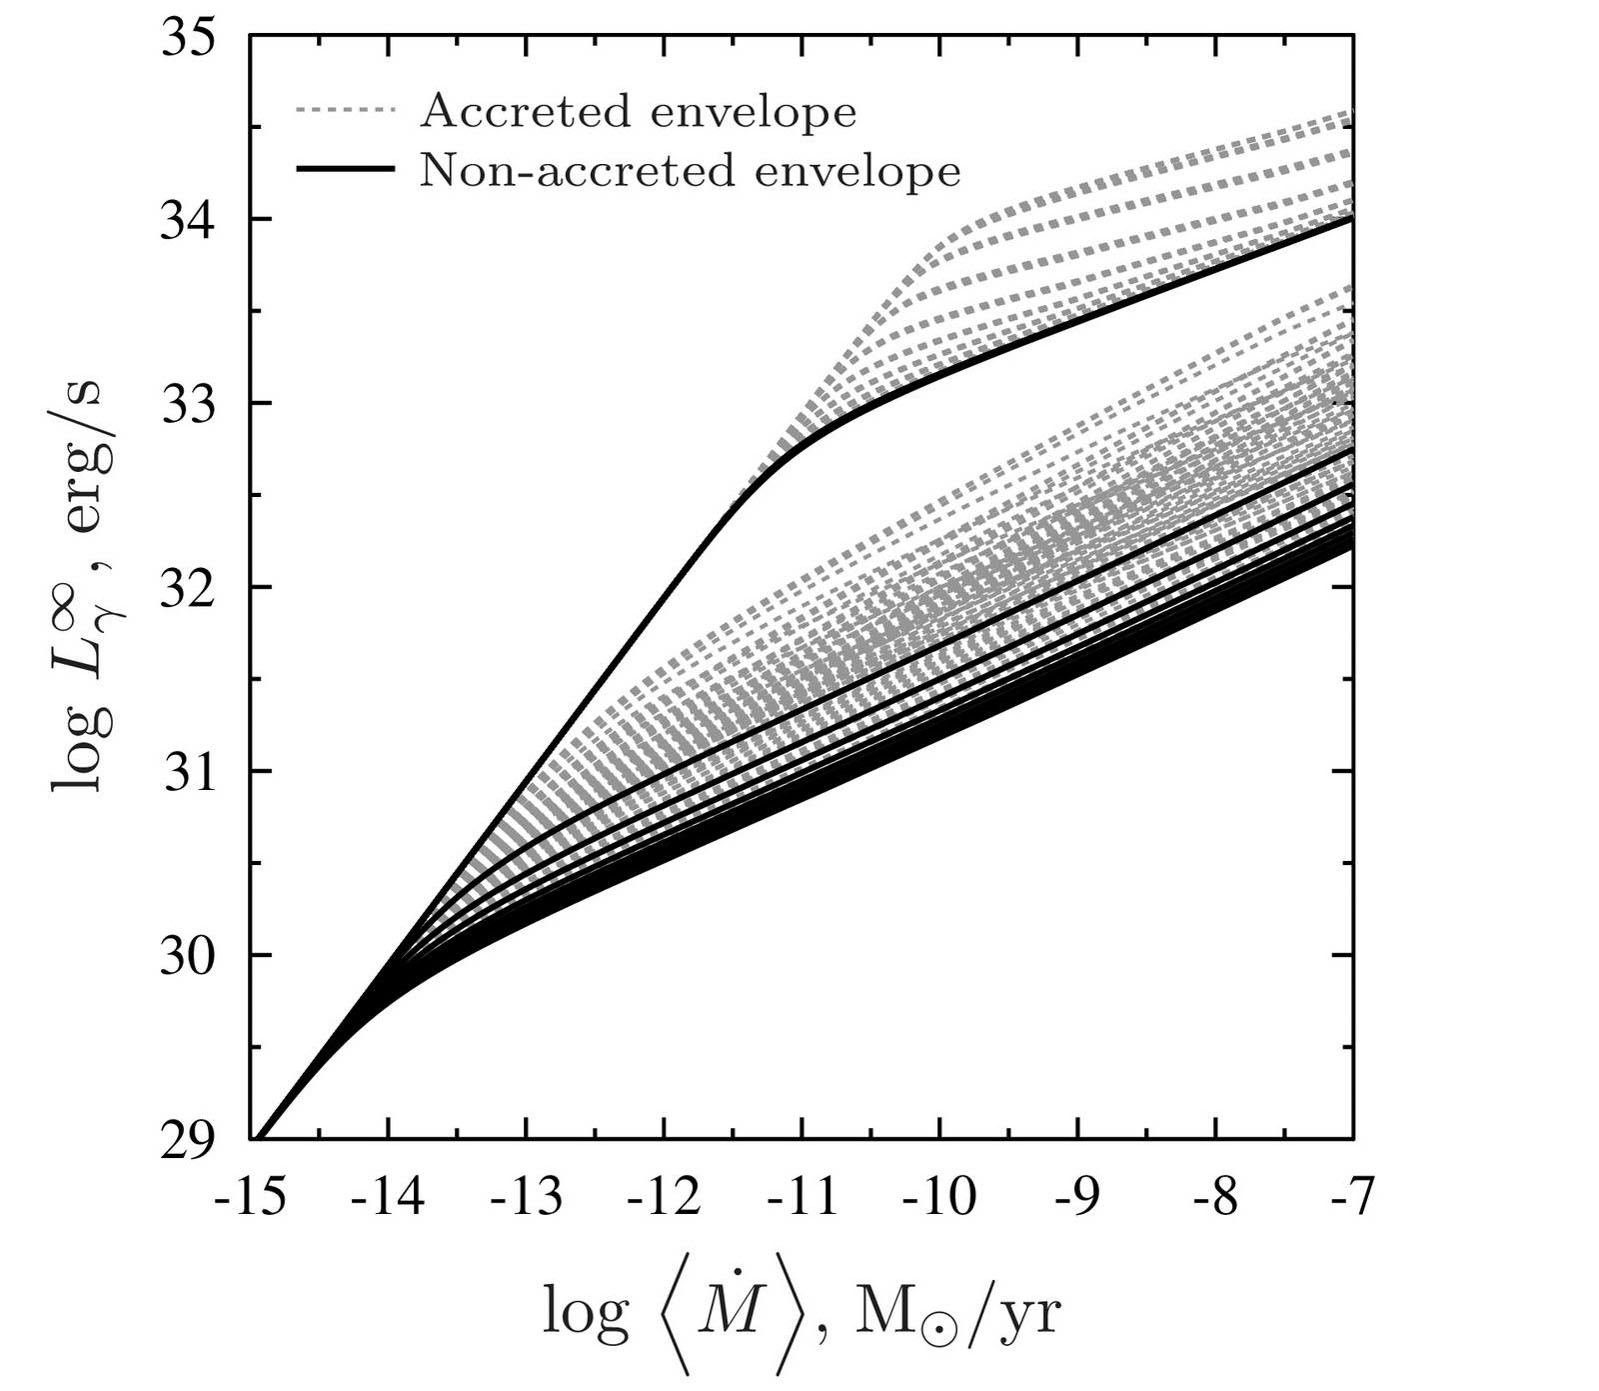
For example, Figs. 3 and 4 show sequences of cooling and heating curves of neutron stars of masses from to (with the mass step ); for simplicity, the heat blanketing envelopes are assumed to be made of iron. Indeed, this theory can in principle explain any cooling or heating curve in the space between the upper () and lower () curves, but the explanation might be unlikely. For instance, all cooling curves of stars with in Fig. 3 merge actually into single (basic) cooling curve which describes cooling of non-superfluid neutron stars via the modified Urca process of neutrino emission (e.g., Yakovlev & Pethick 2004, and references therein). However, at the power direct Urca process appears in an inner kernel of the star, the star cools much faster, and becomes much colder than the stars with . Therefore, we have actually two types of cooling stars – slowly cooling (, “warm”) and rapidly cooling (, “cold”) ones separated by a “gap”; intermediate coolers are available but rather improbable. Equivalently, we have two types of heating neutron stars (Fig. 4) – sufficiently warm () and much colder () ones; intermediate stars are again rather improbable (the latter circumstance is evident but is not widely known in the literature). The presence of light elements in the heat blanketing envelope (i.e. accreted envelopes instead of pure iron) somewhat reduce the “gap” and smooths the transition between “cold” and “warm” stars. But as can be seen from Figs. 5 and 6, the presence of accreted matter cannot actually merge two populations and fill in the “gap”. The existence of these two representative types of cooling and heating neutron stars separated by a small amount of intermediate sources formally contradicts the observations (Sect. 2, Figs. 1 and 2). We will show that it is actually not so.
Now we are ready to formulate statistical theory of the thermal evolution of neutron stars. The stars in question are assumed to have the same internal structure (EOS, neutrino emission properties) but they can naturally have different parameters such as mass, the amount of light elements in heat-blanketing envelopes, magnetic fields, rotation, etc. In this situation instead of deterministic cooling/heating curves in appropriate diagrams we can introduce probabilistic (statistical) description, and discuss the probability distributions to find a star in different places of a diagram. These distributions can be obtained by averaging the cooling/heating curves over statistical distributions of probabilistic parameters such as masses and the amount of light elements in heat-blanketing envelopes. After this averaging, the cooling/heating, that initially followed specific trajectories, is replaced by statistical probabilities to find neutron stars at different stages of their evolution.
In order to illustrate this scheme we simplify our consideration. First, we neglect the effects of magnetic fields and rotation on thermal states of cooling neutron stars and transiently accreting neutron stars in XRTs. This seems to be a reasonably valid first approximation. To study isolated cooling neutron stars and transiently accreting neutron stars we introduce the distribution functions over neutron star masses for these sources, and . These functions are naturally different; the masses of accreting neutron stars should be overall higher than those of isolated neutron stars.
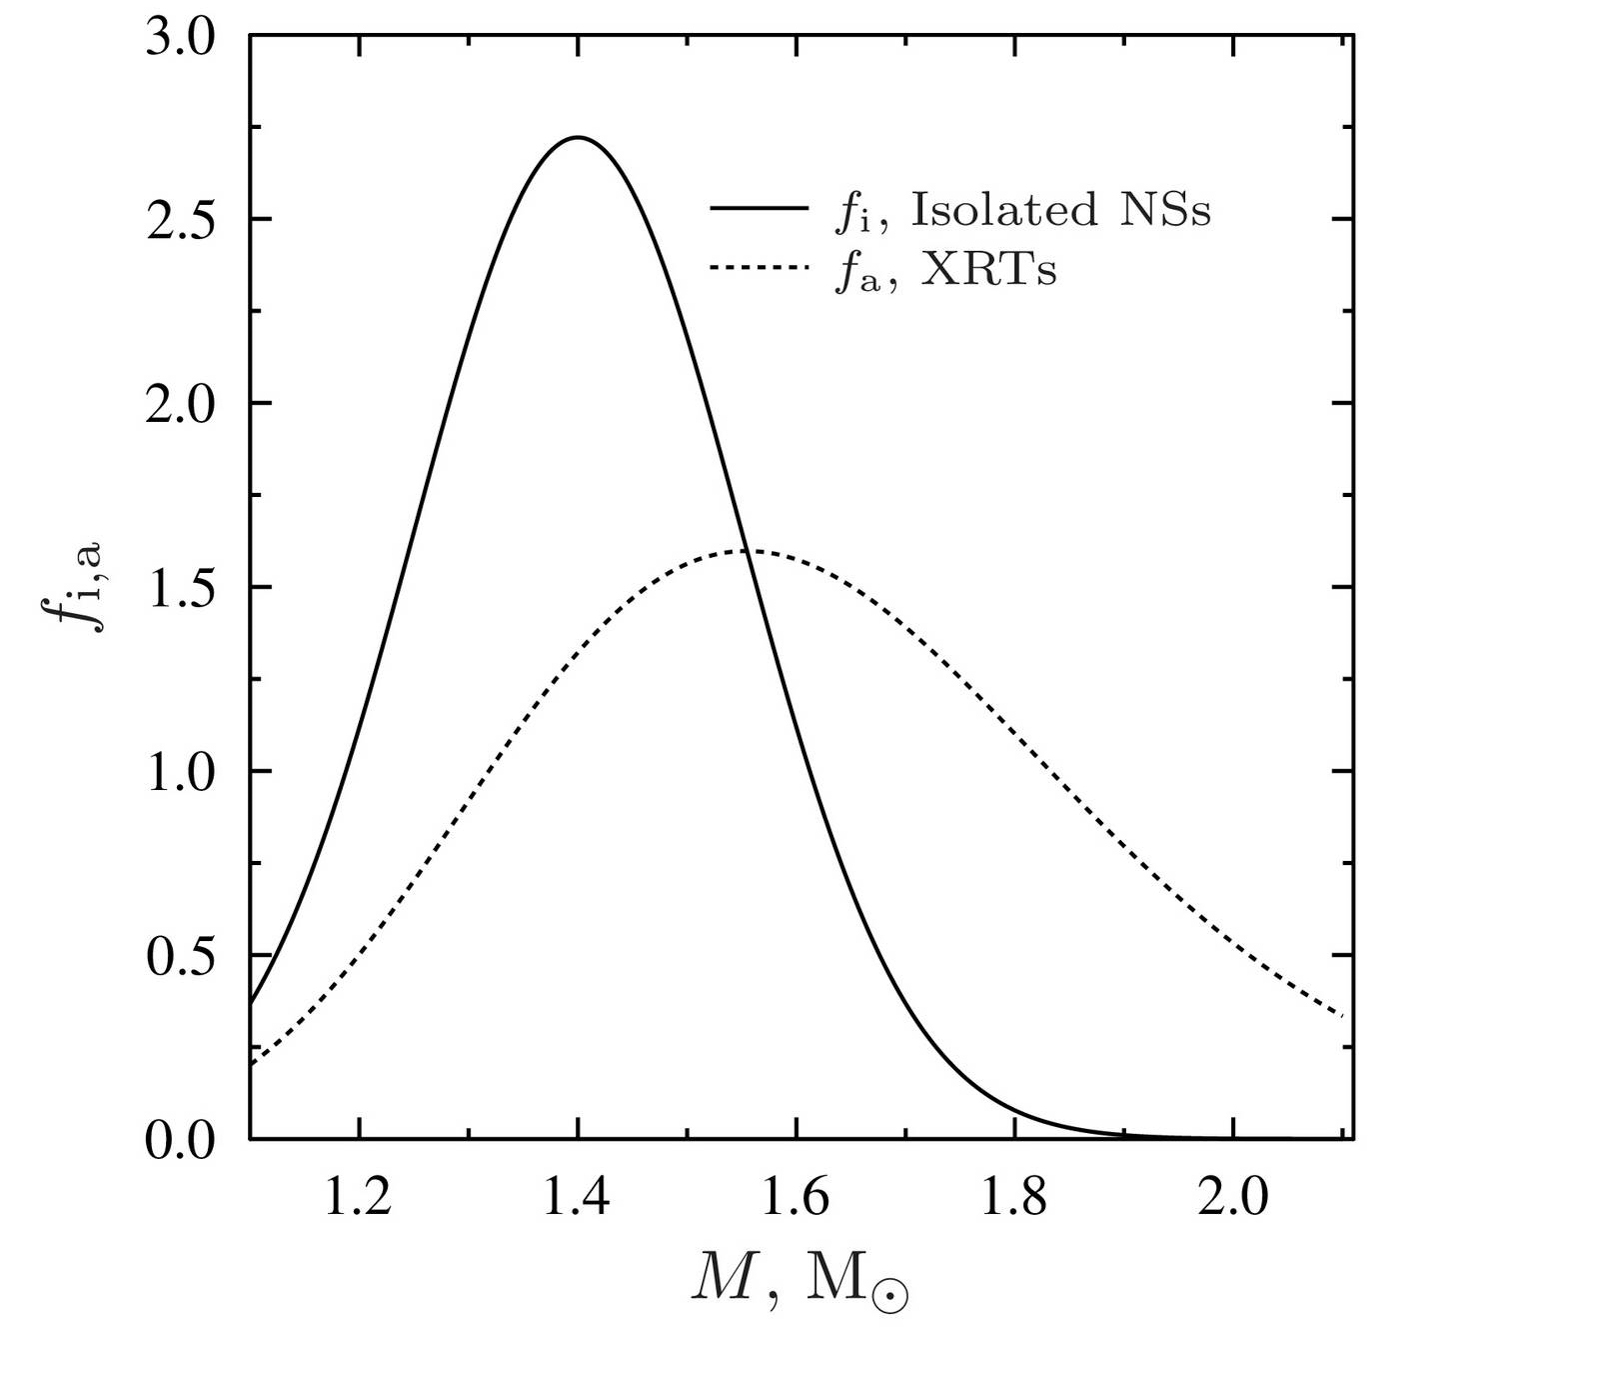
These distribution functions are taken in the form (Fig. 7)
| (2) |
where and are the parameters of the distributions; are normalization factors, which rescale these distribution to the finite mass range from to . For and these distribution functions are artificially set to zero. Note that for the normal distribution function , the parameter is the most probable mass. However, for the lognormal distribution the most probable mass is equal to M. After some test runs we have taken the distributions with M⊙, M⊙; and ; the most probable mass for the accreting neutron stars is 1.55 M⊙. It seems these functions do not contradict the data and theoretical expectations (e.g., Kiziltan et al. 2013) but they are definitely not unique. It is important that accreting neutron stars are overall heavier as a natural result of accretion.
The heat transparency of the blanketing envelope is determined by the mass of light elements (mainly, hydrogen and helium) in these envelopes. The higher , the larger thermal conductivity in the envelope, and the higher for a given internal temperature of the star (e.g., Potekhin, Chabrier & Yakovlev 1997). However, cannot be larger than because at formally larger the light elements at the bottom of the heat blanketing envelope transform into heavier ones due to beta captures and pycnonuclear reactions. We will consider as a random quantity which is characterized by a distribution function . By way of illustration, in calculations we take
| (3) |
The distribution is highly uncertain; we take (3) to show the range of effects such distributions can produce.
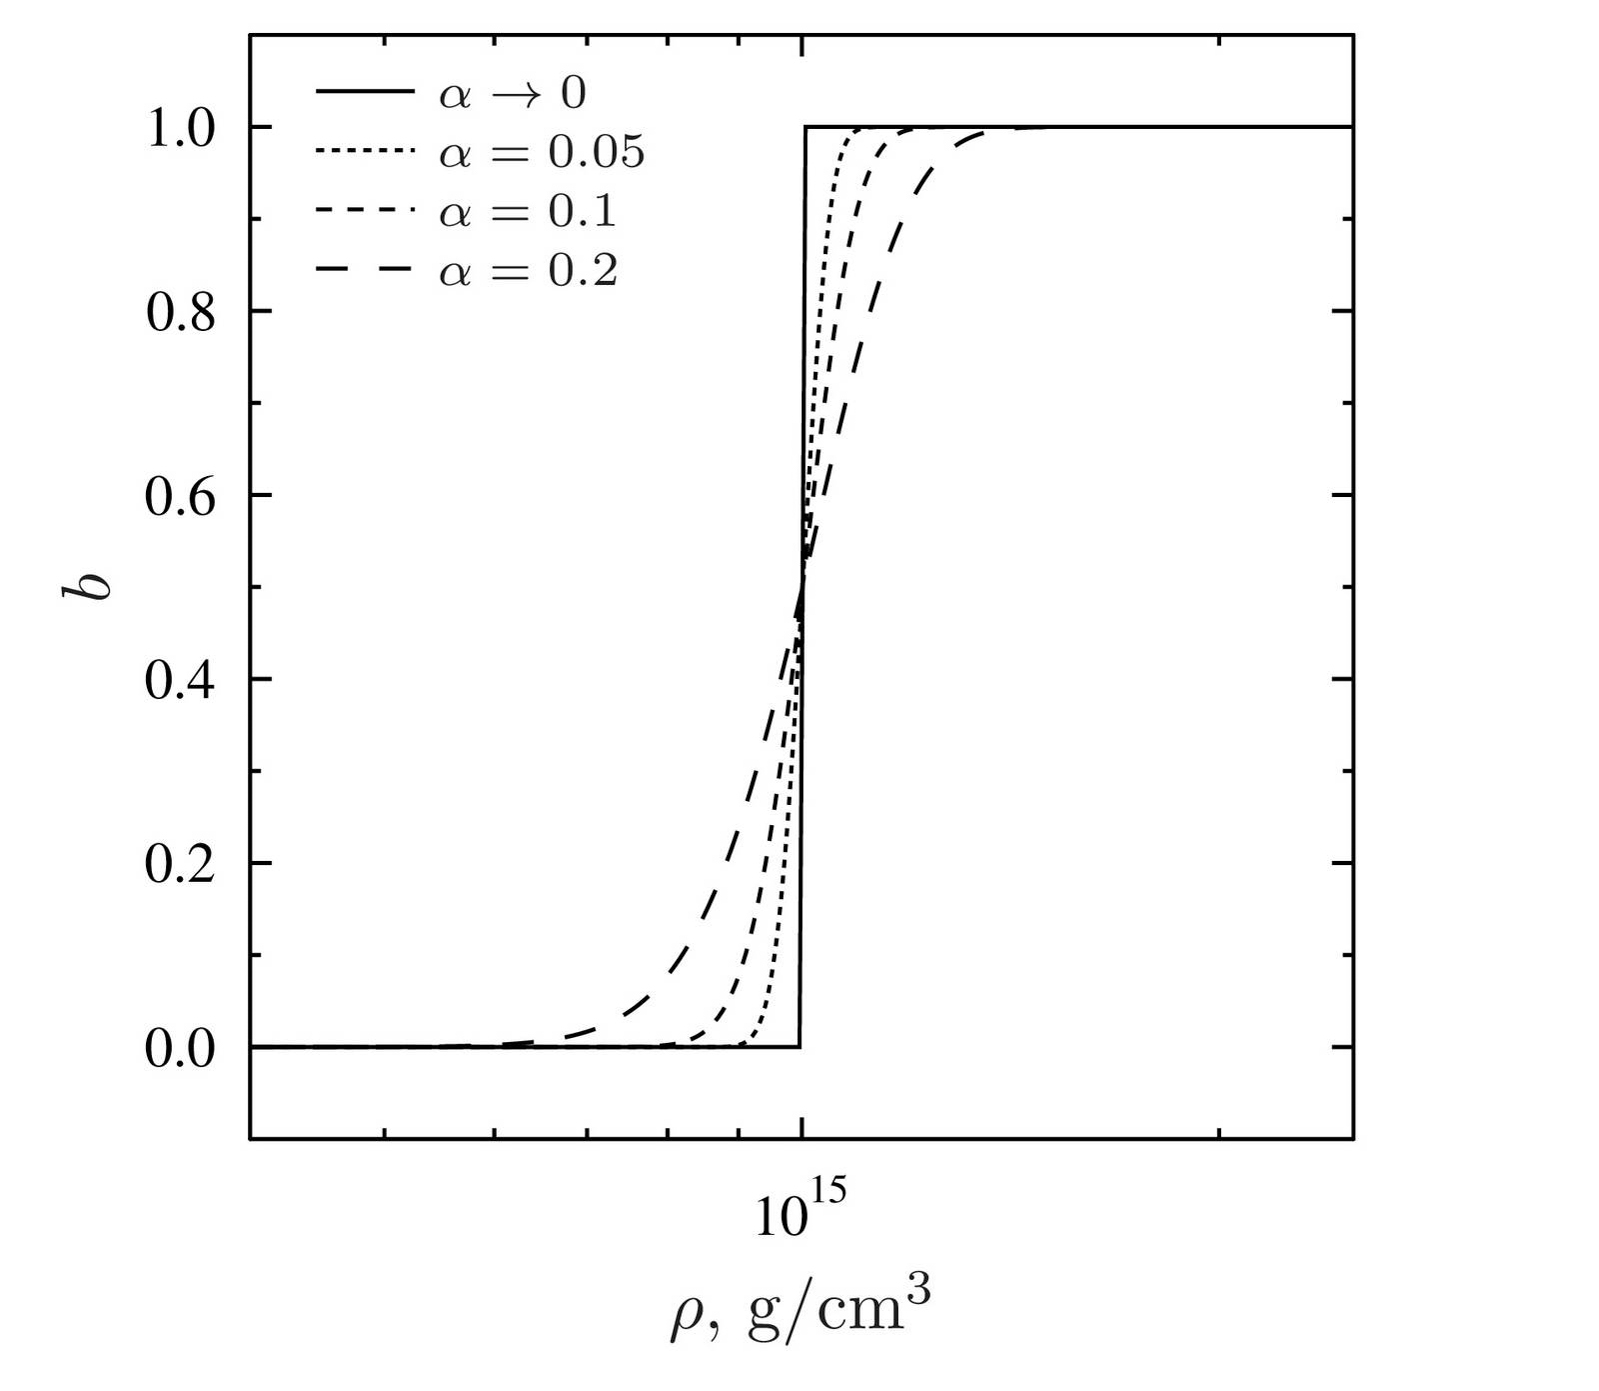
Our cooling code (Gnedin, Yakovlev & Potekhin, 2001) allows us to take into account the effects of superfluidity on thermal evolution of neutron stars. To reduce the number of variable parameters, we employ a semiphenomenological approach (although we mention some effects of superfluidity in Section 4.1). In particular, we will broad out artificially a step-like density dependence of the neutrino emissivity provided by the direct Urca process (Lattimer et al., 1991). In the absence of superfluidity the direct Urca process switches on sharply with increasing density, from at to finite at (solid curve in Fig. 8). Moreover, in our model HHJ EOS, superdense matter of neutron star cores consists of neutrons with admixture of protons, electrons and muons, and we have direct Urca processes of two types, electronic and muonic ones (e.g., Yakovlev et al. 2001). Accordingly, we have two density thresholds for the onset of the electronic and muonic processes (and the emissivity of both processes – if open – is the same). The density threshold for the muonic process is always higher than for the electronic one. Accordingly, when we increase (or ) the electronic direct Urca always switches on first, sharply (by 6–7 orders of magnitude) increases the neutrino luminosity of the star, and appears to be the leading one. The switch-on of the muonic process with further increase of or is relatively unimportant (although included properly in the calculations). It is well known (see below) that a sharp step-like onset of the direct Urca process is incompatible with observations. One needs to broaden the direct Urca threshold. We will include this broadening on a phenomenological level by multiplying the electronic and muonic neutrino emissivities by a broadening factor . For instance, for the electronic direct Urca we take (Fig. 8)
| (4) |
where is the threshold emissivity, , , erf() is the standard error function, so that at and at , and is a parameter assumed to be small, (see Fig. 8). This parameter determines a narrow range of densities in which the direct Urca process gains its strength. Similar broadening is introduced for the muonic direct Urca process but it does not affect significantly our results.
For example, the broadening of the direct Urca threshold can be provided by proton superfluidity (e.g., Yakovlev et al. 2001). This superfluidity (due to singlet-state pairing of protons) is characterized by the proton critical temperature (e.g., Lombardo & Schulze 2001). The critical temperatures are very model dependent, with a large scatter of theoretical , so that it is instructive to not to rely on specific theoretical models but to consider on phenomenological level. One can expect that proton superfluidity is strong in the outer core of the neutron star (with K) but becomes weaker or disappears entirely in the inner core, at a few nuclear matter densities. As long as it is strong, it greatly suppresses the direct Urca process (even if the direct Urca is formally allowed) by the presence of a large gap in the energy spectrum of protons. When proton superfluidity becomes weaker with growing , the superfluid suppression is removed and the direct Urca becomes very powerful. It switches on after exceeding some threshold density, but not very sharply, as if the threshold is broadened.
In addition to the nucleonic direct Urca process, there could be weaker processes of fast neutrino emission produced, for instance, by the presence of pion or kaon condensates in inner cores of neutron stars (e.g., Yakovlev et al. 2001, and references therein). These processes are known to be important if the direct Urca process itself is forbidden or greatly suppressed. We will consider such situations in an approximate manner by multiplying the emissivity due to the direct Urca process by a factor , where or imitate the presence of pion or kaon condensations, respectively.
All elements of cooling/heating theory of neutron stars employed in our calculations are not new. The new element consists in implementing statistical theory (distributions over the neutron star masses and over the amount of light elements in the heat blanketing envelopes).
4 Results and discussion
4.1 Broadening direct Urca threshold
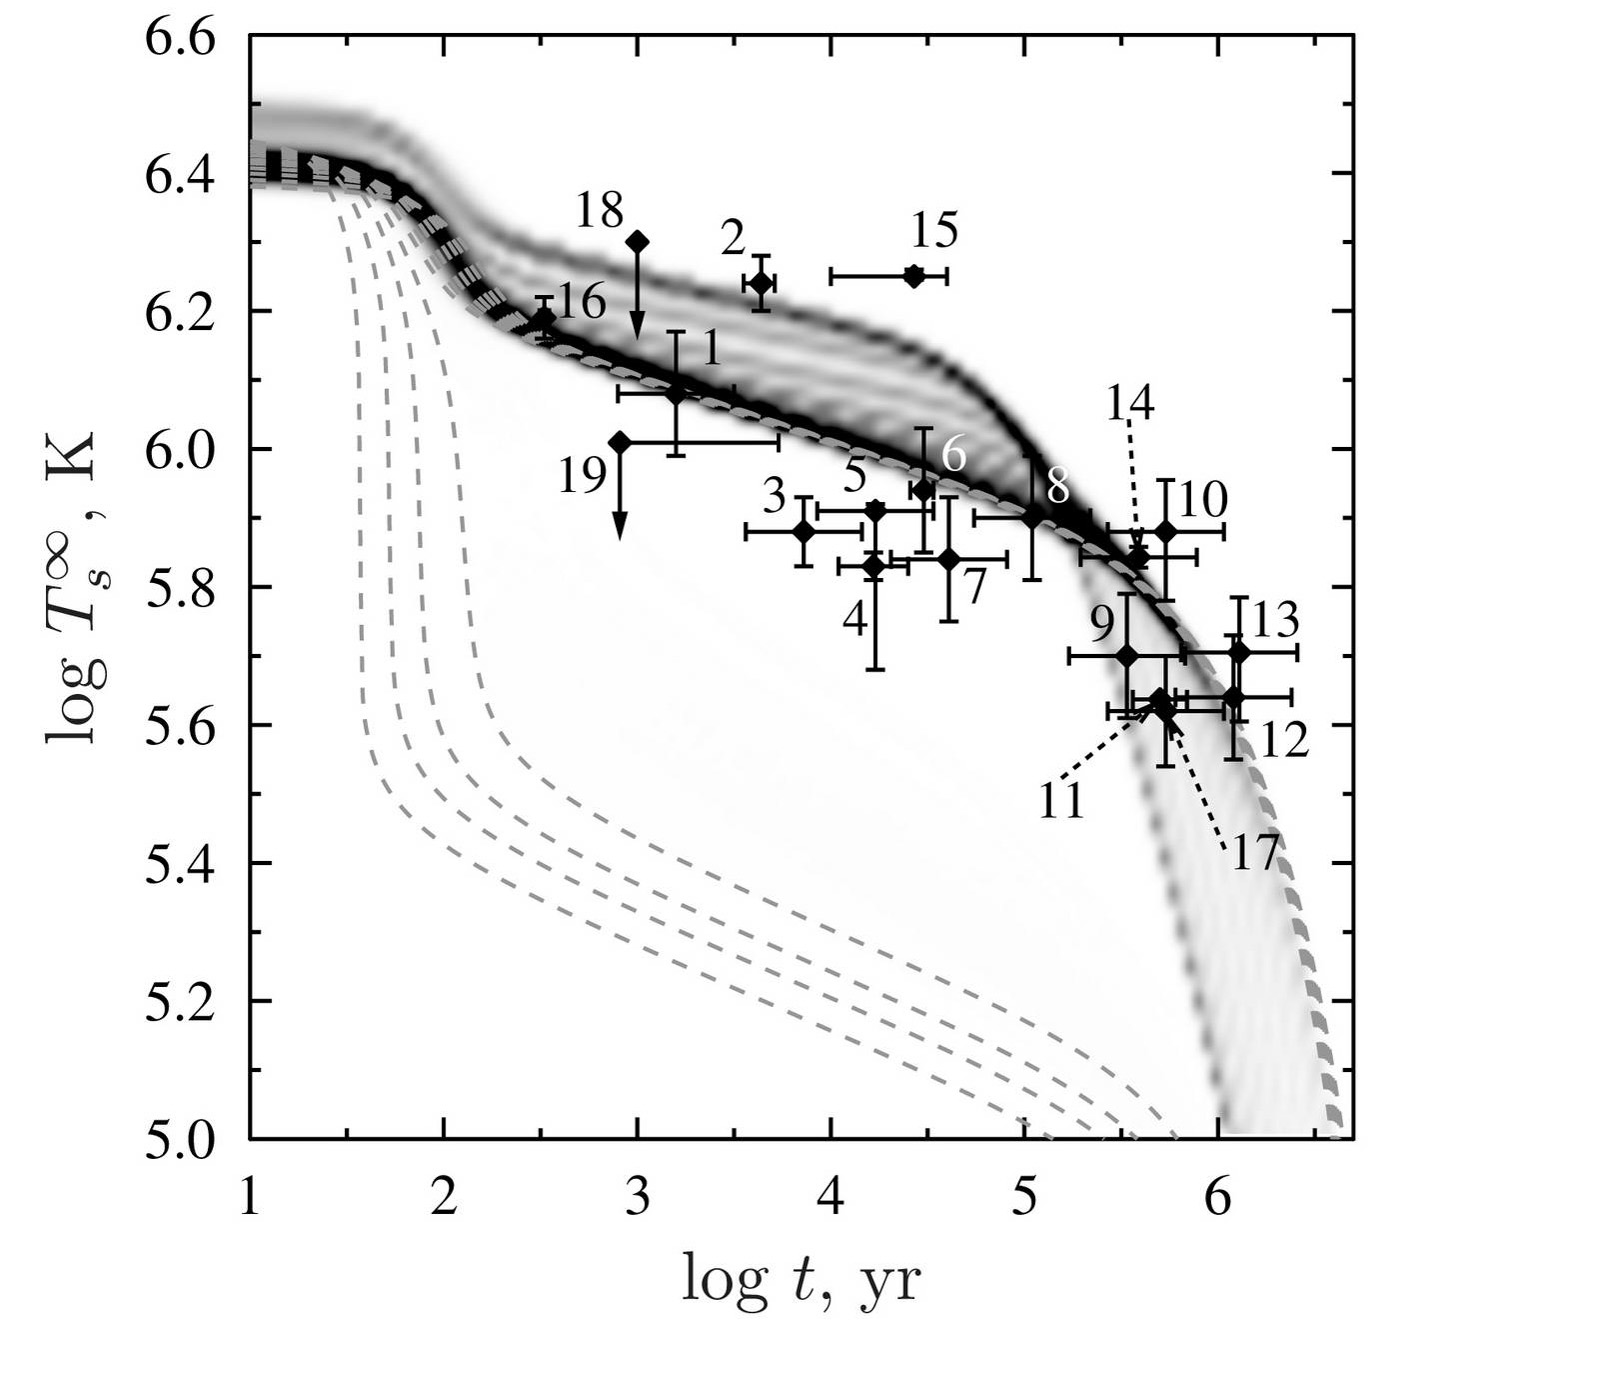
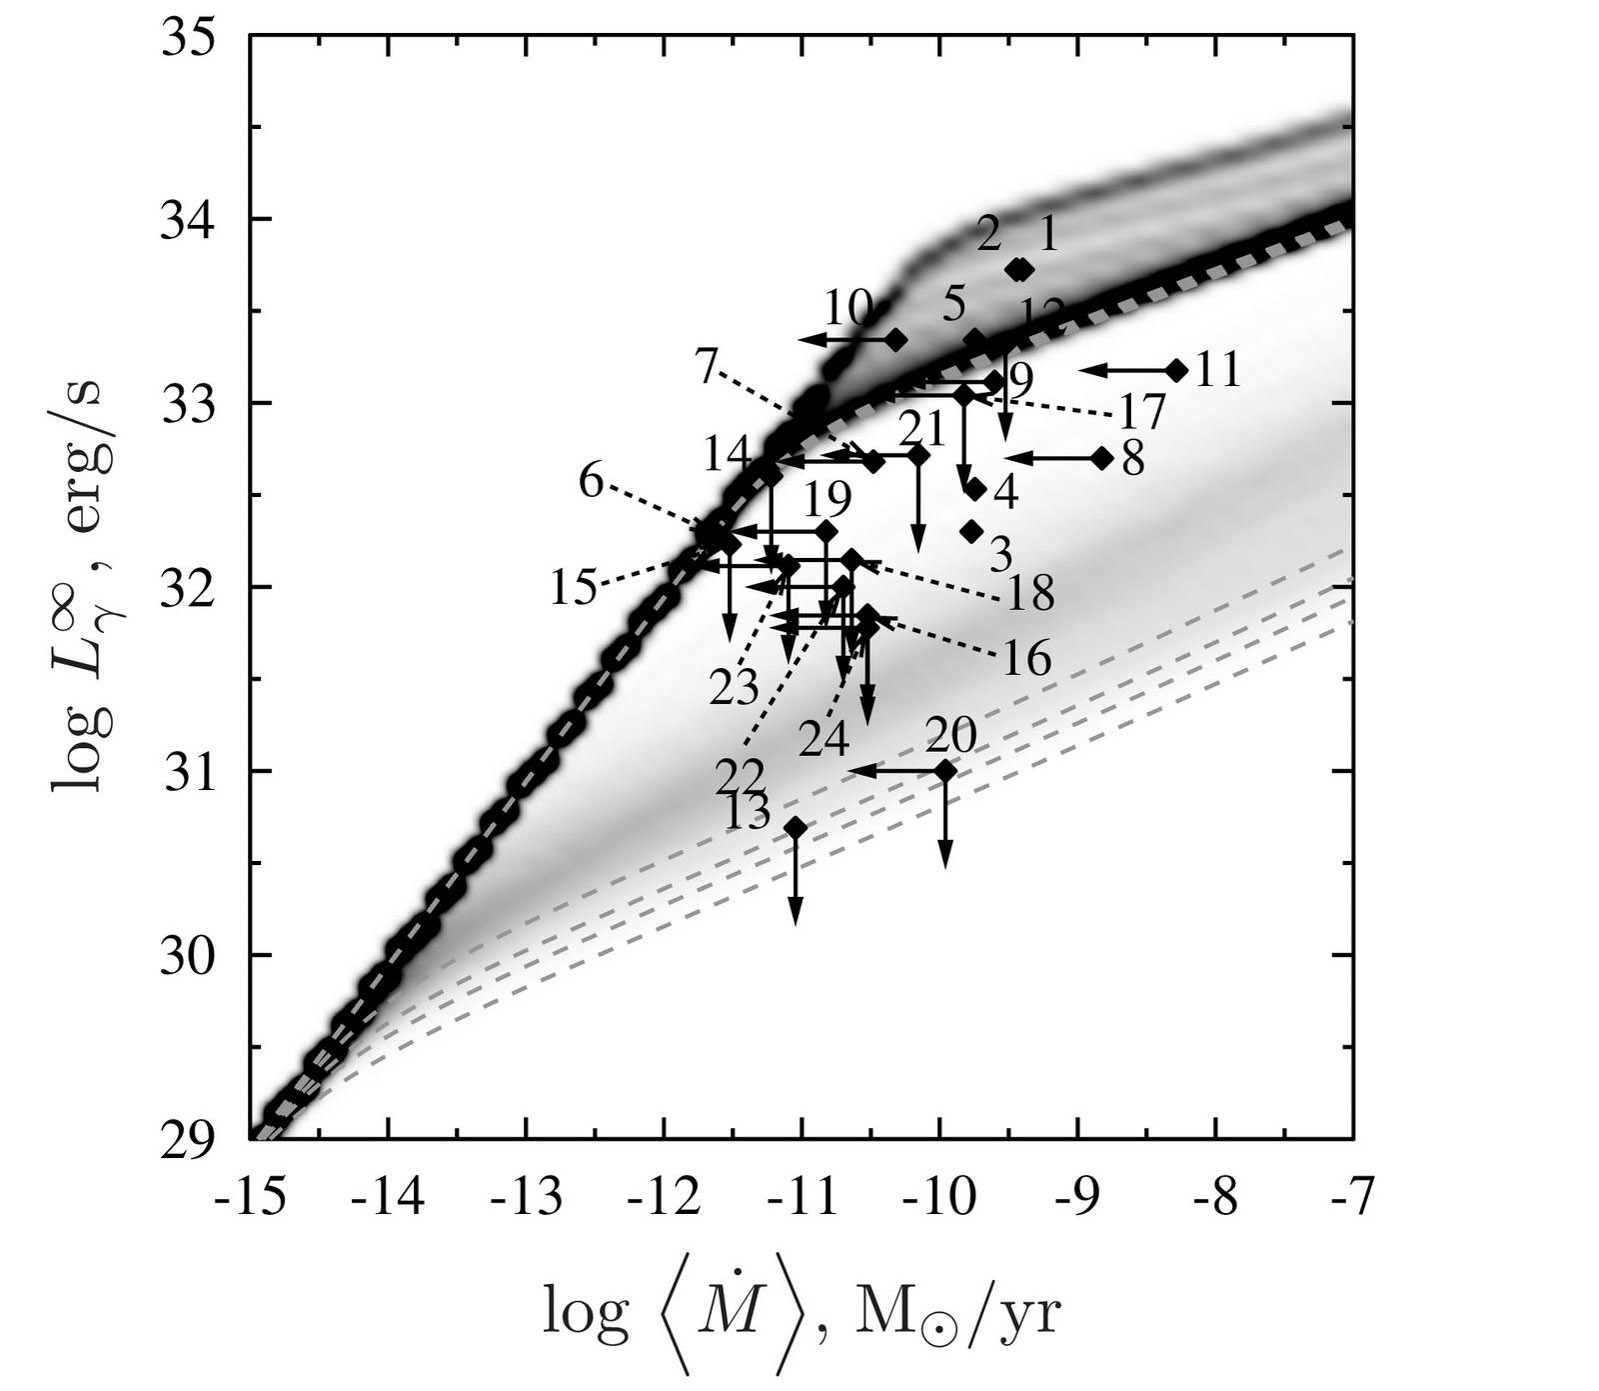
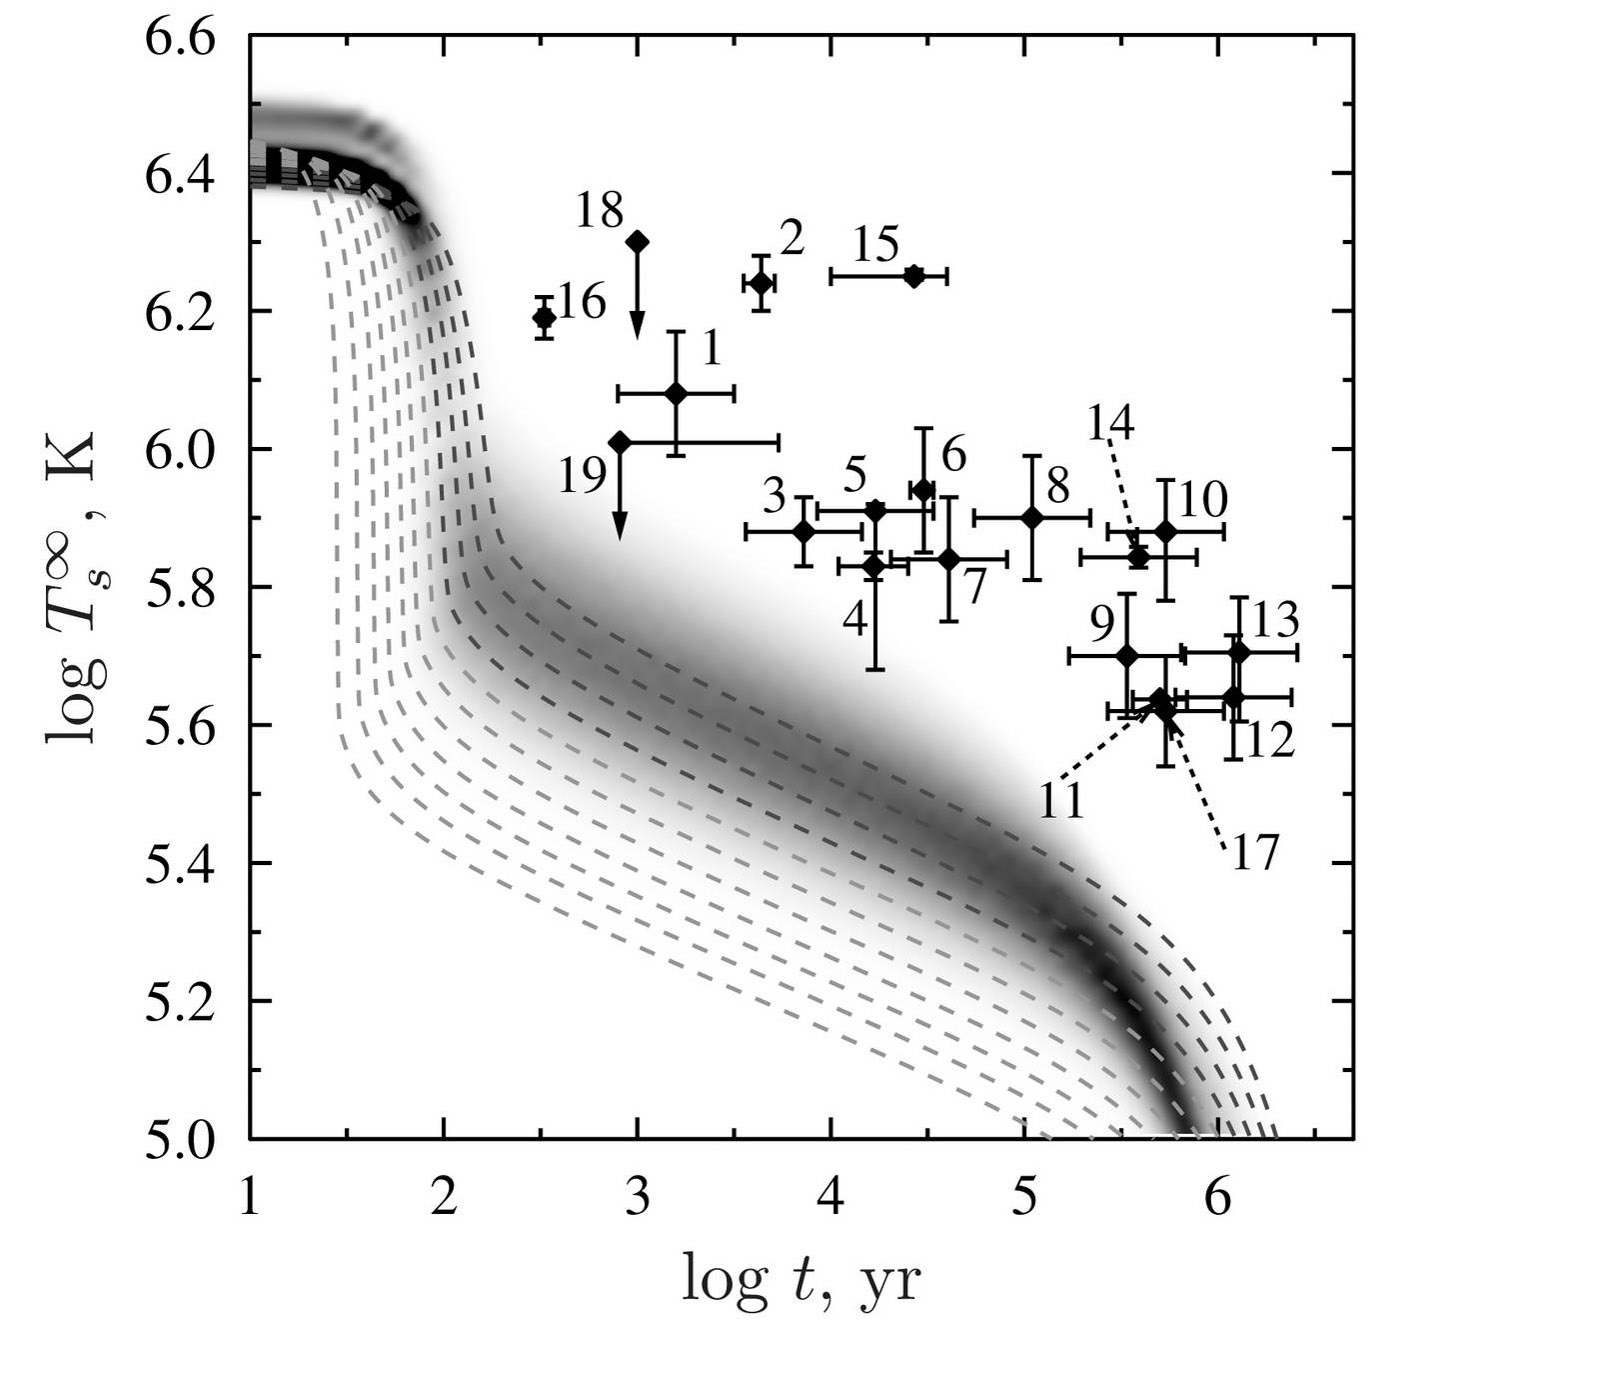
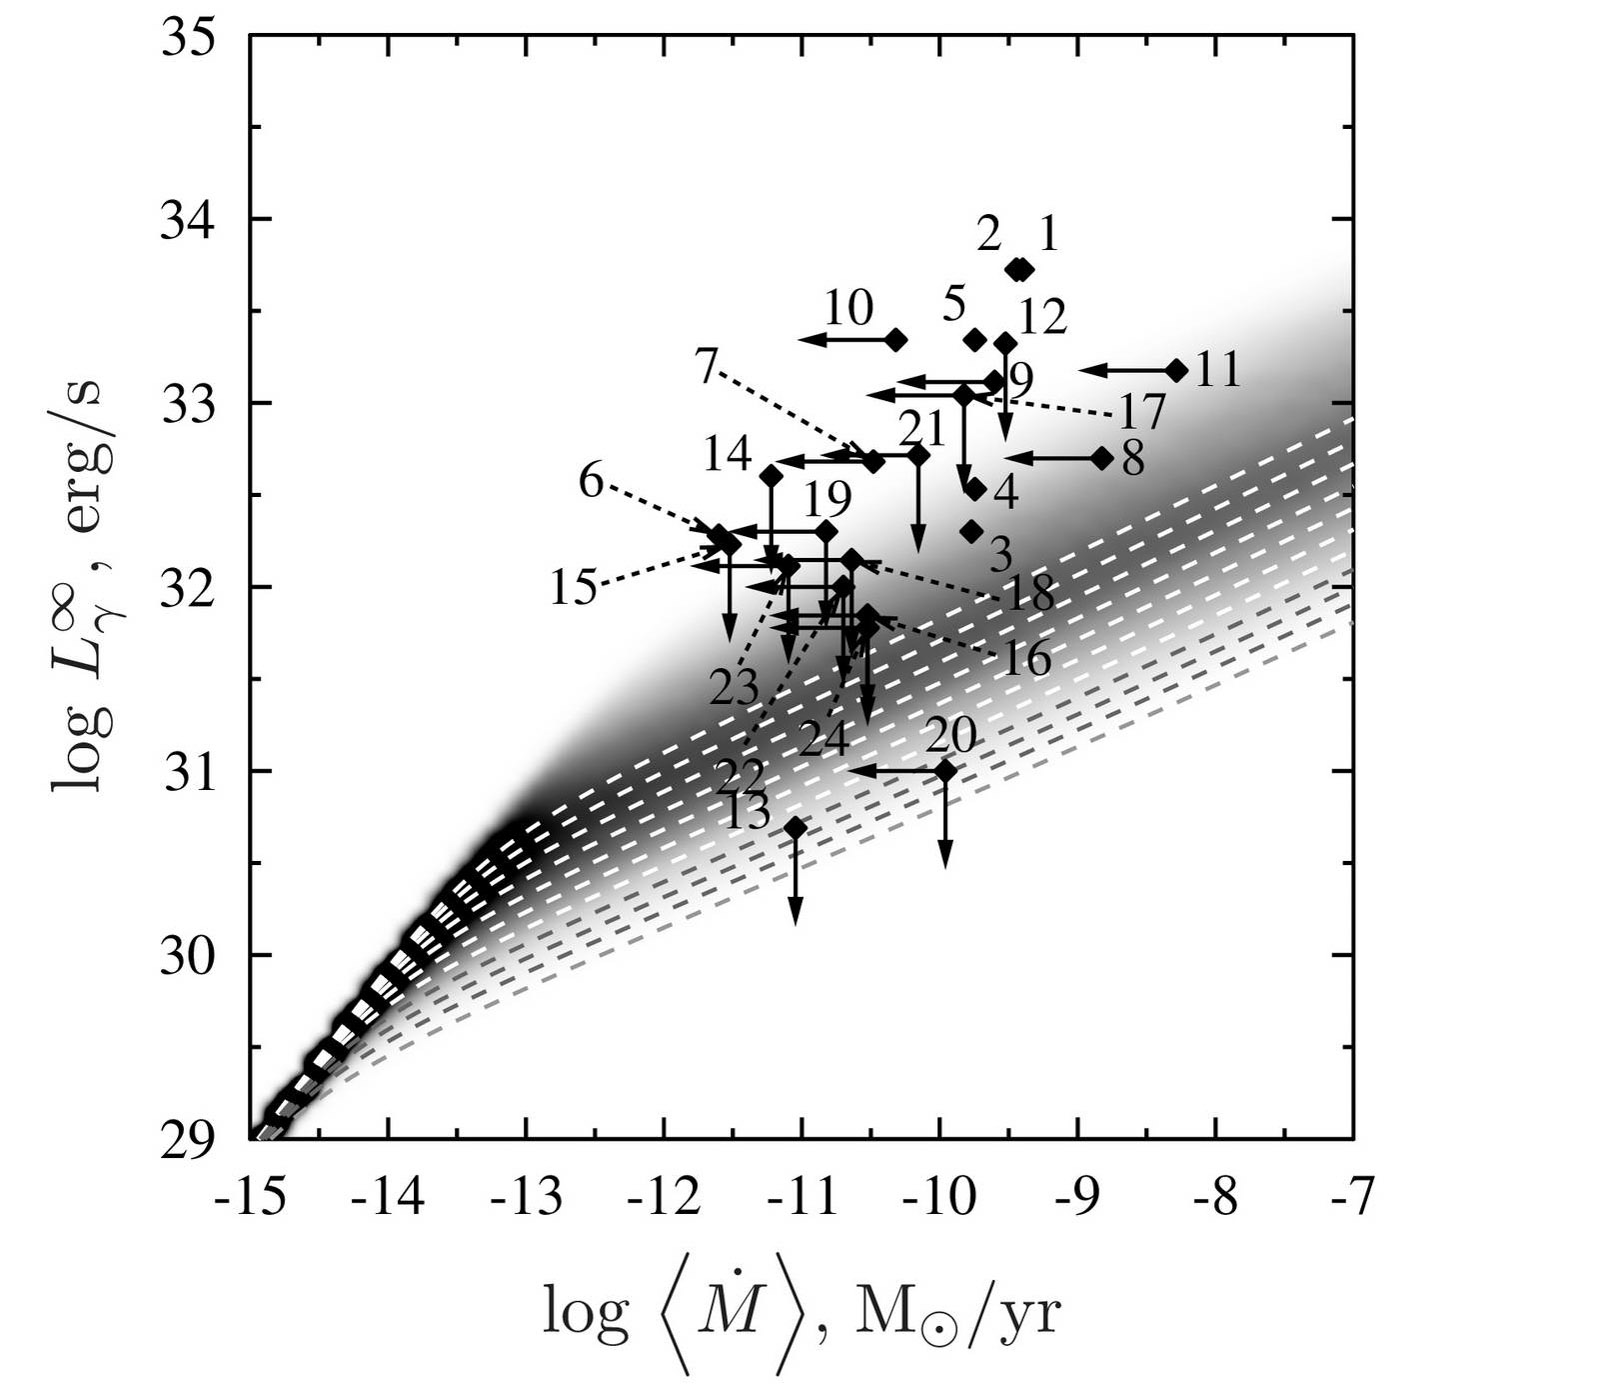
Figs. 9 and 10 show calculated probabilities to find isolated cooling neutron stars and transiently accreting neutron stars in different places of the and diagrams, respectively. The results are compared with observations (Figs. 1 and 2). The probabilities are calculated by averaging over neutron star masses in accordance with (2) and over the amount of light elements in the heat blanketing envelopes, equation (3). The probability distribution is presented by grayscaling (in relative units). The denser the scaling, the large the probability. White regions refer to zero or very low probability.
In Figs. 9 and 10 the threshold of the direct Urca process is not broadened (the solid line in Fig. 8). Because of the sharp contrast of neutrino luminosities of neutron stars with open and closed direct Urca process, the averaging (3) does not greatly affect the probabilities to find neutron stars in different places of respective diagrams. This averaging slightly broadens the distributions of rather warm neutron stars () and rather cold ones () but does not remove large “gap” between them. It evidently contradicts the observations of cooling and heating neutron stars.
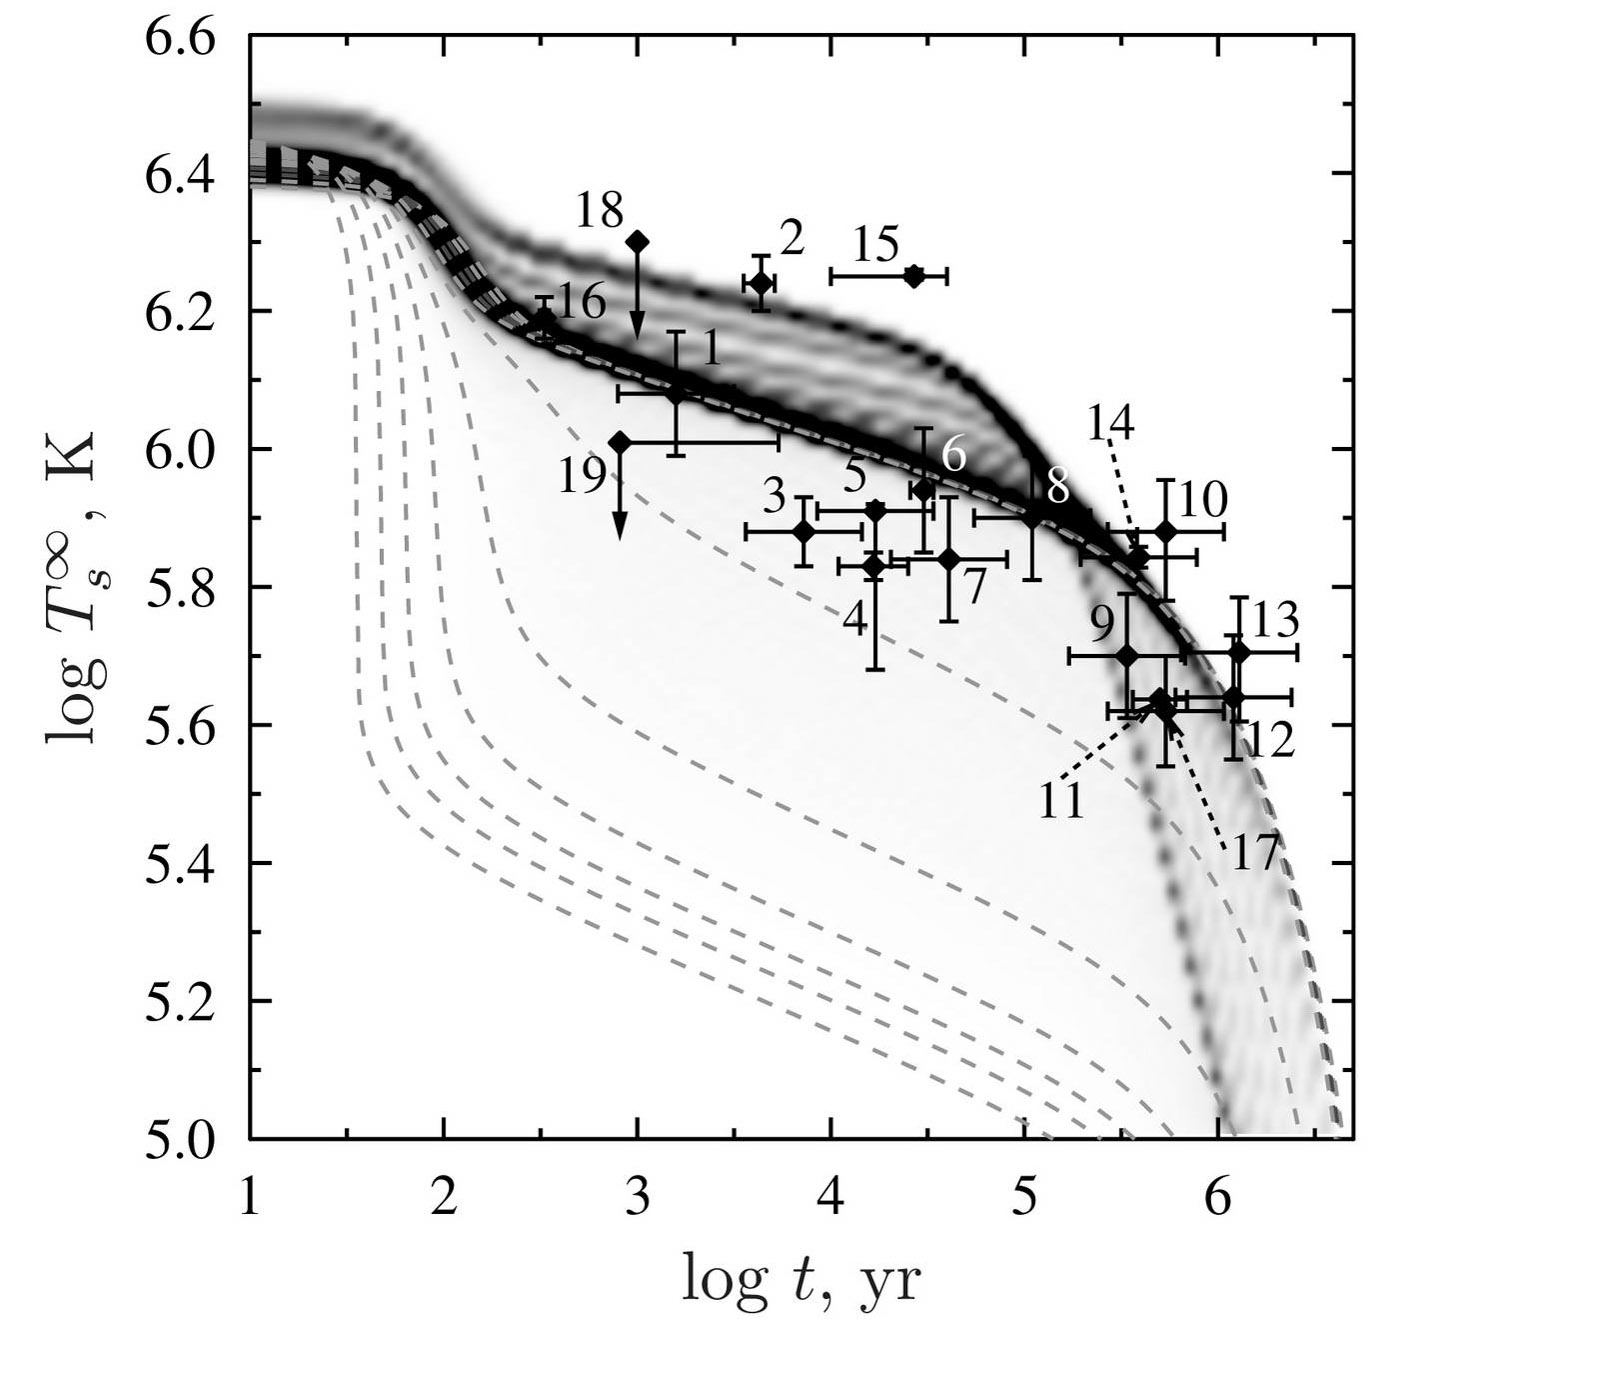
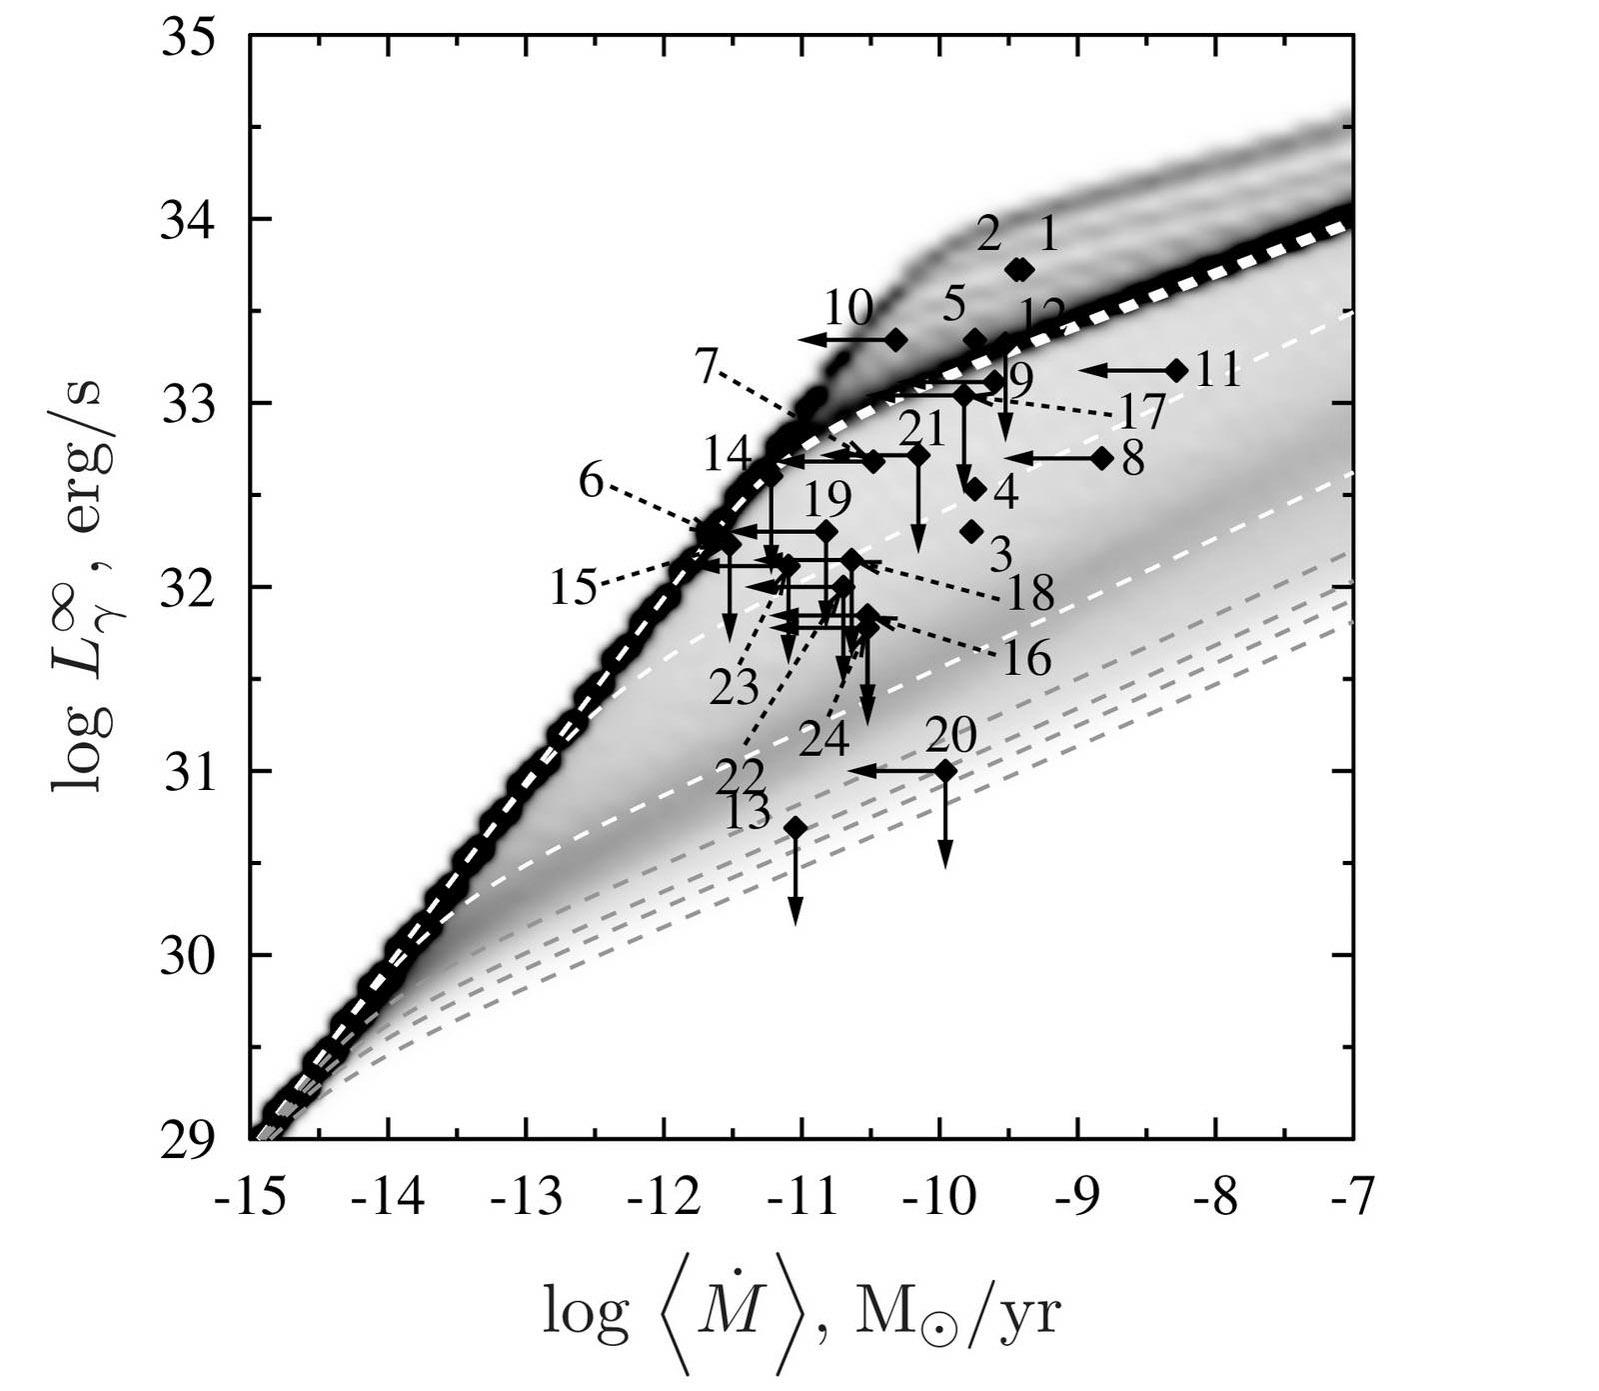
As the next stage let us slightly broaden the direct Urca threshold taking in equation (4) (the dotted line in Fig. 8). The results are plotted in Figs. 11 and 12. As seen from Fig. 11, such a broadening is insufficient to merge the “warm” and “cold” populations of cooling neutron stars (although on these grayscale images it is difficult to see the difference in probability diftributions in Figs. 9 and 11, the difference in “reference” curves is clearly seen). The first glance at Fig. 12 may give an impression that such a small broadening is sufficient for transiently accreting neutron stars in XRTs but it is not so. A thorough examination reveals that the probability density is too high in the region of a few “warmest” sources (1 and 2); in addition, it is too low in the “dense” region of “intermediate” sources such as 19, 21 and 23. One can also notice the non-uniformity of “reference” curves (especially if compared to proper threshold broadening; see below). These facts indicate that provides insufficient broadening of the direct Urca threshold.
Now we broaden the direct Urca threshold in a such way that probability density coincides with observational data for isolated and accreting neutron stars. To achieve this we take in (4); see the short-dashed line in Fig. 8. The results are plotted in Figs. 13 and 14 and seem to be in good agreement with observations; the “gap” is completely removed; the “warm” and “cold” neutron star populations merge into one population as the data prescribe.
In addition, in Fig. 13 we plot two cooling curves for the 1.4 M⊙ star. The dash-and-dot curve is for the case when the star has the iron heat blanket and strong proton superfluidity inside (with the critical temperature K over the core). This superfluifity suppresses the modified Urca process (e.g., Yakovlev & Pethick 2004) and makes the star warmer. For stars of age yr, it produces nearly the same affect on the cooling as the heat blanketing envelope made of light elements. The dashed-double-dot curve is for the same proton superfluidity but for the heat blanket with the maximum amount of light elements. The star becomes even warmer and demonstrates exceptionally slow cooling which is consistent even with observations of XMMU J1732–3445 (source 15), the hottest isolated neutron star (for its age). These two curves are presented for illustration, to demonstrate that the cooling theory is able to explain all the sources. These curves have not been included in the calculations of the probability distribution.
Finally, let us broaden the direct Urca threshold even more, taking in equation (4); see the long-dashed line in Fig. 8. These results are plotted in Figs. 15 and 16. All cooling/heating curves shift towards the “cooler” part of the cooling/heating plane because now the direct Urca process operates even in low mass stars. This situation evidently contradicts the observations.
It has been a longstanding problem to interpret the observations of the transiently accreting source SAX 1808.4–3654 (source 13). It seems to contain a very cold star whose observations in quiescent periods require the operation of direct Urca process, while the observed isolated middle-aged neutron stars do not contain such a cold source. A natural explanation of this phenomenon within the present model is that the neutron star in SAX 1808.4–3654 is sufficiently massive; its mass is larger than typical masses available in the mass distribution of isolated neutron stars. Tuning the parameters of the mass distributions and we naturally explain the effect (Figs. 13 and 14). In this model the very cold isolated middle-aged neutron stars can (in principle) exist in nature (in the tail of the mass distribution ) but as a very rare phenomenon.
Therefore, the model presented in Figs. 13 and 14 seems reasonable to explain the available observations of cooling isolated and transiently accreting neutron stars. The model requires a moderate broadening of the direct Urca threshold and realistic masses of isolated and accreting neutron stars. The broadening can be provided, for instance, by proton superfluidity in the neutron star core as discussed above.
4.2 Less enhanced neutrino cooling
Now consider the question if we can explain the data assuming that the direct Urca process is forbidden in stars of all masses but less powerful process of neutrino emission enhanced, for instance, by pion or kaon condensation in inner cores of massive neutron stars is present. To simulate such models we multiply the neutrino emissivity due to the direct Urca process by a factor , where would be typical for pion condensation and for kaon condensation.
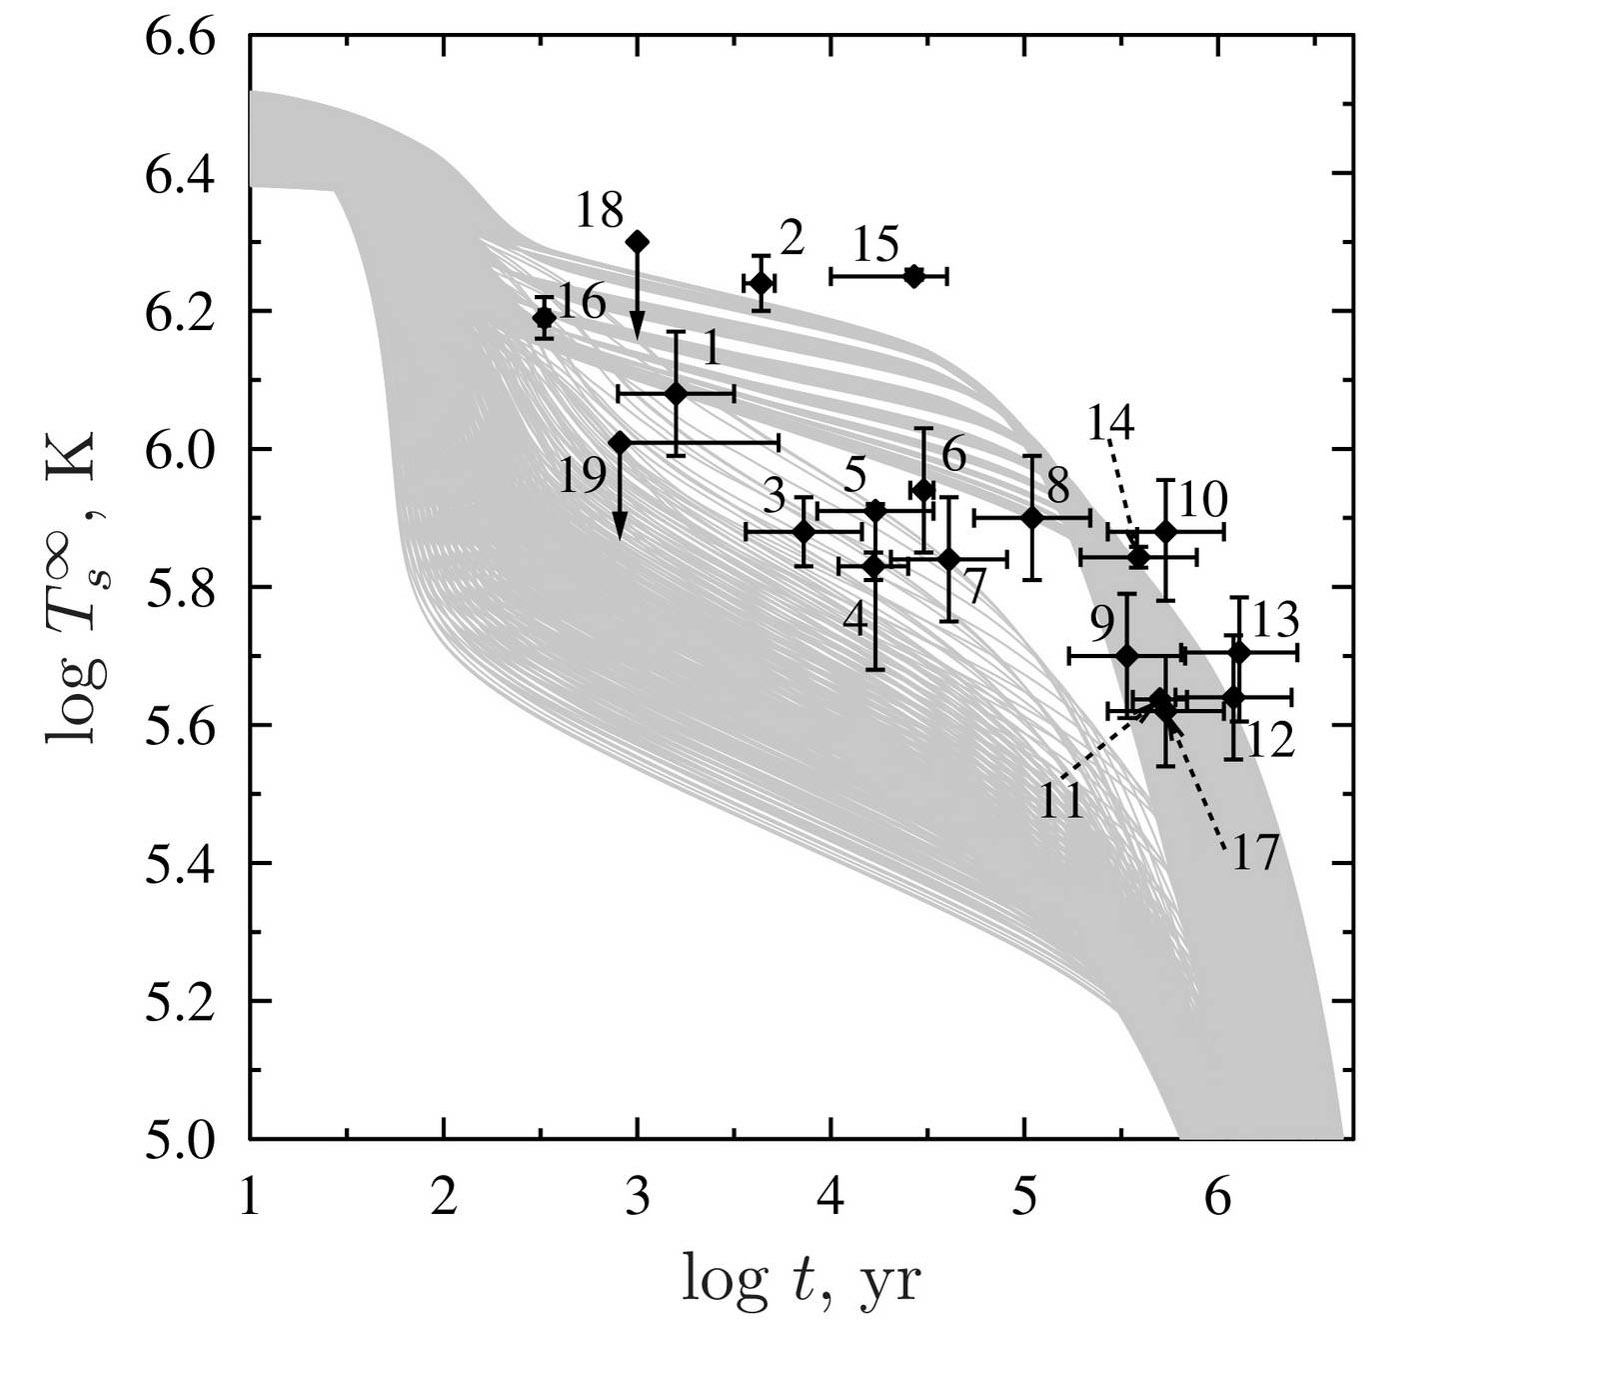
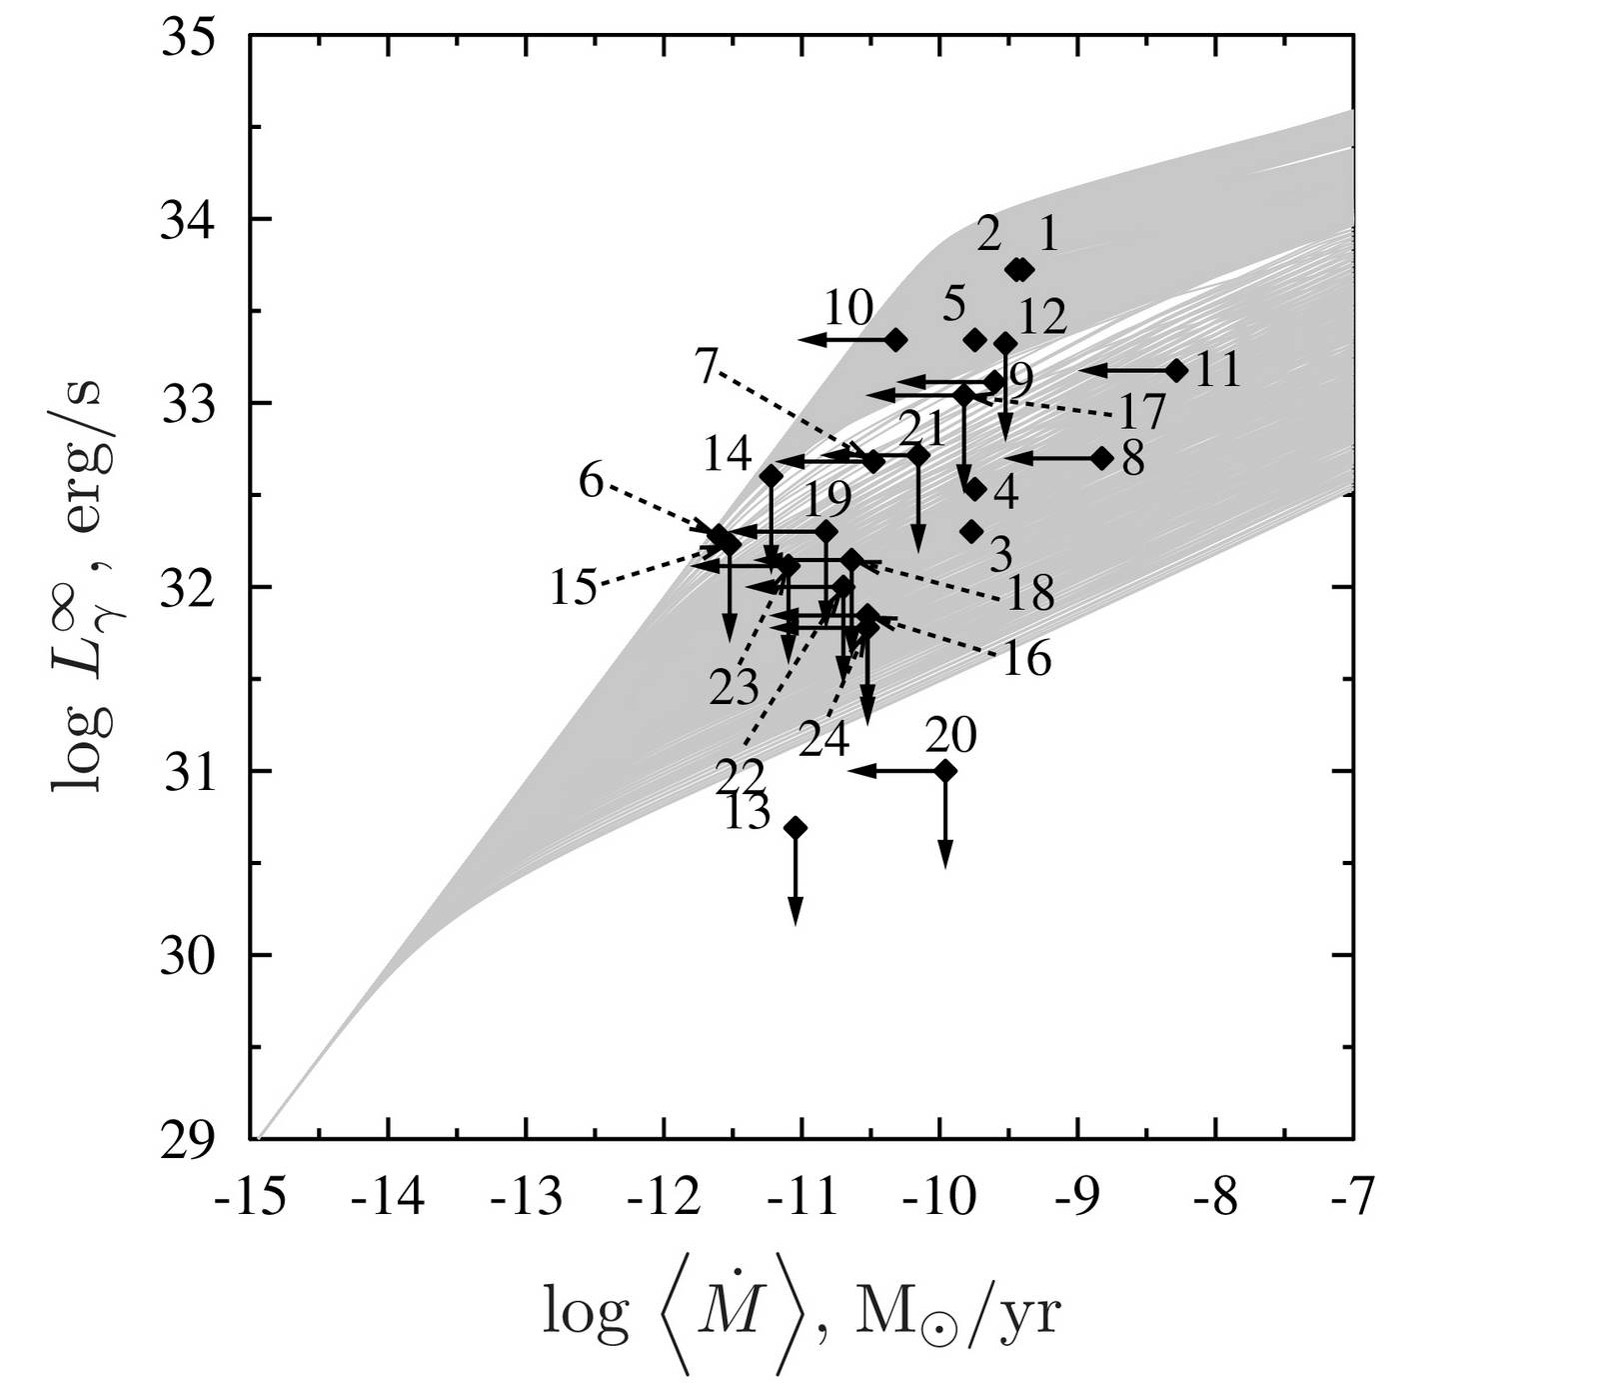
We start with the case of (Figs. 17 and 18). This case is qualitatively similar to the case of open direct Urca process (Section 4.1). Without broadening the threshold of the enhanced neutrino emission we would have two distinct populations of rather warm () and cold () neutron stars separated by a wide “gap” (in disagreement with the observations). However, the gap would be narrower than in Section 4.1 and colder stars would be warmer. Averaging over the distribution of masses of light elements in the heat blanketing envelope somewhat broadens both populations but the effect is again rather insignificant. If we introduce some broadening of the threshold for the enhanced emission, the two populations of stars will merge into one population. However, it is most important that now the transiently accreting massive neutron stars would be warmer and we would never be able to explain the existence of the ultracold neutron star in SAX 1808.4–3658 (see Fig. 18). This star can be explained only if the direct Urca process operates in a massive neutron star. Considering only the isolated cooling neutron stars (and disregarding the transiently accreting ones) we would be able to explain all the sources by setting appropriate value for .
Finally, let us assume a weakly enhanced neutrino emission with (Figs. 19 and 20). If we take the heat blanketing envelopes made of iron and do not broaden the threshold of the enhanced neutrino emission, we would again obtain two distinct populations of rather warm () and less warm () neutron stars separated by a “gap.” If, however, we introduce the averaging over masses of light elements in the heat blanketing envelopes, the two populations will merge into a single one (almost no broadening of the threshold for the enhanced neutrino emission is required!). Then we would be able to explain the data on isolated cooling neutron stars. However, we would be unable to interpret the observations of XRTs, especially the coldest source SAX 1808.4–3658 (see Figs. 19 and 20).
Therefore, our models of neutron stars whose neutrino cooling is less enhanced than the direct Urca process can (in principle) explain the data on isolated neutron stars but cannot explain the data on quasi-stationary neutron stars in XRTs.
5 Conclusions
We have proposed a statistical theory of thermal evolution of cooling isolated middle-aged neutron stars and old transiently accreting quasi-stationary neutron stars in XRTs. The theory is based on the standard theory of neutron star cooling and heating added by important elements of statistical theory such as mass distributions of isolated and accreting neutron stars and mass distributions of light elements in heat blanketing envelopes of these stars. Instead of traditional cooling and heating curves we introduce the probability to find cooling and heating neutron stars in different parts of and diagrams, respectively. These probabilities have been compared with observations of neutron stars of both types.
We have considered the simplest version of the statistical theory. We have taken one EOS of nucleon matter in the neutron star core () where the powerful direct Urca process is switched on at g cm-3 (). We have introduced phenomenologically the broadening of the direct Urca threshold, distribution functions over neutron star masses (different for isolated and transiently accreting neutron stars) and calculated the required probabilities. We have varied the broadening of the direct Urca threshold [the parameter in equation (4)], and typical mass ranges of isolated and accreting neutron stars. In this way we have obtained a reasonable agreement with observations of isolated and accreted neutron stars for , , , , and .
This explanation of all the data essentially requires (i) the presence of the direct Urca process in the inner cores of massive neutron stars (to interpret the observations of SAX 1808.4–3658); (ii) quite definite broadening of the direct Urca threshold () to merge the populations of warm () and colder () stars of each type into one (observable) population; and (iii) higher typical masses of accreting stars (to explain the very cold accreting source SAX 1808.4–3658 and the absence of very cold middle-aged isolated neutron stars). In this scenario the averaging over the masses of light elements in the heat blanketing envelopes plays relatively minor role but is helpful to explain the existence of warmer isolated and accreting sources. Nevertheless, these sources can be explained by assuming the presence of strong proton superfluidity in stars with . This superfluidity suppresses the modified Urca process, which is the major process of neutrino emission in low-mass stars. Such stars will become slower neutrino coolers, and hence warmer sources (e.g., Yakovlev & Pethick 2004, and references therein). The required broading of the direct Urca threshold can also be produced by weakening of proton superfluidity in the massive stars (Section 4.1). Therefore, the obtained explanation, in physical terms, can be reached by assuming the presence of proton superfluidity in neutron star cores. This superfluidity should be strong in low-mass stars but weaken in high-mass ones whose neutrino emission is greatly enhanced by the direct Urca process.
The present scenario is different from the minimal cooling model (Gusakov et al., 2004; Page et al., 2004). The latter model assumes that the enhanced neutrino cooling is produced by the neutrino emission due to the triplet-state pairing of neutrons. This enhancement is much weaker than that due to the direct Urca process; it cannot explain the observations of SAX 1808.4–3658.
On the other hand, recent analysis of the observations of the neutron star in the Cassiopeia A (Cas A) supernova remnant by Ho & Heinke (2009) and Heinke & Ho (2010) indicated that this neutron star has carbon atmosphere, is sufficiently warm but shows rather rapid cooling in real time (with the surface temperature drop by a few percent in about 10 years of observations). These results have been explained (Page et al., 2011; Shternin et al., 2011) within the minimum cooling model, by a neutrino outburst within the star due to moderately strong triplet-state pairing of neutrons. However, the presence of real-time cooling has been put into question by Posselt et al. (2013) who attribute it to the Chandra ACIS-S detector degradation in soft channels. A detailed analysis of the Cas A surface temperature decline has been done recently by Elshamouty et al. (2013) by comparing the results from all the Chandra detectors with the main conclusion that the real time cooling is available although somewhat weaker than obtained before. Thus the problem of real time cooling of the Cas A neutron star remains open. If it is available it cannot be explained by the scenario suggested in this paper.
Let us mention other results of this paper which seem original. First, we have shown that if the direct Urca threshold is not broadened, there are two different populations of accreting neutron stars, warmer and colder ones, separated by a large “gap.” Second, we have obtained that if the neutrino emission in massive stars is enhanced only slightly (, Section 4.2), then the averaging over different amounts of light elements in the heat blanketing envelopes merges the populations of warmer and colder (isolated and accreting) stars into one population even without broadening the threshold of the enhanced neutrino emission.
There is no doubt that the statistical theory presented above can be elaborated further. For instance, we have used only one EOS of superdense matter in neutron star cores, while one can try many other ones. However, it is possible to predict that the results will be similar, rescaled with respect to the values of for new EOSs. One can also try different mass distributions of isolated and accreting neutron stars. In addition, one can expect that the distribution of light elements in the heat blanketing envelopes is not entirely arbitrary but is regulated by diffusion processes in the envelopes. Another issue for future studies would be to include the effects of rotation and magnetic fields, and also numerous effects of nucleon superfluidity (see, e.g., Fig. 13).
Note that statistical studies of populations of cooling neutron stars have been performed in several publications (e.g., Popov et al. 2006) but under quite different approaches and with different conclusions.
acknowledgements
The authors are grateful for the partial support by the State Program “Leading Scientific Schools of Russian Federation” (grant NSh 294.2014.2). The work of MB has also been partly supported by the Dynasty Foundation, and the work of DY by Russian Foundation for Basic Research (grants Nos. 14-02-00868-a and 13-02-12017-ofi-M) and by “NewCompStar,” COST Action MP1304. In addition, DY acknowledges sponsorship of the ISSI (Bern, Switzerland) within the program “Probing Deep into the Neutron Star Crust with Transient Neutron-Star Low-Mass X-Ray Binaries.”
References
- Antoniadis et al. (2013) Antoniadis J. et al., 2013, Science, 340, 448
- Becker et al. (2012) Becker W., Prinz T., Winkler P. F., Petre R., 2012, Astrophys. J., 755, 141
- Brown, Bildsten & Rutledge (1998) Brown E. F., Bildsten L., Rutledge R. E., 1998, Astrophys. J. Lett., 504, L95
- Cackett et al. (2005) Cackett E. M. et al., 2005, Astrophys. J., 620, 922
- Cackett et al. (2006a) Cackett E. M. et al., 2006a, MNRAS, 369, 407
- Cackett et al. (2006b) Cackett E. M., Wijnands R., Linares M., Miller J. M., Homan J., Lewin W. H. G., 2006b, MNRAS, 372, 479
- Campana et al. (2005) Campana S., Ferrari N., Stella L., Israel G. L., 2005, Astron. Astrophys., 434, L9
- Campana & Stella (2003) Campana S., Stella L., 2003, Astrophys. J., 597, 474
- Campana et al. (2002) Campana S. et al., 2002, Astrophys. J. Lett., 575, L15
- Chen, Shrader & Livio (1997) Chen W., Shrader C. R., Livio M., 1997, Astrophys. J., 491, 312
- Cornelisse, Wijnands & Homan (2007) Cornelisse R., Wijnands R., Homan J., 2007, MNRAS, 380, 1637
- Demorest et al. (2010) Demorest P. B., Pennucci T., Ransom S. M., Roberts M. S. E., Hessels J. W. T., 2010, Nature, 467, 1081
- Elshamouty et al. (2013) Elshamouty K. G., Heinke C. O., Sivakoff G. R., Ho W. C. G., Shternin P. S., Yakovlev D. G., Patnaude D. J., David L., 2013, Astrophys. J., 777, 22
- Galloway (2006) Galloway D. K., 2006, in AIP Conf. Series, Vol. 840, The Transient Milky Way: A Perspective for MIRAX, D’Amico F., Braga J., Rothschild R. E., eds., pp. 50–54
- Galloway et al. (2002) Galloway D. K., Chakrabarty D., Morgan E. H., Remillard R. A., 2002, Astrophys. J. Lett., 576, L137
- Galloway & Cumming (2006) Galloway D. K., Cumming A., 2006, Astrophys. J., 652, 559
- Galloway et al. (2005) Galloway D. K., Markwardt C. B., Morgan E. H., Chakrabarty D., Strohmayer T. E., 2005, Astrophys. J. Lett., 622, L45
- Gnedin, Yakovlev & Potekhin (2001) Gnedin O. Y., Yakovlev D. G., Potekhin A. Y., 2001, MNRAS, 324, 725
- Gudmundsson, Pethick & Epstein (1983) Gudmundsson E. H., Pethick C. J., Epstein R. I., 1983, Astrophys. J., 272, 286
- Gusakov et al. (2004) Gusakov M. E., Kaminker A. D., Yakovlev D. G., Gnedin O. Y., 2004, Astron. Astrophys., 423, 1063
- Gusakov et al. (2005) Gusakov M. E., Kaminker A. D., Yakovlev D. G., Gnedin O. Y., 2005, MNRAS, 363, 555
- Haensel & Zdunik (1990) Haensel P., Zdunik J. L., 1990, Astron. Astrophys., 227, 431
- Haensel & Zdunik (2003) Haensel P., Zdunik J. L., 2003, Astron. Astrophys., 404, L33
- Haensel & Zdunik (2008) Haensel P., Zdunik J. L., 2008, Astron. Astrophys., 480, 459
- Heinke et al. (2010) Heinke C. O. et al., 2010, Astrophys. J., 714, 894
- Heinke & Ho (2010) Heinke C. O., Ho W. C. G., 2010, Astrophys. J. Lett., 719, L167
- Heinke et al. (2009) Heinke C. O., Jonker P. G., Wijnands R., Deloye C. J., Taam R. E., 2009, Astrophys. J., 691, 1035
- Heinke et al. (2007) Heinke C. O., Jonker P. G., Wijnands R., Taam R. E., 2007, Astrophys. J., 660, 1424
- Heinke et al. (2006) Heinke C. O., Wijnands R., Cohn H. N., Lugger P. M., Grindlay J. E., Pooley D., Lewin W. H. G., 2006, Astrophys. J., 651, 1098
- Heiselberg & Hjorth-Jensen (1999) Heiselberg H., Hjorth-Jensen M., 1999, Astrophys. J. Lett., 525, L45
- Ho & Heinke (2009) Ho W. C. G., Heinke C. O., 2009, Nature, 462, 71
- Ho et al. (2007) Ho W. C. G., Kaplan D. L., Chang P., van Adelsberg M., Potekhin A. Y., 2007, MNRAS, 375, 821
- Jonker et al. (2006) Jonker P. G., Bassa C. G., Nelemans G., Juett A. M., Brown E. F., Chakrabarty D., 2006, MNRAS, 368, 1803
- Jonker, Bassa & Wachter (2007) Jonker P. G., Bassa C. G., Wachter S., 2007, MNRAS, 377, 1295
- Jonker et al. (2005) Jonker P. G., Campana S., Steeghs D., Torres M. A. P., Galloway D. K., Markwardt C. B., Chakrabarty D., Swank J., 2005, MNRAS, 361, 511
- Jonker et al. (2004) Jonker P. G., Galloway D. K., McClintock J. E., Buxton M., Garcia M., Murray S., 2004, MNRAS, 354, 666
- Jonker et al. (2007) Jonker P. G., Steeghs D., Chakrabarty D., Juett A. M., 2007, Astrophys. J. Lett., 665, L147
- Jonker, Wijnands & van der Klis (2004) Jonker P. G., Wijnands R., van der Klis M., 2004, MNRAS, 349, 94
- Juett, Galloway & Chakrabarty (2003) Juett A. M., Galloway D. K., Chakrabarty D., 2003, Astrophys. J., 587, 754
- Kaminker et al. (2014) Kaminker A. D., Kaurov A. A., Potekhin A. Y., Yakovlev D. G., 2014, MNRAS, 442, 3484
- Kargaltsev et al. (2005) Kargaltsev O. Y., Pavlov G. G., Zavlin V. E., Romani R. W., 2005, Astrophys. J., 625, 307
- Karpova et al. (2014) Karpova A., Danilenko A., Shibanov Y., Shternin P., Zyuzin D., 2014, Astrophys. J., 789, 97
- Kirichenko et al. (2014) Kirichenko A., Danilenko A., Shibanov Y., Shternin P., Zharikov S., Zyuzin D., 2014, Astron. Astrophys., 564, A81
- Kiziltan et al. (2013) Kiziltan B., Kottas A., De Yoreo M., Thorsett S. E., 2013, Astrophys. J., 778, 66
- Klochkov et al. (2015) Klochkov D., Suleimanov V., Pühlhofer G., Yakovlev D. G., Santangelo A., Werner K., 2015, Astron. Astrophys., 573, A53
- Krauss et al. (2005) Krauss M. I. et al., 2005, Astrophys. J., 627, 910
- Lattimer et al. (1991) Lattimer J. M., Pethick C. J., Prakash M., Haensel P., 1991, Phys. Rev. Lett., 66, 2701
- Lombardo & Schulze (2001) Lombardo U., Schulze H.-J., 2001, in Lecture Notes in Physics, Berlin Springer Verlag, Vol. 578, Physics of Neutron Star Interiors, Blaschke D., Glendenning N. K., Sedrakian A., eds., p. 30
- Marelli et al. (2013) Marelli M. et al., 2013, Astrophys. J., 765, 36
- Markwardt et al. (2002) Markwardt C. B., Swank J. H., Strohmayer T. E., in ’t Zand J. J. M., Marshall F. E., 2002, Astrophys. J. Lett., 575, L21
- McGowan et al. (2004) McGowan K. E., Zane S., Cropper M., Kennea J. A., Córdova F. A., Ho C., Sasseen T., Vestrand W. T., 2004, Astrophys. J., 600, 343
- Miller et al. (2003) Miller J. M. et al., 2003, Astrophys. J. Lett., 583, L99
- Motch, Zavlin & Haberl (2003) Motch C., Zavlin V. E., Haberl F., 2003, Astron. Astrophys., 408, 323
- Nowak, Heinz & Begelman (2002) Nowak M. A., Heinz S., Begelman M. C., 2002, Astrophys. J,, 573, 778
- Page et al. (2004) Page D., Lattimer J. M., Prakash M., Steiner A. W., 2004, Astrophys. J. Suppl., 155, 623
- Page et al. (2009) Page D., Lattimer J. M., Prakash M., Steiner A. W., 2009, Astrophys. J., 707, 1131
- Page et al. (2011) Page D., Prakash M., Lattimer J. M., Steiner A. W., 2011, Phys. Rev. Lett., 106, 081101
- Pavlov & Zavlin (2003) Pavlov G. G., Zavlin V. E., 2003, in Texas in Tuscany. XXI Symposium on Relativistic Astrophysics, Bandiera R., Maiolino R., Mannucci F., eds., pp. 319–328
- Pavlov et al. (2001) Pavlov G. G., Zavlin V. E., Sanwal D., Burwitz V., Garmire G. P., 2001, Astrophys. J. Lett., 552, L129
- Pietsch et al. (1986) Pietsch W., Steinle H., Gottwald M., Graser U., 1986, Astron. Astrophys., 157, 23
- Popov et al. (2006) Popov S., Grigorian H., Turolla R., Blaschke D., 2006, Astron. Astrophys., 448, 327
- Posselt et al. (2013) Posselt B., Pavlov G. G., Suleimanov V., Kargaltsev O., 2013, Astrophys. J., 779, 186
- Potekhin (2014) Potekhin A. Y., 2014, Phys.-Usp., 57, 735
- Potekhin, Chabrier & Yakovlev (1997) Potekhin A. Y., Chabrier G., Yakovlev D. G., 1997, Astron. Astrophys., 323, 415
- Rutledge et al. (1999) Rutledge R. E., Bildsten L., Brown E. F., Pavlov G. G., Zavlin V. E., 1999, Astrophys. J., 514, 945
- Rutledge et al. (2001a) Rutledge R. E., Bildsten L., Brown E. F., Pavlov G. G., Zavlin V. E., 2001a, Astrophys. J., 559, 1054
- Rutledge et al. (2001b) Rutledge R. E., Bildsten L., Brown E. F., Pavlov G. G., Zavlin V. E., 2001b, Astrophys. J., 551, 921
- Shibanov et al. (2008) Shibanov Y. A., Lundqvist N., Lundqvist P., Sollerman J., Zyuzin D., 2008, Astron. Astrophys., 486, 273
- Shternin et al. (2011) Shternin P. S., Yakovlev D. G., Heinke C. O., Ho W. C. G., Patnaude D. J., 2011, MNRAS, 412, L108
- Slane et al. (2004) Slane P., Helfand D. J., van der Swaluw E., Murray S. S., 2004, Astrophys. J, 616, 403
- Tomsick et al. (2004) Tomsick J. A., Gelino D. M., Halpern J. P., Kaaret P., 2004, Astrophys. J., 610, 933
- Tomsick, Gelino & Kaaret (2005) Tomsick J. A., Gelino D. M., Kaaret P., 2005, Astrophys. J., 635, 1233
- Tomsick, Gelino & Kaaret (2007) Tomsick J. A., Gelino D. M., Kaaret P., 2007, Astrophys. J., 663, 461
- Torres et al. (2008) Torres M. A. P. et al., 2008, Astrophys. J., 672, 1079
- Weisskopf et al. (2004) Weisskopf M. C., O’Dell S. L., Paerels F., Elsner R. F., Becker W., Tennant A. F., Swartz D. A., 2004, Astrophys. J., 601, 1050
- Weisskopf et al. (2011) Weisskopf M. C., Tennant A. F., Yakovlev D. G., Harding A., Zavlin V. E., O’Dell S. L., Elsner R. F., Becker W., 2011, Astrophys. J., 743, 139
- Wenzel (1983) Wenzel W., 1983, Inform. Bull. Variable Stars, 2452, 1
- Wijnands et al. (2005a) Wijnands R., Heinke C. O., Pooley D., Edmonds P. D., Lewin W. H. G., Grindlay J. E., Jonker P. G., Miller J. M., 2005a, Astrophys. J., 618, 883
- Wijnands et al. (2005b) Wijnands R., Homan J., Heinke C. O., Miller J. M., Lewin W. H. G., 2005b, Astrophys. J., 619, 492
- Wijnands & Reynolds (2003) Wijnands R., Reynolds A., 2003, Astron. Telegram, 166, 1
- Yakovlev et al. (2008) Yakovlev D. G., Gnedin O. Y., Kaminker A. D., Potekhin A. Y., 2008, in American Institute of Physics Conference Series, Vol. 983, 40 Years of Pulsars: Millisecond Pulsars, Magnetars and More, Bassa C., Wang Z., Cumming A., Kaspi V. M., eds., pp. 379–387
- Yakovlev & Haensel (2003) Yakovlev D. G., Haensel P., 2003, Astron. Astrophys., 407, 259
- Yakovlev et al. (2001) Yakovlev D. G., Kaminker A. D., Gnedin O. Y., Haensel P., 2001, Phys. Rep., 354, 1
- Yakovlev, Levenfish & Haensel (2003) Yakovlev D. G., Levenfish K. P., Haensel P., 2003, Astron. Astrophys., 407, 265
- Yakovlev & Pethick (2004) Yakovlev D. G., Pethick C. J., 2004, Annu. Rev. Astron. Astrophys, 42, 169
- Zavlin (2007) Zavlin V. E., 2007, Astrophys. J. Lett., 665, L143
- Zavlin (2009) Zavlin V. E., 2009, in Astrophysics and Space Science Library, Vol. 357, Astrophysics and Space Science Library, Becker W., ed., p. 181
- Zavlin & Pavlov (2004) Zavlin V. E., Pavlov G. G., 2004, Mem. Soc. Astron. Ital., 75, 458
- Zavlin, Trümper & Pavlov (1999) Zavlin V. E., Trümper J., Pavlov G. G., 1999, Astrophys. J., 525, 959