Structural Changes in Thermoelectric SnSe at High Pressures
Abstract
The crystal structure of the thermoelectric material tin selenide has been investigated with angle-dispersive synchrotron x-ray powder diffraction under hydrostatic pressure up to 27 GPa. With increasing pressure, a continuous evolution of the crystal structure from the GeS type to the higher-symmetry TlI type was observed, with a critical pressure of 10.5(3) GPa. The orthorhombic high-pressure modification, -SnSe, is closely related to the pseudo-tetragonal high-temperature modification at ambient pressure. The similarity between the changes of the crystal structure at elevated temperatures and at high pressures suggests the possibility that strained thin films of SnSe may provide a route to overcoming the problem of the limited thermal stability of -SnSe at high temperatures.
1 Introduction
The central challenge in finding or engineering thermoelectric materials suitable for thermal energy conversion beyond niche applications remains to combine good electrical properties and a very low thermal conductivity in a single material. Very recently, the compound SnSe has been reported to exhibit exceptionally good thermoelectric properties at high temperatures above 800 K, including a very low thermal conductivity [1]. Nanostructuring of materials has been pursued extensively in recent years as a possible route towards achieving a sufficiently low thermal conductivity [2, 3, 4], but the discovery of extremely low thermal conductivity in bulk SnSe has markedly improved the prospects of obtaining bulk thermoelectrics suitable for general commercial applications. As SnSe consists only of Earth-abundant elements of comparatively low toxicity, it represents also an important advance in avoiding toxic and rare elements like lead and tellurium in thermoelectric materials.
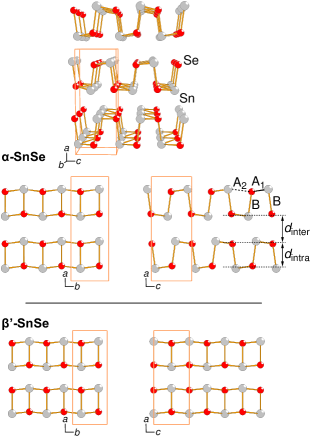
At ambient conditions, SnSe adopts a layered orthorhombic crystal structure (GeS structure type; space group , No. 62) as illustrated in Fig. 1. The structure can be regarded as a heavily-distorted variant of the NaCl structure type, and it comprises NaCl-type double layers that are stacked along the direction. One signature of the distortion are the unequal Se–Sn interatomic distances A1 and A2, which gives rise to “corrugated” layers as seen in projection along the direction, see Fig. 1. Another is that adjacent NaCl-type double layers are displaced by approximately with respect to each other. With increasing temperature, the structure was observed to evolve continuously into a higher-symmetry variant (TlI structure type; space group , No. 63), with a critical temperature of 807 K [5, 6]. It is this high-temperature, higher-symmetry phase of SnSe that has the excellent thermoelectric properties. Unfortunately, SnSe appears to be thermally rather unstable under these conditions due to sublimation [6], which severely limits the use of this material in devices.
Here, we investigate the effect of high hydrostatic pressure on the crystal structure of SnSe. Our study was motivated (i) by recent reports that some thermoelectric materials exhibit dramatic improvements in the thermoelectric power factor under compression [7, 8], (ii) by the fact that earlier studies (as detailed below) have yielded only a rather fragmentary and partially contradictory picture of the behaviour of SnSe under high pressure and (iii) by the scarcity of state-of-the-art experimental crystal structure investigations on group-IV chalcogenides in relation to the abundance of computational studies. Using synchrotron powder x-ray diffraction experiments, we quantify the structural changes in SnSe under pressure and demonstrate that there is a pressure-induced transition to the higher-symmetry GeS structure type, and we comment on the possible implications of the structural changes for the thermoelectric properties of SnSe.
2 Earlier High-Pressure Studies of SnSe
The properties of SnSe under high pressure have been the subject of a number of experimental and computational studies, largely motivated by SnSe and related orthorhombic IV-VI compounds being intermediate between two- and three-dimensional solids in terms of their anisotropic physical properties. Chattopadhyay et al [9] investigated the crystal structure of SnSe under high pressure to 34 GPa by energy-dispersive x-ray diffraction. Judging by the absence of discontinuities in the interplanar distances, they found no evidence for a structural phase transition. However, they noted the limitations of the energy dispersive x-ray diffraction technique, suggesting that a continuous and relatively subtle transition such as the transition known from high-temperature experiments might be difficult to detect with this technique.
In a high-pressure Mössbauer study [10], Peters and McNeil identified the low-pressure range below 3.0 GPa as the range in which the interlayer bonds are changed, transforming SnSe from a predominantly two-dimensional to a more three-dimensional material. Parenteau and Carlone [11] measured the temperature and pressure dependence of the direct and indirect optical gaps of SnSe up to 4.0 GPa. They found its electronic properties to be three-dimensional in nature, already at ambient pressure, as opposed to the two-dimensional nature suggested by the easy cleavage of SnSe crystals, their lattice dynamics [12] and the interpretation of the chemical bonding in this compound [5]. Agarwal et al [13, 14] observed abrupt changes in the electrical resistivity and thermopower near 6 GPa, but their exact origin has remained unclear. Interestingly, the resistivity decreases monotonically with increasing pressure, whereas the thermopower decreases up to 6.3 GPa, followed by large enhancement between 6.5 and 7.6 GPa.
Two recent computational studies also investigated the structural and electronic properties of SnSe under pressure. Alptekin [15] predicted a pressure-induced second-order transition to a phase with space group , isostructural with the high-temperature phase -SnSe. Two possible phase transition pressures of 2 or 7 GPa were identified, depending on the method of calculation. In this study, little evidence of pressure-induced electronic changes was found; in particular, SnSe was reported to remain semiconducting in the phase at 7 GPa. In contrast, Makinistian and Albanesi [16] reported a reduction of the band gap with increasing pressure and a transition to a semimetallic state with indirect band overlap. As the calculations underestimate the zero-pressure band gap by 50% in comparison with experimental results, the calculated metallisation pressure of 5 GPa should be regarded as a lower bound.
3 Experimental Details
Polycrystalline SnSe was synthesised using a standard solid state chemistry reaction. Stoichiometric amounts of 100-mesh Sn powder (99.9% stated purity) and shots of Se (99.999%) were ground together and cold-pressed into a pellet. The pellet was sealed in an evacuated quartz tube and heated at 900 °C for 24 hours (10 °C/min heating ramp), followed by cooling at 3 °C/min to 600 °C, after which the oven was switched off. This heating step was repeated once with an intermediate homogenisation. Phase purity was checked using a Bruker D8 Advance diffractometer with monochromated Cu-Kα1 radiation.
Post-synthesis hot-pressing using a home-built apparatus (500 °C and 80 MPa for 20 minutes) was used to obtain a fully dense SnSe sample. The electrical resistivity and Seebeck coefficient were measured using a Linseis LSR3 instrument and found to be 5 cm and µV K-1 at 300 K. The Seebeck coefficient agrees with recently reported values for spark-plasma-sintered polycrystalline SnSe [17], whereas our resistivity is a factor of 10 larger.
The synthesised material was manually ground to a fine powder and loaded into a Merrill-Bassett-type diamond anvil cell (DAC) for high-pressure generation. Condensed helium was used as the pressure-transmitting medium, and pressures were determined with the ruby fluorescence method using the calibration of Ref. [18]. Monochromatic powder x-ray diffraction patterns were measured in the Debye-Scherrer geometry on beamline ID09a of the European Synchrotron Radiation Facility (ESRF). Monochromatic x-rays of wavelength Å were focused to a spot size of 20 µm at the sample, and the two-dimensional diffraction images were recorded with a mar555 area detector. The DAC was rotated by ° during the exposure to improve the powder averaging. The diffraction images were integrated azimuthally with the Fit2D software [19] to yield conventional intensity vs diffraction diagrams, which were analysed with the Rietveld method using the program GSAS [20, 21].
4 Results and Discussion
4.1 Pressure-Induced Phase Transition
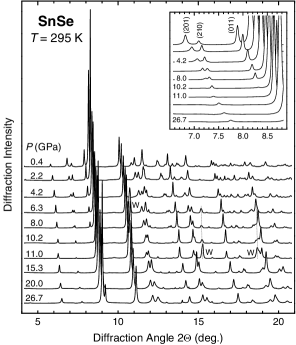
Figure 2 illustrated the evolution of the diffraction pattern of SnSe for increasing pressures up to 27 GPa. No abrupt changes were observed, but there is a gradual disappearance of several reflections as shown in the inset of Fig. 2 for the (011) and (201) reflections. This suggest a transition from the structure with space group to a higher-symmetry variant, and this transformation is completed at 11.0 GPa.
The powder diffraction patterns were analysed with the Rietveld method. Starting at low pressure, the crystal structure was first analysed based on the GeS-type structure model with space group . The refined parameters were the lattice parameters, the and atomic coordinates of Se and Sn, profile parameters of the Stephens peak function [22] and the coefficients of a Chebyshev polynomial for the background. As the diffraction images showed textured powder rings, a correction for preferred orientation of the powder particles, based on spherical harmonics [23], was applied. Even a conservative two-parameter correction for preferred orientation improved the agreement between measured and fitted intensities noticeably. All Rietveld refinements were performed with spherical-harmonics corrections of orders 2, 4, and 6 (2, 5, 9 refinable parameters, respectively). The resulting atomic coordinates from the three fits generally agreed within the estimated uncertainties, and the results reported here are the averages of the three refinements for each diffraction pattern. Figure 3(a) shows the Rietveld fit for -SnSe at 4.2 GPa as an example. A spherical-harmonics correction of order 2 was used in this case, and the weighted residual of the fit without background was .
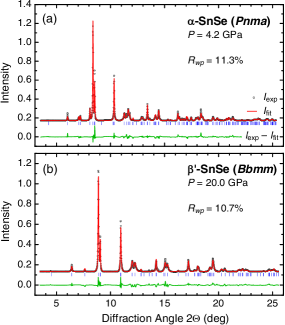
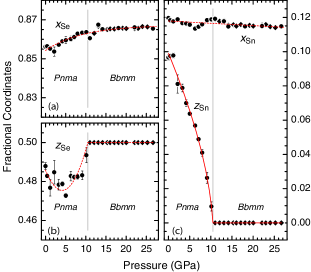
Figure 4 shows the variation of the atomic coordinates with pressure as obtained from the Rietveld refinements. Most notable is the clear evolution of the Sn -coordinate towards zero, a process which is again completed at 11 GPa. Attempts to refine the structures for pressure above 11 GPa based on the structure model led to rather unstable fits, but the results for the Sn -coordinate were consistent with . The results for the pressure dependence of the Se -coordinate are less conclusive because it is close to the high-symmetry value of already at ambient pressure, and the lower scattering power of Se compared to Sn leads to larger uncertainties in the measured parameters for the former. The data in Fig. 4(b) suggest that the Se -coordinate approaches 1/2 at the critical pressure, possibly after passing through a minimum near 5 GPa. In addition, the absence of any traces of the (011) and (201) reflections at pressures above 11 GPa indicates that the -coordinates of both Sn and Se adopt the high-symmetry values of 0 and , respectively. This changes the space group of the crystal structure from (#62) to (#63). The latter is a non-standard setting of space group that keeps the crystal axes in the same orientation as for . This pressure-induced change in symmetry is the same as that observed upon heating at ambient pressure. For reasons explained below along with a discussion of the relation between the temperature- and pressure-induced structural changes, we denote the high-pressure phase as -SnSe.
For the data collected at pressures of 11 GPa and higher, Rietveld refinements of the crystal structure were performed with space group . Figure 3(b) shows the Rietveld fit for -SnSe at 20.0 GPa as an example. As before, a preferred-orientation correction of order 2 was applied, and the weighted residual of the fit without background was .
The atomic coordinates obtained from the -based refinements are shown with diamond-shaped symbols in Fig. 4. Within the experimental uncertainty, the -coordinates of Se and Sn change continuously over the whole pressure range and thus across the transition near 11 GPa. The pressure dependence of the Sn -coordinate below the transition pressure can be described well with a power law,
| (1) |
with , a critical pressure GPa and a critical exponent .
4.2 Anisotropic Compressibility
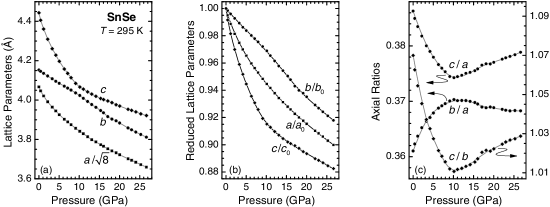
Figures 5(a) and (b) show the lattice parameters as a function of pressure. In Fig. 5(a), the parameter has been scaled by , as the orthorhombic lattice parameters would become in a hypothetical NaCl-type structure [5]. At low pressures, SnSe is most compressible along its -axis, but this direction becomes significantly less compressible at around the critical pressure. In contrast, the -direction exhibits initially a relatively low compressibility, and it becomes more compressible just above the critical pressure. The difference between the and parameter diminishes under pressure up to the critical pressure and then increases again for higher pressures. The axial ratios shown in Fig. 5(c) provide an alternative illustration of these observations. All three axial ratios have extrema near the critical pressure of 10.5 GPa. The lattice of SnSe approaches a tetragonal metric at the critical pressure, but remains orthorhombic at all pressures.
4.3 Symmetrisation of the Crystal Structure
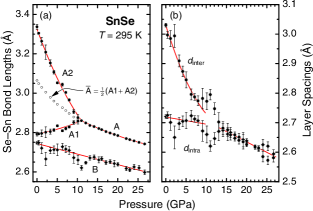
The pressure dependences of three characteristic Se–Sn interatomic distances within the double layers are shown in Figure 6(a). With increasing pressure, the Se–Sn bond A1 and contact A2, which are oriented approximately parallel to the layers (Fig. 1), equalise in length and become equivalent bonds in the phase above 10.5 GPa. Interestingly, the A1 bond lengthens with increasing pressure up to the transition, which can be attributed to the increasing influence of the A2 contact. Also noteworthy is the smooth transition from the average A1/A2 distance, , in the low-pressure phase to bond length A in the high pressure phase. The short Se–Sn bond B, perpendicular to the layers, remains the shortest bond at all pressures, and decreases in length at approximately the same rate as bond A above the transition pressure.
The symmetrisation of the structure manifests itself also in the variation of the spacings of the atomic sheets within and between the double layers, and , as shown in Figure 6(b). These two layer spacings become indistinguishable above 10 GPa. The exact transition pressure cannot be determined from these data because of the relatively large scatter of the data points around 10 GPa, which can be traced to the extracted atomic coordinates (see Fig. 4), and we consider these fluctuations to be an artefact. Overall, the symmetrisation of the crystal structure is predominantly driven by the changes in atomic positions, with only secondary contributions from the variations of the lattice parameters with pressure.
4.4 Relation to the High-Temperature Phase -SnSe
When referring to previous work on SnSe and related systems, one should note that different settings have been used for the orthorhombic space groups, in particular the combination of space groups and for the structures at ambient conditions and high temperatures, respectively. The transformation from to (and also from to ) changes the axes as . We will continue to use the setting of and convert the results of previous studies to this setting where needed.
The pressure-induced structural changes in SnSe are similar to, and yet different from those at high temperature and normal pressure [5, 6]. With increasing temperature at zero pressure, the Se and Sn atoms move continuously to a higher-symmetry () position and the difference between the and lattice parameters decreases just as observed here as a function of pressure. However, above the critical temperature of 807 K, the and parameters become indistinguishable and the lattice pseudo-tetragonal, whereas the high-pressure form described here remains orthorhombic at all pressures. Even though the high-temperature phase, -SnSe, and the high-pressure form are equivalent in terms of their crystallographic symmetry, they differ in terms of their lattice metric and may thus be considered distinct phases. Therefore, we denote the ambient-temperature, high-pressure modification as -SnSe.
4.5 – Equation of State
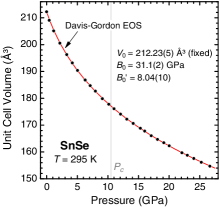
The variation of the unit cell volume of SnSe with pressure is shown in Fig. 7. It does not exhibit any discontinuities or other anomalies. Initial attempts to describe the pressure-volume data with the Birch or Vinet equations of state yielded unsatisfactory agreement between the fitted curves and the measured data, and the thus determined bulk modulus and its derivative at zero pressure depended significantly on the range of pressures that was used in the least-squares fit. The cause of these problems is the rather large change in compressibility at low pressures. Therefore, we employed the less commonly used Davis-Gordon equation of state [24], which was first applied to the pressure–volume relation of mercury. It is a simple quadratic expansion of pressure in terms of the relative change in density, . When expressed in terms of volume ,
| (2) |
where , and and are the bulk modulus and its pressure derivative at zero pressure, respectively. Equation (2) can be rearranged to yield
| (3) |
The Davis-Gordon equation of state describes the pressure–volume data for SnSe better than the Vinet and Birch relations, and a fit with the form gave GPa and with fixed at the measured zero-pressure volume, Å3.
We find SnSe to be significantly more compressible than reported by Chattopadhyay et al [9], who found GPa (and ). This discrepancy persists even if we use, like Chattopadhyay et al, the Birch equation of state to describe our data, which gives GPa (and ). On the other hand, our measured bulk modulus is in fair agreement with Alptekin’s as well as Makinistian and Albanesi’s computational results for -SnSe [15, 16].
4.6 Comparison with Related Systems
The orthorhombic GeS and TlI structure types are well-known as possible intermediate structures in reconstructive transformations between the NaCl and the CsCl structure types in group-IV chalcogenides [25, 26, 27], but the understanding of the systematics of the transitions in this group is still fragmentary. A systematic review of the vast literature on the high-pressure behaviour of group-IV chalcogenides is beyond the scope of this work, but we would like to highlight a few interesting cases. A pressure-induced transition from GeS- to TlI-type phases is a recurring theme in recent computational work on GeS [28], GeSe [29], SnS [30], and SnSe itself [15]. X-ray diffraction studies on GeS [9] and GeSe [9, 31] did not yield evidence of such a transition, but the quality of the experimental data would probably not have permitted detection of such a relatively subtle transition.
In x-ray diffraction experiments on SnS, Ehm et al observed an abrupt phase transition between 16 and 18 GPa [32]. A monoclinic lattice and space group were tentatively assigned to the high-pressure phase, and on this basis a volume jump of was inferred to occur at the transition. Even though the quality of the x-ray diffraction data was insufficient to fully determine the crystal structure of the high-pressure phase, these findings are incompatible with the computational results [30]. It is worth noting that in the computational investigations the crystal symmetry often appears to have been restricted to space group (which includes the higher-symmetry as a special case) so that no conclusions can be drawn with regards to transitions to other structure types beyond GeS and TlI. Examples of such alternative structure types are the orthorhombic structures reported for PbTe [33] and SnTe [34] at pressures of 6–16 GPa and 4–18 GPa, respectively.
5 Conclusions
We have determined the structural evolution of SnSe under hydrostatic pressure up to 27 GPa and observed a continuous transition from the GeS to the TlI structure type with a critical pressure of 10.5(3) GPa. There are no indications of any discontinuities in the structural parameters as a function of pressure. The high-pressure phase -SnSe is closely related to the high-temperature phase at ambient pressure, -SnSe, but whereas the former remains orthorhombic at all pressures, the latter has a tetragonal metric of the crystal lattice. A transition of this kind, with an increase of the crystal symmetry from space group to , has been a recurring outcome of computational studies on group-IV chalcogenides. To the best of our knowledge, the present study provides the first experimental evidence for such a transition.
The similarity between the high-pressure and the high-temperature phases leads us to expect that the stability field of the high-temperature, higher-symmetry modification will extend to lower temperatures as pressure is applied. This suggests that under the application of pressure or compressive strain, SnSe may exhibit very good thermoelectric properties at temperatures lower than the 800 K that are required for bulk SnSe at normal pressure. It appears therefore worthwhile to explore whether using strained films of SnSe may permit to lower the operating temperature of SnSe-based devices while maintaining excellent thermoelectric performance, which would open a route to overcoming the problem of sublimation and hence limited thermal stability of SnSe at high temperatures of 800 K.
Acknowledgments
We thank M. Hanfland (ESRF) and R. Howie (Edinburgh) for their assistance. Facilities were made available by the European Synchrotron Radiation Facility, and part of this work was supported by the Leverhulme Trust (RPG-2012-576).
References
- Zhao et al. [2014] L.-D. Zhao, S.-H. Lo, Y. Zhang, H. Sun, G. Tan, C. Uher, C. Wolverton, V. P. Dravid, and M. G. Kanatzidis, Nature 508, 373 (2014).
- Snyder and Toberer [2008] G. J. Snyder and E. S. Toberer, Nat. Mater. 7, 105 (2008).
- Vaqueiro and Powell [2010] P. Vaqueiro and A. V. Powell, J. Mater. Chem. 20, 9577 (2010).
- Biswas et al. [2012] K. Biswas, J. He, I. D. Blum, C.-I. Wu, T. P. Hogan, D. N. Seidman, V. P. Dravid, and M. G. Kanatzidis, Nature 489, 414 (2012).
- Wiedemeier and Csillag [1979] H. Wiedemeier and F. J. Csillag, Z. Kristallogr. 149, 17 (1979).
- von Schnering and Wiedemeier [1981] H. G. von Schnering and H. Wiedemeier, Z. Kristallogr. 156, 143 (1981).
- Ovsyannikov and Shchennikov [2007] S. V. Ovsyannikov and V. V. Shchennikov, Appl. Phys. Lett. 90, 122103 (2007).
- Ovsyannikov et al. [2008] S. V. Ovsyannikov, V. V. Shchennikov, G. V. Vorontsov, A. Y. Manakov, A. Y. Likhacheva, and V. A. Kulbachinskii, J. Appl. Phys. 104, 053713 (2008).
- Chattopadhyay et al. [1984] T. Chattopadhyay, A. Werner, H. G. von Schnering, and J. Pannetier, Revue Phys. Appl. (Paris) 19, 807 (1984).
- Peters and McNeil [1990] M. J. Peters and L. E. McNeil, Phys. Rev. B 41, 5893 (1990).
- Parenteau and Carlone [1990] M. Parenteau and C. Carlone, Phys. Rev. B 41, 5227 (1990).
- Chandrasekhar et al. [1977] H. R. Chandrasekhar, R. G. Humphreys, U. Zwick, and M. Cardona, Phys. Rev. B 15, 2177 (1977).
- Agarwal et al. [1994] A. Agarwal, S. H. Chaki, S. G. Patel, and D. Lakshminarayana, J. Mater. Sci. Mater. Electron. 5, 287 (1994).
- Agarwal et al. [2005] A. Agarwal, P. H. Trivedi, and D. Lakshminarayana, Cryst. Res. Technol. 40, 789 (2005).
- Alptekin [2011] S. Alptekin, J. Mol. Model. 17, 2989 (2011).
- Makinistian and Albanesi [2011] L. Makinistian and E. A. Albanesi, Comput. Mater. Sci. 50, 2872 (2011).
- Sassi et al. [2014] S. Sassi, C. Candolfi, J.-B. Vaney, V. Ohorodniichuk, P. Masschelein, A. Dauscher, and B. Lenoir, Appl. Phys. Lett. 104, 212105 (2014).
- Mao et al. [1986] H. K. Mao, J. Xu, and P. M. Bell, J. Geophys. Res. 91, 4673 (1986).
- [19] A. Hammersley, computer code fit2d, (ESRF, Grenoble, 2005).
- Larson and von Dreele [1986] A. C. Larson and R. B. von Dreele, GSAS: General Structure Analysis System. Report LAUR 86-748, Los Alamos National Laboratory, NM, USA (1986).
- Toby [2001] B. H. Toby, J. Appl. Cryst. 34, 210 (2001), computer program EXPGUI.
- Stephens [1999] P. W. Stephens, J. Appl. Cryst. 32, 281 (1999).
- Von Dreele [1997] R. B. Von Dreele, J. Appl. Cryst. 30, 517 (1997).
- Davis and Gordon [1967] L. A. Davis and R. B. Gordon, J. Chem. Phys. 46, 2650 (1967).
- Tolédano et al. [2003] P. Tolédano, K. Knorr, L. Ehm, and W. Depmeier, Phys. Rev. B 67, 144106 (2003).
- Onodera et al. [1986] A. Onodera, Y. Fujii, and S. Sugai, Physica B+C 139-140, 240 (1986).
- Do et al. [2010] G.-S. Do, J. Kim, S.-H. Jhi, C.-H. Park, S. G. Louie, and M. L. Cohen, Phys. Rev. B 82, 054121 (2010).
- Durandurdu [2005] M. Durandurdu, Phys. Rev. B 72, 144106 (2005).
- Gashimzade et al. [2014] F. M. Gashimzade, D. A. Guseinova, Z. A. Jahangirli, B. G. Mekhtiev, and G. S. Orudzhev, Phys. Solid State 56, 761 (2014).
- Alptekin and Durandurdu [2010] S. Alptekin and M. Durandurdu, Solid State Commun. 150, 870 (2010).
- Onodera et al. [1997] A. Onodera, I. Sakamoto, Y. Fujii, N. Môri, and S. Sugai, Phys. Rev. B 56, 7935 (1997).
- Ehm et al. [2004] L. Ehm, K. Knorr, P. Dera, A. Krimmel, P. Bouvier, and M. Mezouar, J. Phys.: Condens. Matter 16, 3545 (2004).
- Rousse et al. [2005] G. Rousse, S. Klotz, A. M. Saitta, J. Rodriguez-Carvajal, M. I. McMahon, B. Couzinet, and M. Mezouar, Phys. Rev. B 71, 224116 (2005).
- Zhou et al. [2013] D. Zhou, Q. Li, Y. Ma, Q. Cui, and C. Chen, J. Phys. Chem. C 117, 5352 (2013).