Near-infrared studies of V5558 Sgr: an unusually slow nova with multiple outbursts
Abstract
We present near-infrared (1-2.5 m) photo-spectroscopic results of the unusually slow nova V5558 Sgr (2007). V5558 Sgr showed a slow climb to maximum that lasted for about 60 days and then underwent at least five strong secondary outbursts. We have analyzed the optical light curve to derive large t2 and t3 values of 281 3 and 473 3 days respectively. An alternate approach is adopted to derive a distance estimate of 1.55 0.25 kpc as conventional MMRD relation may not be applicable for a slow nova. In the pre-maxima stage the spectra showed narrow (FWHM 400 - 550 km s-1) and strong emission lines of Paschen and Brackett series with prominent P-Cygni components. In the later phase the spectra show significant changes with the development of strong and broad ( 1000 km s-1) emission lines of HI, HeI, OI, and NI and some uncommon Fe II emission lines. No evidence of dust formation is seen. V5558 Sgr has been shown to be a rare hybrid nova showing a transition from He/N to Fe II type from optical spectra. However the near-infrared data do not show such a transition and we discuss this anomalous behavior. A recombination analysis of the Brackett lines allows us to constrain the electron density and emission measure during the early optically thick phase and to estimate the mass of the ejecta to be (6.0 1.5) 10-4 M⊙, assuming a filling factor of unity, from later observations.
keywords:
infrared: spectra - line : identification - stars : novae, cataclysmic variables - stars : individual (V5558 Sgr) - techniques : spectroscopic, photometric.1 Introduction
Nova V5558 Sgr was discovered by Y. Sakurai on 2007 April 14.777 UT (JD 2454205.277) at magnitude 10.3 (Nakano et al. 2007) during its pre-maximum
stage. Henden Munari (2007) have reported that no visible progenitor was detected in the POSS plates suggesting a value of 13.4 magnitudes as the lower limit of the outburst amplitude. They derived the astrometric position of the nova to be = 18h10m18.258s 0.046s,
= -18∘46′51.95′′ 0.047′′ which is close to the coordinates reported
by Sakurai (Nakano et al. 2007).
After the discovery, the brightness of the nova increased very slowly.
The maximum brightness was attained on July 10.0 UT at = 6.53 (Munari et al., 2007b) which was followed by a flattening of the light curve and then a slow decline during which the nova underwent
four more re-brightenings (Tanaka et al. 2011). Such a slow rise to maximum accompanied by multiple outbursts during the evolution have been rarely observed in other novae (for example, V723
Cas (Evans et al. 2003) and HR Del (Terzan 1970)).
Optical studies of V5558 Sgr have been performed by several observers (Iijima 2007a, 2007b; Naito 2007; Munari
et al. 2007a; Poggiani 2008). The spectra recorded during the pre-maxima phase were dominated by the strong Balmer and He I
lines along with weak features of emission lines of Fe II multiplets, Mg II, N II, Si II, Ca I and
[O I]. All of these emission lines exhibited narrow and sharp profiles with typical full widths at half maxima (FWHM)
of about 480-540 km s-1, as measured from Balmer lines, which is a value range generally associated with Fe II type novae.
Most of the strong emission lines were accompanied by absorption components of P-Cygni profiles, blueshifted by 400-500 km s-1.
Munari et al. (2007b) estimated a reddening of = 0.36 from the Na I D1 and D2 lines.
No significant change in the spectra was noticed during the pre-maximum evolution except the disappearance of He I lines and the emergence of Fe II multiplets in
emission on 2007 May 11 (Munari et al. 2007a).
Significant changes in the spectra were noticed during and after the initial maximum. The spectra, observed during and a short time after the initial
maxima on 2007 July 10, were characterized by a smooth underlying continuum with numerous weak absorptions along with strong emission lines of Balmer series and
FeII multiplets (Iijima 2007b, Munari et al. 2007b). Also, the He I lines which had disappeared on 2007 May 11, reappeared on 2007 July 12.
Also a remarkable change was noticed in the line profile widths. The emission lines which were narrow in the pre-maxima stage, become strong and
broad (FWHM 1150 km s-1, Munari 2007b)
which indicated the presence of fast hot winds.
The nature of the spectra did not change much during the remaining part of the evolution till 2007 Nov 2 (Tanaka et al. 2011);
the spectra were dominated by strong emission features of H, Fe II and He I lines along with weak emission features
of OI, NII, CII. Many of these emission
features were accompanied by sharp P-Cygni profile which disappeared gradually with time.
Further spectroscopic follow up during the declining phase by Poggiani (2010) reported the appearance of
forbidden lines, e.g., [OIII] 4959, 5007, and [Fe VI], [Fe VII], [Ca V] which suggests that V5558 Sgr had entered the nebular phase.
Overall, the spectral behavior of V5558 Sgr before and after the maximum, is very similar to that of V723 Cas (Iijima
2007b; Poggiani, 2008, 2010). Poggiani (2010) estimated the characteristic time t3 (time taken to decline by 3 magnitudes from visual maximum) = 170 2 days
making the nova a slow one according to the definition of speed class (Payne-Gaposchin 1957). Using the value of t3 Poggiani (2010) revised
the estimated value of the distance to be 1.3 - 1.6 kpc and absolute magnitude (MV) at maximum in the range of 6.3 - 5.9 in agreement
with the value of 6 1 observed in case of slow novae V723 Cas and HR Del. Using these values Poggiani (2010) derived the white dwarf mass
in the range of 0.58 - 0.63 M⊙. We have certain reservations on Poggiani’s (2010) method of deriving the distance which is discussed in section 3.2
The first infrared observations of V5558 Sgr were formally reported by Lynch et al. (2007).
The infrared spectrum (0.8 - 2.5 m) observed on 2007 September 12,
showed strong and narrow (FWHM 620 km s-1) emission lines of H I, He I, OI, Ca II, Fe II, and [N I]. All of the H I and
few of the He I lines and Fe II lines showed P-Cygni absorption profiles which suggested significant optical depths in these lines.
Further infrared observations performed by Rudy et al. (2007) on 2007 October 10 and 11 showed a spectrum (0.8 - 5.5 m) dominated
by low excitation broad (FWHM 1600 km s-1) emission lines with strong N I and Fe II lines. The P-Cygni profiles had
disappeared from the H I lines but were weakly present on the He I lines. They measured a reddening of about 0.8 from the O I
lines. Both Infrared observations found no evidence of dust formation.
In this paper we present results of near-infrared (1 - 2.5 m) spectroscopic and photometric observations of V5558 Sgr.
The observations are is described in Section 2 and the results in Section 3.
2 Observations
V5558 Sgr was observed in the near-Infrared (1-2.5 m) region using the 1.2m
telescope at Mount Abu Infrared Observatory operated by Physical Research Laboratory, India. Observations were taken on 7 epochs in the pre-maxima
rising phase and on 1 epoch in the post-maxima phase. The nova could not be followed in the months of mid-June to mid-October due to monsoon season.
The near-infrared spectra presented in this paper were obtained in each of bands at similar dispersions of 9.75 Å/pixel using the Near Infrared Imager/Spectrometer with a 256256 HgCdTe NICMOS3 array. Each time a set
of at least two spectra of the object at two dithered position along the slit were taken. In the same manner, a set of two spectra of a nearby comparison
star (SAO 161564, spectral type B9.2/A0V, = 5.126) at similar airmass as the object were taken at
the same grating position in order to remove the atmospheric absorption effects from the nova spectra.
Each set of two images were subtracted from each other to eliminate the background counts which comprises of emission from sky and dark counts from the detector.
From these subtracted images spectra were extracted using IRAF tasks. The spectra were wavelength calibrated using a combination of OH sky lines and telluric
lines that register with the stellar spectra. Following the standard procedure, Hydrogen Paschen and Brackett absorption lines were removed from the
spectra of the comparison star and the nova spectra were then divided by the spectra of the comparison star. The ratioed spectra were multiplied by a blackbody curve
generated at the effective temperature of the comparison star to get the final spectra. However, caution should be taken while considering any spectral feature
around 1.12 m in the band and between 2 to 2.05 m in the K band, especially, in the early phase spectra when the emission lines are not so strong.
This is because some differences in airmass between the nova and comparison star remained. Hence, the ratioing process, while removing telluric features, leaves some residuals in these wavelength regions where telluric absorption due to atmospheric oxygen and carbon-dioxide respectively are strong. The log of spectroscopic observations are provided in Table 1.
Near-Infrared photometric observations of the nova in the bands were done in photometric sky conditions using the imaging mode
of the NICMOS3 array. Several frames, both of the nova and a selected standard star (SAO 186544, spectral type B0.5Ib/IIC, = 6.02) in each of the
filters, were recorded in 5 dithered positions offset typically by
20 arcsec. Near-infrared magnitudes were then extracted using APPHOT package in IRAF
following the regular procedure for photometric reduction (e.g. Banerjee Ashok, 2002) followed by us. The log of the photometric observations and the derived magnitudes are given in Table 2.
Further observations beyond November could not be carried out as the object had begun to approach solar conjunction.
| Date | Days | Integration time | |||
|---|---|---|---|---|---|
| 2007 | since | (sec) | |||
| (UT) | Outburst | J | H | K | |
| Apr. 26.951 | 12.174 | 90 | 90 | 40 | |
| Apr. 29.836 | 15.059 | 30 | 30 | 75 | |
| May. 01.861 | 17.084 | 60 | 60 | 40 | |
| May. 05.889 | 21.112 | 60 | 60 | 40 | |
| May. 07.832 | 23.055 | 30 | 30 | 90 | |
| Jun. 07.813 | 54.036 | 90 | 75 | 45 | |
| Jun. 10.844 | 57.067 | 75 | 75 | 40 | |
| Oct 20.594 | 188.817 | 60 | 60 | 90 |
| Date | Days | Magnitudes | |||
|---|---|---|---|---|---|
| 2007 | since | ||||
| (UT) | Outburst | J | H | K | |
| Apr. 29.891 | 15.114 | 7.02 0.05 | 6.57 0.09 | 6.09 0.05 | |
| May 01.955 | 17.178 | 6.94 0.06 | 6.71 0.10 | 6.03 0.10 | |
| May 05.963 | 21.186 | 6.77 0.11 | 6.35 0.07 | 5.93 0.13 | |
| May 07.944 | 23.167 | 6.70 0.09 | 6.33 0.05 | 5.89 0.07 | |
| Jun. 07.860 | 54.083 | 6.29 0.12 | 5.80 0.08 | 5.59 0.12 | |
| Jun. 10.798 | 57.021 | 6.25 0.10 | 5.84 0.12 | 5.48 0.09 |
3 Results
3.1 Optical and near-infrared lightcurves
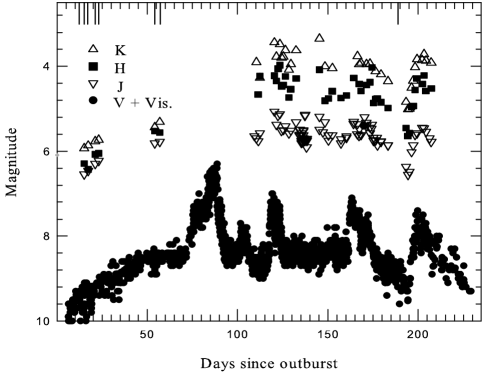
The partial band light curve for the first 250 days, to specially highlight the secondary maxima, is shown in Figure 1 while the entire lightcurve
over an extended period of 6.25 years from maxima is shown in Figure 2. In Figure 1 we also show the near-infrared light curves.
The optical light curve is based on the data collected from American
Association of Variable Star Observers (AAVSO) and from Association Francaise des Observateurs dEtoiles Variables (AFOEV). The near-infrared
magnitudes are from Mt. Abu observations (see Table 2) and SMARTS/CTIO 1.5m telescope facility (Walter et al., 2012). The epochs of Mount Abu
Infrared observations are marked by vertical dashes on the light curve. After the
outburst the light curve rises very slowly. We find from AAVSO data that the nova took about sixty days to reach = 8.5 from the discovery magnitude 10.3.
After staying at = 8.5 , for a few days, the nova underwent its first episode of rebrightening to reach mv = 6.48 on 2007 July 10.56 (JD = 2454292.06) which is in line with the findings of
Munari et al. (2007b). Following this, the brightness of V5558 Sgr started to decrease. During the declining phase, V5558 Sgr showed at
least four more secondary outbursts occurring on July 25 ( = 7.7, t = 101.6 days), August 12 ( = 7.0, t = 119 days), September 25
( = 7.1, t = 163 days) and October 31 ( = 7.4, t = 199.6 days) respectively, where t = days after commencement of the eruption. After the fifth maxima V5558 Sgr declined slowly (see Figure 2). The near-infrared light curves are seen to mimic the behavior of the optical lightcurve and do not warrant any special comments. During the pre-maximum stage a gradual rising is seen in all the three
near-infrared bands similar to optical light curve, the J-H and H-K values were about 0.2 and 0.3 respectively.
We do not have any near-infrared observation during the first maximum. However, the SMART/CTIO observations during the other secondary maxima show that
the J-H and H-K have been about 1.1 and in the range of 0.6 - 1.0, respectively. From near-infrared observations we do not notice any excess in any of the near-infrared light curves which indicates that no dust has been formed in the nova ejecta.
The light curve shows all the characteristics of the J class of novae
based on the classification system of Strope et al. (2010).
J class of nova show ’jittering’ or ’flare-ups’ of substantial amplitude which
could be thought of as outbursts above a smoothed light curve that follows the universal decline law
predicted by Hachisu Kato (2006). Strope et al. (2010) listed 14 novae that belong to J type. While we compare the light curve of V5558 Sgr
with these novae, we find close similarities with V723 Cas and HR Del out of these 14 novae. Both of V723 Cas and HR Del showed a
prolonged pre-maximum halts, V723 Cas took 100 days and HR Del took 180 days respectively to reach the
maximum. Both of these novae showed multiple outbursts, V723 Cas showed 6 outbursts in between 100 and 425 days
and HR Del showed 5 outbursts in between 180 and 380 days.
The cause behind the occurrence of multi-outbursts, as observed in this nova, is not well understood. Previous studies of slow novae have shown that multi-outbursts might take place on white dwarfs of mass 0.6 M⊙ which is close to the critical value required beginning of the thermonuclear runaway event (for example, Friedjung et al. 1992; Kato et al. 2002). However, recent calculations with OPAL opacities, show that thermonuclear runaway may occur even in much less massive white dwarfs (WDs), e.g., 0.2 - 0.5 M WDs (Shen et al. 2009). In a recent study, Kato Hachisu (2009, 2011) pointed out that two different types of evolution of slow novae of a certain range of WD masses, 0.5 - 0.7 M may take place. One is the evolution with optically thick winds and the other is without optically thick winds. The wind-type novae show a sharp peak in the optical light curve and the light curve decays quickly. On the other hand novae without an optically thick wind evolve very slowly and stay at an extended low-temperature stage for a long time, which makes a long-lasting flat optical peak. They suggested that transition from the state of non-optically thick winds to a state of optically thick winds may take place. Such a transition may be accompanied by violent activities like oscillatory behaviors in the light curves of few slow novae which are considered as some relaxation processes associated with the transition. This kind of transition in low-mass WDs ( 0.6 M) in close binary system, may be triggered by the companion star through the effects of (1) spin-up by the companion motion, (2) gravity of the companion star, and (3) drag luminosity due to frictional energy deposition. Incorporating these effects, the authors (Kato & Hachisu 2011) generated two trial models adopting a parameter set of the mass of white dwarf and companion, chemical composition of the envelope and the orbit. The trial light curves successfully reproduced the flat phase of static evolution followed by a smooth decline due to wind mass loss. From this study the WD mass was estimated to be about 0.6 M for all three novae, V723 Cas, HR Del, and V5558 Sgr.
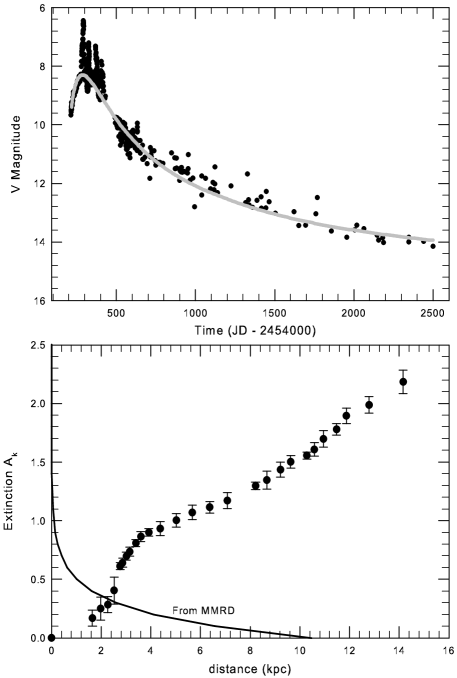
3.2 Distance to the nova
If the data points of the 5 major rebrightenings or secondary maxima are excluded, then it is found that the entire light curve can be fit by one uniform curve that initially rises and then declines. This uniform curve, on which the secondary maxima sit, is shown by the gray line which is obtained by a least-squares minimized polynomial fit. From this smooth curve, we estimate that maximum to be reached on 5 July 2007 at V = 8.3; t2 and t3, the times to decline by 2 and 3 magnitudes from visual maximum, to be 281 3 and 473 3 days respectively. V5558 is therefore an unusually slow nova; possibly one of the slowest ever known (from the selection of well-observed novae by Warner(1995), only DO Aql has larger t2 and t3 values of 430 and 900d respectively). The validity of using maximum magnitude - rate of decline (MMRD) relations for such extremely slow novae is debatable because most MMRD relations are obtained as outcomes of fits of Mv to t2 or t3 values in which the latter have much smaller values. For example, considering two well known relations, in the sample used by della Valle Livio (1995) the largest value of t2 is 117d and in the Downes and Duerbeck (2000) MMRD sample there is only one nova with t2 greater than 100 days (viz. HR Del with t2 = 172d). In general not many very slow novae are known; Capaccioli et al. (1990) cite the case of one nova in the LMC with t2 = 117d while Darnley et al (2006) give instances of four novae with t2 exceeding 100d viz. 817.2, 198, 100.3 and 331d respectively.
We thus estimate Mv and the distance to the nova using a different approach. The variation of the extinction with distance towards the nova is shown, for a ten arc minute field around the object, in the bottom panel of Figure 2 based on modeling of the galactic extinction by Marshall et al. (2006). Two values of the excess have been estimated for V5558 Sgr using independent approaches. From the interstellar NaI D1 and D2 lines, Munari et al (2007a) obtain = 0.36 while Rudy et al (2007) obtain 0.8 based on the relative strengths of the O I 8446 and 12187Å lines. Both methods are known to yield reliable estimates of the reddening. Using both these values of , and the relations Av = 3.1 and Av = 11Ak, the distance to the nova from Figure 2 (bottom panel) is then constrained to lie in the range 1.3 and 1.8 kpc (i.e = 1.55 0.25 kpc).
3.3 Line identification and general characteristics of the spectra,
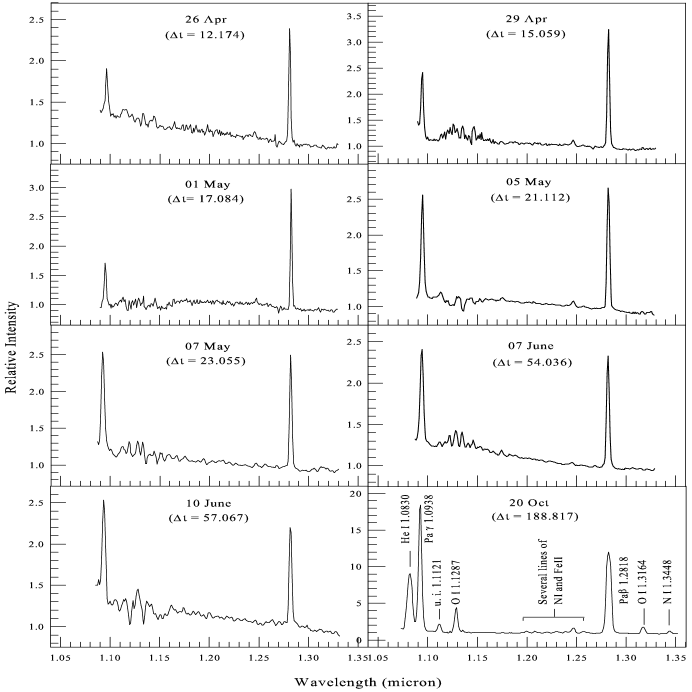
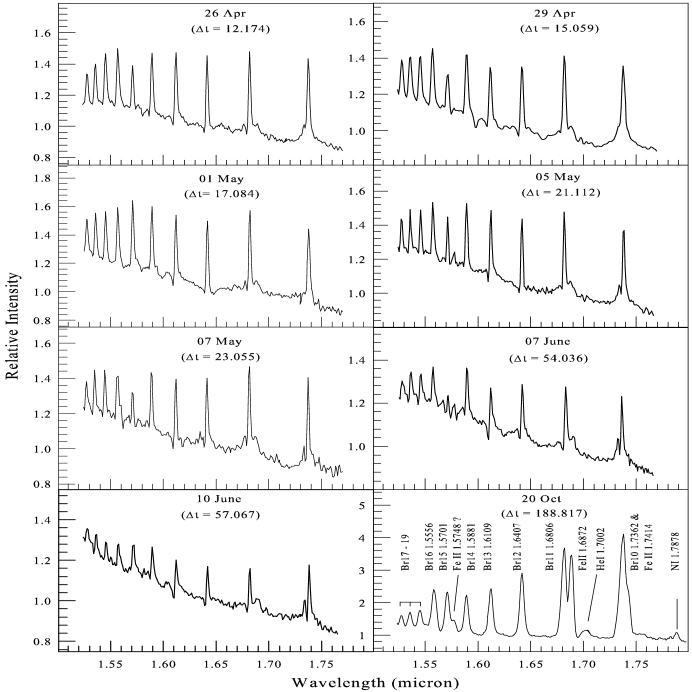
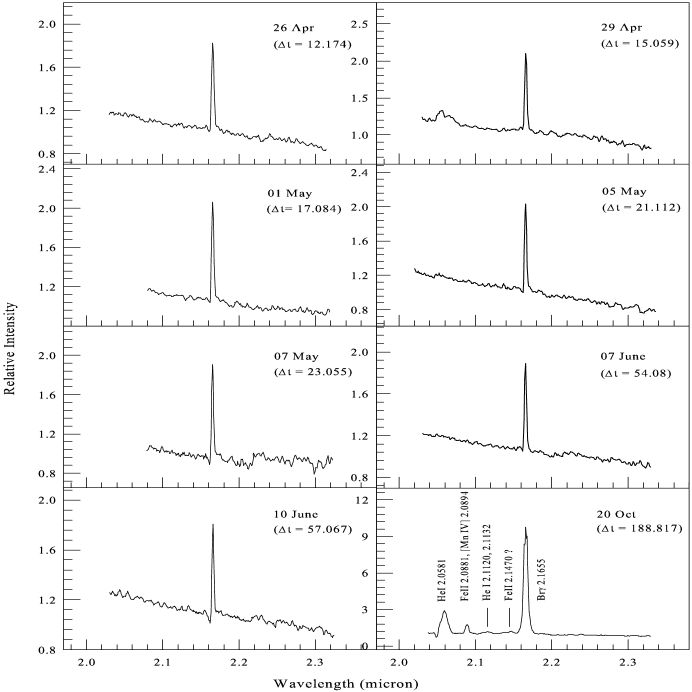
The near-infrared spectra of V5558 Sgr are presented in Figures 3, 4 and 5, respectively. The lines are marked on the figures and a list
of the identified lines are given in Table 3. The epochs of our observations are indicated by bars on the abscissa on top in Figure 1. The presented near-infrared data covers the premaxima evolution till Jun 10, our last data is on Oct 20, 11 days before the fifth maximum which was reached on 31 October. None of our spectra unfortunately coincide with the rebrightenings to monitor spectral changes that took place at these secondary maxima.
In the initial stage, during 2007 April 26 - June 10, the spectra show strong emission lines of HI; these include Pa and
Pa in the J band, Br10 to 19 in the H band and Br in K band. Except the
Paschen and Brackett series lines, the only other discernible feature is the NI 1.2461, 1.2469 m line which becomes much stronger in the later phase on 2007 Oct 20. In the band spectra OI lines at 1.1287
and 1.3164 m which are generally seen in classically novae spectra, are weak or not present.
But it must be noted that the OI 1.1287 micron line lies in a region of poor atmospheric transmission and so it may be weakly present but not clearly discernible. An important feature
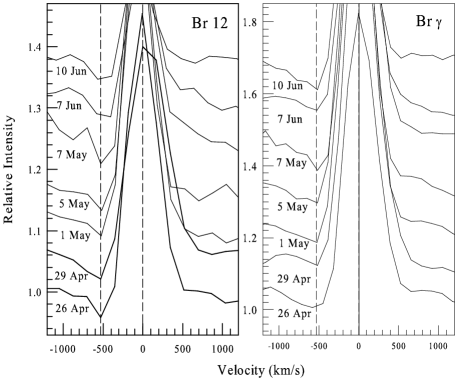
to be noted is all the emission lines are very narrow. In order to quantify the changes in the linewidths, the evolution
of Pa and Brackett lines which are prominent but not blended with any other line, was investigated. The full width at half maximum (FWHM) of the Pa and Br profiles are estimated to be 533 km s-1 and 387 km s-1 respectively. Correcting these for instrumental broadening, our band has poorer resolution than the , gives values of 240 - 260 km s-1 for both lines indicating a very slow velocity for the ejecta.
During the pre-maxima phase, there were no significant changes seen in the width of the emission lines implying the absence of any significant
change in the expansion velocity of the ejected envelope.
During the course of pre-maximum evolution we also note that all the emission lines
show sharp P-Cygni absorption features on the blue wings.
The values of these absorption components for the Br 12 and Brackett lines (Figure 6) are measured approximately at 530 km s-1 from the
emission peak.
Significant changes in the spectra are observed on 2007 Oct 20, a few days before the fifth brightening.
The nova had entered the nebular stage at this time (Poggiani 2010; Tanaka et al. 2011).
The spectra show strong emission lines of Paschen and Brackett series, HeI, NI, OI and Fe II.
Among the He I lines, those at 1.0830, 1.7002 and 2.0581 m are
prominent.
The Ly fluoresced OI line 1.1287 m and
continuum fluoresced OI line 1.3164 m, which were absent in the pre-maximum phase, are present as normally seen in the spectra
of classical novae. The large observed ratio ( 2.7) of the OI
1.1287/1.3164 m lines indicates that Ly fluorescence is the dominant
process contributing to the strength of the 1.1287 m line.
In band, a magnified view of the region between 1.19 and 1.26 m shows a complex blend of several weak but well resolved emission lines.
NI is clearly detected as a broad feature centered around
1.246 m (the NI 1.2461 and 1.2470 m lines) on 2007 Oct 20.
Other features at 1.998, 1.2086, 1.2211, 1.2305, 1.2581 m,
in this region are also detected which we attribute to NI lines. Few of these features are possibly blended with adjacent weak FeII lines (see Table 3 for details).
In addition, two strong features at 1.3448 in band and 1.7878 m in band are detected which are assigned to NI.
In addition to the HI, HeI, OI and NI lines, we see prominent emission features of FeII in each of the bands also. These are at 1.1126 m which is one of the so-called ’1 micron Fe II lines’ (Rudy et al. (2000)) in band, 1.6872 and 1.7414 m in band. All of these Fe II lines are rarely observed in the spectra of novae, for example, in V2615 Oph (Das et al. 2009), RS Oph (Banerjee et al. 2009, V574 Pup (Naik et al. 2010) and V5588 Sgr (Munari et al 2014; in preparation). Apart from these, there are two more novae, namely V2540 Oph (Rudy et al. 2002) and C I Aql (Lynch et al. 2004), where these lines appear to be detected. The excitation mechanism for these lines is believed to be Lyman and Lyman continuum fluorescence coupled with collisional excitation (Banerjee et al. 2009 and references therein). Further, strong emissions of these Fe II lines suggest high density conditions (1010 - 1012 cm-3) inside the ejecta which is supported by recombination analysis (section 3.6) also. As the detections of these Fe II lines in individual objects increase, it becomes amply evident that these band lines could be present in the spectra of other novae too, but have evaded detection because of blending - especially when their widths are large - with the Br 11 (1.6806 m) line. In FeII class of novae additional blending will take place with the strong CI line at 1.6890 m and also CI 1.7449 m . An instance where these FeII lines are very clearly resolved is in RS Ophiuchi (Banerjee et al. 2009), especially during the later stages of its outburst when all line widths in RS Oph narrowed due to deceleration of the ejecta.
We also detect weak emission features at 2.1140 and 2.1470 m. The 2.1140 m feature which was observed in V723 Cas also, is quite certainly a blend of HeI 2.1120, 2.1132 lines. The line at 2.1441 m is probably due to Fe II. Two possible
identifications may be considered for the emission feature at 2.090 m in the band. First, it could be FeII
2.0888 m, a line also seen in the nova V2615 Oph (Das et al. 2009)for which an excitation mechanism by Lyman
fluorescence was proposed. Alternatively, this feature could
be the [Mn XIV] 2.0894 m coronal line which has been seen in a few
instances in novae spectra during the coronal
phase viz., in nova V1974 Cyg (Wagner Depoy, 1996) and in RS Oph
(Banerjee et al. 2009). However a lack of detection of optical coronal lines
at this time (Poggiani 2010) or of any other coronal lines in our spectra is not supportive of a [Mn XIV] assignment. The
present 2.0888 m FeII line should not be confused with an
unidentified line at 2.0996 m that has often been detected in novae and
which still remains unidentified (Rudy et al. 2002)
The emission lines observed on 2007 October 20 were significantly broader in comparison to the pre-maximum stage. We measured
FWHM as 1287 km s-1 from Pa , and 886 km s-1 from Br lines (instrumental deconvolved widths of 1201 and 880 km s-1 respectively . While this result matches with the
findings of Munari et al. (2007b)it is puzzling why two lines from the same species should have significantly
differing velocities It is possible that they arise from different regions within the ejecta; this is known to happen in the ionized plasma discs of Be stars. No strong absorption feature associated with the emission lines is noticed.
It is also noted that no lines from low ionization species such
as Na I or MgI are seen in the spectra. These low ionization lines, which are indicative of low temperature conditions, have been
suggested as potential diagnostic features to predict dust formation
in the nova ejecta (Das et al. 2008). The absence of these lines in
V5558 Sgr is consistent with the lack of dust formation in this nova (Lynch et al. (2007), Rudy et al. (2007)).
| Wavelength | Species | Other contri- | Line fluxes | (in 10 -15 | W cm-2 ) | |
|---|---|---|---|---|---|---|
| (m) | buting lines | Apr 29 | May 05 | Jun 10 | Oct 20 | |
| 1.0830 | He i | … | … | … | 973.0 27.0 | |
| 1.0938 | Pa | 32.7 8.0 | 50.7 3.0 | 72.3 5.0 | 1240.0 30.0 | |
| 1.1121 | u.i. a / Fe ii? | … | … | … | 80.5 5.0 | |
| 1.1287 | O i | … | … | … | 221.0 20.0 | |
| 1.1998 | N i | … | … | … | 21.4 1.4 | |
| 1.2087 | N i | … | … | … | 18.5 0.5 | |
| 1.2211 | N i | … | … | … | 10.0 1.0 | |
| 1.2305 | N i | … | … | … | 16.0 0.5 | |
| 1.2393 | u.i. a /Fe ii? | … | … | … | 7.0 0.5 | |
| 1.2461,70 | N i | 3.2 0.7 | 3.7 0.5 | 0.8 0.2 | 45.0 4.0 | |
| 1.2581 | N i | … | … | … | 17.0 0.5 | |
| 1.2818 | Pa | 67.8 5.0 | 57.8 3.5 | 66.7 4.0 | 985.0 17.0 | |
| 1.3164 | O i | … | … | … | 80.5 2.0 | |
| 1.3448 | N i | … | … | … | 32.0 0.5 | |
| 1.5260 | Br 19 | 2.5 0.3 | 2.0 0.4 | 1.4 0.3 | 13.4 2.0 | |
| 1.5342 | Br 18 | 3.1 0.5 | 2.3 0.3 | 1.9 0.4 | 20.9 2.0 | |
| 1.5439 | Br 17 | 3.1 0.4 | 2.4 0.5 | 1.7 0.4 | 25.2 3.0 | |
| 1.5556 | Br 16 | 4.1 0.5 | 3.5 0.3 | 2.8 0.3 | 78.7 4.0 | |
| 1.5701 | Br 15 | Fe ii 1.5748? | 2.3 0.3 | 2.3 0.4 | 1.9 0.5 | 84.1 4.0 |
| 1.5881 | Br 14 | 4.4 0.4 | 3.2 0.3 | 3.0 0.4 | 70.0 3.0 | |
| 1.6109 | Br 13 | 4.2 0.3 | 3.6 0.4 | 3.1 0.3 | 91.0 3.0 | |
| 1.6407 | Br 12 | 4.2 0.3 | 3.7 0.4 | 2.8 0.4 | 120.0 5.0 | |
| 1.6806 | Br 11 | Fe ii 1.6872 | 4.9 0.3 | 5.4 0.6 | 4.2 0.5 | 166.6 5.2 |
| 1.6872 | Fe ii | 0.4 0.1 | 0.5 0.1 | 0.8 0.3 | 142.0 5.5 | |
| 1.7002 | He i | … | … | … | 28.8 2.0 | |
| 1.7362 | Br 10 | Fe ii 1.7414 | 6.4 0.3 | 6.1 0.5 | 5.5 0.4 | 205.1 4.8 |
| 1.7878 | N i | … | … | … | 16.7 2.5 | |
| 2.0581 | He i | … | … | … | 420.0 6.0 | |
| 2.0888 | Fe ii | [MnXIV] 2.089? | … | … | … | 26.5 0.2 |
| 2.1120,32 | He ii | … | … | … | 14.0 0.2 | |
| 2.1470 | Fe ii | … | … | … | 7.6 1.0 | |
| 2.1655 | Br | 6.8 0.3 | 7.6 0.4 | 7.2 0.4 | 410.0 6.0 |
-
a
u.i. = unidentified
3.4 Spectral classification
Williams (1992) introduced two principal classes for novae, the ”Fe II” and ”He/N” classes, based on the strength of of non-hydrogen emission lines in the optical spectra in the early stage.
In addition, a small fraction of novae display characteristics of both classes and these are referred to as ”hybrid” or ”Fe IIb” novae. These novae have strong Fe II lines soon after the outburst which are broader than those seen in typical ”Fe II” novae and subsequently display ”He/N” spectrum. An example of ”hybrid” nova is V574 Pup (Naik et al. 2010; also see Williams 1992). The optical classification scheme has been extended into near-Infrared spectral region (1.08 to 2.35 m) by Banerjee Ashok (2012). In the near-infrared, the principal differentiating feature between the two classes is the strong presence of carbon lines in ”Fe II” novae and their absence in He/N novae. The strongest of these C lines appear in the J band at 1.166 and 1.175 m and in the H band at 1.6890 m and several lines between 1.72 to 1.79 m. On the other hand, He/N novae show prominent He emission right from the beginning of the outburst. The principal He lines are generally seen at 1.0830, 1.7002, 2.0581 and the 2.1120,2.1132 m. Few near-infrared lines of nitrogen are detected in both Fe II or He/N spectra (for e.g the 1.2461, 1.2469 m lines) but they are invariably stronger in He/N novae as observed in optical spectra also (Williams 1992).
V5558 Sgr comes closest to being classified as a hybrid nova but with an anomalous component. The hybrid tag is justified because it showed a transition from one class to another but the anomaly arises because the transition was in the reverse direction viz from He/N to FeII instead of the other way around. Only one other hybrid nova T Pyx has shown such a similar reverse transition, both in the optical and near-infrared (see Joshi et al. 2014 for the near-infrared behavior and references therein for the optical results). Let us review the optical and near-infrared behavior of V5558 Sgr and compare them using the present results and those from Tanaka et al (2011) because they share common dates (or very nearby) of observation between the two.
In the optical, on April 16 it appeared as a He/N type nova but by 2007 April 25 Fe II lines and a Fe II class spectrum appeared showing that it had evolved from the He/N type to the Fe II type. T Pyx made a similar transition within a week or less (Joshi et al. 2014). In the near-infrared, there is no spectrum on 16 April to compare with the optical. But for the Tanaka et al (2011) spectrum of 25 April in the optical, the near-infrared spectra of 26 April is available and this is certainly not of the Fe II type. No prominent CI lines are present as was clearly seen in T Pyx. The near-infrared spectra at this stage more closely resemble the He/N class (there is a caveat attached to this sentence which we qualify later). All subsequent optical spectra between 25 April to 10 June are of typical of the Fe II class but surprisingly all the near-infrared spectra during this same time are more close to the He/N type. This is a major difference in the optical and infrared behavior and a significant finding from this work. This adds complexity to any unification scheme (Williams 2012; Shore 2013) that tries to explain Fe II, He/N and hybrid novae simultaneously.
In the paradigm proposed by Williams (2012), the the He/N spectra have their origin in the material lost from the white dwarf surface during the thermonuclear runaway. That is why the He lines, responsible jointly with N lines for the creation of the He/N tag, are only seen immediately after the outburst before the He-rich nova ejecta material intermingles with a large circumbinary envelope of gas whose origin is the secondary star. The dominance of the He lines is thus decreased. The Fe II spectra point to their formation in this large circumbinary envelope of gas which is proposed to be created by the impact of the nova ejecta with the secondary star. Depending on the proximity of the secondary star, the WD ejecta mass, and the radiation field impinging on the secondary star, the secondary star could be stimulated to eject mass. Hybrid objects are explained by changing parameters in the two emitting regions (one comprising of the WD ejecta material and the other of the circumbinary envelope) during the post outburst decline. How the contrasting IR behavior (vis-a-vis the optical behavior) in V5558 Sgr could be reconciled within this scheme will be interesting to see. We do not have a easy or straightforward answer to explain the observed behavior but are working on a general model that tries to reproduce both the Fe II and He/N type spectra. In such a model, we feel there is a need for including an additional parameter which considers the changing excitation and ionization conditions in the ejecta resulting from changes in the central WD’s temperature.
If we do not take help of the optical spectra and base a classification solely on just the near-infrared spectra during and around maximum (i.e. spectra between April to June), the caveats associated with a He/N classification throughout this period are as follows. First the He lines, the important ones being expected at 1.0830, 1.7002 and 2.0581, are very weak or missing. However NI is present in the form of NI 1.2461, 1.2469 m right from the earliest stage at a strength roughly consistent with that expected in the He/N class. But there is another troubling anomaly. The observed width of the lines are very narrow whereas He/N novae invariably have line widths of several thousands of km/s. Thus, on the whole, the spectra of V5558 Sgr emphasizes both the complexity and the diversity of novae spectra.
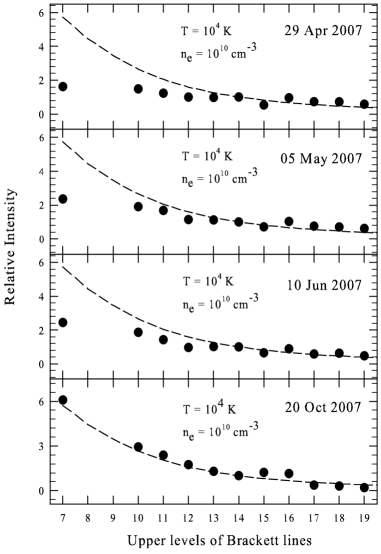
3.5 Recombination analysis
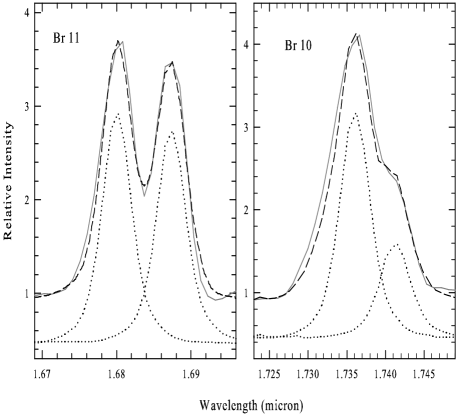
A recombination case B analysis of the HI line strengths was performed for the spectra of all days. Representative results for four days viz. 2007 April 29, May 05, Jun 10 and Oct 20 are presented in Figure 7 which represents the observed strength of the Brackett lines with respect to Br14 normalized to unity. Debelending of the H lines with contaminating lines (for e.g. Br 10 and Br 11 with FeII lines) was done either manually (see Figure 8 as an example) or using IRAF tasks. The observed H line strengths, presented in Table 3, were then compared with that expected by using case B emissivities from Storey Hummer (1995). From recombination theory it is qualitatively expected, under optically thin conditions, that when strengths of lines of the same series are compared, a lower line of the series should be stronger than a higher line. For example, it is expected that Br (corresponding to a transition between levels 7–4) is expected to be significantly stronger than any higher line of the series like Br10 or Br11 (transitions between 10 – 4 and 11 – 4 respectively). But the reverse is actually being observed here on all epochs except for 2007 20 October. This clearly indicates that at these epochs the Br line is optically thick and possibly so are the other Br lines also. The comparison has been made here with a representative Case B model at T = 10000K and density = 1010 cm-3 but our conclusions will remain equally valid for case B values over an extended parameter space of electron density ne varying between 105 and 1013 cm-3 and temperature varying between 5000 and 20000 K. This may be seen for e.g. in a similar detailed graphical illustration done for the novae RS Oph (Figure 6, Banerjee et al. 2009) and T Pyx (Figure 9, Joshi et al. 2014).
Because the Br lines appear optically thick, their actual strengths are unknown and hence it is not possible to estimate the mass of the nova by comparing observed and predicted case B line luminosities. However, the emission measure can be constrained where is the linear size of the emitting region. The values of the opacity for different Hi lines for transitions between levels at different temperatures and densities are known (tabulated in Hummer Storey 1987; Storey Hummer 1995). The optical depth at line-center can be calculated using = , where is the path length in cm. From Figure 8, among the Brackett lines, it can be clearly seen the Br line is definitely optically thick. Thus we use the Br line and assume with considerable certainty that its optical depth is greater than unity i.e. (Br) 1.
From Storey Hummer (1995) we note that the value of the opacity factor does not vary too much with density or temperature for the near-infared Hi lines including Br ( the quantitative change is mentioned a sentence later). Since in the early outburst stages, the electron density in the nova ejecta is expected to be high (values as high as = 1014 cm-3 are even invoked) we make a conservative estimate that is in the range 109 to 1013 cm-3. Using the range of values of between 1.3 10-34 to 7.46 10-34 corresponding to values varying between 109 to 1013 cm-3 for a representative temperature = 104 K, we get the emission measure to be in the range 1.3 1033 to 7.7 1033 cm-5.
Approximate constraints on the electron density can be obtained if we can take to be the kinematic distance traveled by the ejecta where is the velocity of ejecta and is time after outburst. Using a representative value of = 250 kms-1 as discussed earlier and ranging from 12 to 188 days, and applying the constraint that (Br)= 1; we obtain lower limits for in the range 1.7 109 cm-3 to 1.6 1010 cm-3 (assuming = ). These lower limits are likely to be smaller than the actual values because (Br) can be considerably 1 that has been used above. The density in the ejecta is seen to be fairly high over the duration of our observations. It is worth noting Lynch et al. (2000) show that high densities of 1010 cm-3 or more tend to thermalize the level populations through collisions and thereby bring about deviations from Case B predictions as is observed here.
By 20 October, the ejecta appears to have diluted sufficiently to be optically thin and the line strengths follow a caseB distribution well. We estimate of the mass of the emitting gas at this epoch using the same approach as in some earlier novae by using the following relation (Banerjee et al. 2010, Raj et al. 2013):
| (1) |
where is the distance, the proton mass, the observed flux in a particular line, the corresponding case B emissivity; is the volume of the emitting gas which equals , where , and are the filling factor, velocity and time after outburst, respectively. We assume T = 10000K and ne to be 1010 cm-3 prompted both by the goodness of the fit in the bottom panel of Figure 7 and for the following additional reason. As discussed above, ne was close to 1010 cm-3 during our June observation (57d after outburst) but most likely had an even higher value. If the ejecta subsequently diluted geometrically (ne r-2) thereafter upto 20 October (188d after outburst), the density would drop by a factor of 10 (i.e. square of 57/188). Based on this choice of ne, we estimate the mass of the gas in the ejecta in the range (6.0 1.5) 10-4 M⊙. This is a standard value for novae. However, this mass estimate is restricted in accuracy by our lack of knowledge of the filling factor which is assumed to be 1 here .
3.6 Evolution of the continuum
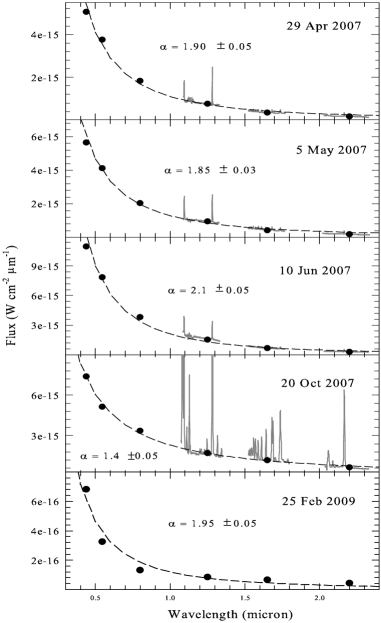
We analyze the evolution of the continuum flux distribution to check for any sign of dust formation and also analyze the general trend in the temporal evolution of the spectral energy distribution (SED). The continuum has been modeled with power-law
fits ( ), the results of which are shown in Figure 9, wherein
representative spectra on 2007 April 29, May 5, June 10 and October 20, sampling the duration of our observations have been plotted.
The spectra have been flux calibrated using contemporaneous values from Table 2 or data from Walter et al. (2012) after correcting these for reddening using E(B - V) = 0.58
as the average of the values provided by Munari et al. (2007a) and Rudy et al. (2007).
In the early stage i.e. during April 26 - May 5 of the evolution of V5558 Sgr, the continuum spectrum
is well matched with fits having spectral indices of 1.85 - 1.9.
The subsequent spectra, observed during Jun 7 - 10, tend to become slightly steeper with the
slope of = 2.1. Around the fifth maximum the SED becomes flatter with = 1.4
0.5. Proceeding further, we have also specifically tried to fit the SED
for 2009 February 25 which is about 317 days after the discovery. The result is shown in the last panel in Figure 9 where we have
used data from Walter et al. (2012) and magnitudes from AAVSO database.
We find that the continuum is well fitted by a power law, with the spectral index 1.95 0.5.
Such study of evolution of continuum has been performed in case of some other novae also. For example, in V574 Pup (Naik et al. 2010)
approximate value of the spectral index was observed to decline from a value of 2.75 in the initial stage. In KT eridani
(Raj et al. 2013) the value of the spectral index was found to decrease from 3.34 to 2.67.
However, in the case of V4633 Sgr (Lynch et al. 2001) the change in the slope of the continuum was
found to be in the opposite direction. The slope changed from 2
to 2.7 in observations taken 525 and 850 days after outburst.
In comparison, the behavior of V5558 Sgr is peculiar where did not increase or decrease monotonically as observed in other novae. This appears to be a consequence of the very slow evolution of the nova. It may be noted that a blackbody, in the Rayleigh-Jeans regime, is expected to give a index of 4, quite different from that seen here.
No evidence for dust formation is seen, which in case it is formed, will show up as a significant excess at the infrared wavelengths. This is not the case here. Observations by the Wide field Infrared Survey Explorer (WISE) too, at an even later date on 2010 23 March, do not show any source with infrared excess at the position of the nova indicating the non-formation of dust.
4 Summary
We have presented multi-epoch near-infrared spectroscopy and photometry observations of the slow nova V5558 Sgr which was discovered in April 2007 and which showed a sequence of multiple secondary outbursts. The optical light curve has been analyzed allowing a distance estimate of 1.55 0.25 kpc to be made. V5558 Sgr is a fairly unique nova by virtue of showing a rare reverse-hybrid transition from He/N to Fe II type, based on its optical spectra. However the near-infrared data do not show such a transition and a discussion is made of this aspect. A Case B recombination analysis of the hydrogen lines has been done allowing the mass of the gaseous component in the ejecta to be estimated to be (6.0 1.5) 10-4 M⊙ assuming a filling factor of unity.
5 Acknowledgments
The research work at S N Bose National Centre for Basic Sciences is funded by the Department of Space and Technology, Government of India. The research work at Physical Research Laboratory is funded by the Department of Space, Government of India. We are thankful to AAVSO, USA and AFOEV, France for the use of their optical photometric data.
References
- [\citeauthoryearBanerjee2003] Banerjee D. P. K., Ashok N. M., 2012, BASI, 40, 243
- [\citeauthoryearBanerjee2002] Banerjee D. P. K., Ashok N. M., 2002, AA, 395, 161
- [\citeauthoryearBanerjee2009] Banerjee D. P. K., Das R. K., Ashok N. M., 2009, MNRAS, 399, 357
- [\citeauthoryearBanerjee2010] Banerjee D. P. K., Das R. K., Ashok N. M. et al., 2010, MNRAS, 408, L71
- [\citeauthoryearCapaccioli2008] Capaccioli M., Della Valle M., D’Onofrio M. & Rosino L., 1990, 360, 63
- [\citeauthoryearDarnley2006] Darnley M. J., Bode M. F., Kerins E. et al., 2006, MNRAS, 369, 257
- [\citeauthoryearDas2008] Das R.K., Banerjee D. P. K., Ashok N. M., Chesneau O., 2008, MNRAS, 391, 1874
- [\citeauthoryearDas2009] Das R.K., Banerjee D.P.K., Ashok N.M., 2009, MNRAS, 398, 375
- [\citeauthoryeardella Valle1995] della Valle M., Livio M., 1995, ApJ, 452, 704
- [\citeauthoryearDownes2000] Downess R. A., Duerbeck H. W., 2000, AJ, 120, 2007
- [\citeauthoryearEvans2003] Evans A., Gehrz R. D., Geballe T. R. et al., 2003, AJ, 126, 1981
- [\citeauthoryearFriedjung1992] Friedjung M., 1992, A&A, 262, 487
- [\citeauthoryearHenden2007] Henden A., Munari U., 2007, IBVS, 5803
- [\citeauthoryearHummer1987] Hummer D. G., Storey P. J., 1987, MNRAS, 224, 801.
- [\citeauthoryearIiijima2007a] Iijima T., 2007a, CBET, 934
- [\citeauthoryearIiijima2007b] Iijima T., Correia A. P., Hornoch K., Carvajal J., 2007b, CBET, 1006
- [\citeauthoryearJoshi2014] Joshi V., Banerjee D. P. K., Ashok N. M., 2014, MNRAS, 443, 559
- [\citeauthoryearKato2002] Kato T., Uemura M., Haseda K., Yamaoka H., Takamizawa K., Fujii M., Kiyota S., 2002, PASJ, 54, 1009
- [\citeauthoryearKato2009] Kato, M., Hachisu, I. 2009, ApJ, 699, 1293
- [\citeauthoryearKato2011] Kato, M., Hachisu, I. 2011, ApJ, 743, 157
- [\citeauthoryearLynch2004] Lynch D.K., Wilson J. C., Rudy R. J., Venturini C. C., Mazuk S., Miler N. A., Puetter R. C., 2004, AJ, 127, 1089
- [\citeauthoryearLynch2007] Lynch D.K., Russell R. W., Rudy R.J., Pearson R., Woodward C. E., 2007, IAU Circ. 8874
- [\citeauthoryearMarshall2006] Marshall D. J., Robin A. C., Reyle C., Schultheis M., Picaud S., 2006, A&A, 453, 635
- [\citeauthoryearMunari2007a] Munari, U.; Siviero A., Dallaporta S. et al., 2007a, CBET, 965.
- [\citeauthoryearMunari2007b] Munari U., Orio M., Valentini M. et al., 2007b, CBET, 1010.
- [\citeauthoryearMunari2014] Munari U., Henden A., Banerjee D.P.K., Ashok N.M. , Righetti G.L., Dallaporta S. and Cetrulo G., 2014 (submitted)
- [\citeauthoryearNakano2007] Nakano S., Sakurai Y., Itagaki K., Koff R., 2007, IAU Circ. 8832
- [\citeauthoryearNaik2010] Naik S., Banerjee D. P. K., Ashok N. M., Das R. K., 2010, MNRAS, 404, 367
- [\citeauthoryearNaito2007] Naito H., Matsuda K., Yamaoka H., 2007, CBET 934
- [\citeauthoryearPoggiani2008] Poggiani R., 2008, NewA, 13, 557
- [\citeauthoryearPoggiani2010] Poggiani R., 2010, NewA, 15, 657
- [\citeauthoryearRaj2013] Raj A., Banerjee D. P. K., Ashok N. M., 2013, MNRAS, 433, 2657
- [\citeauthoryearRudy2000] Rudy R. J., Mazuk S., Puetter R. C., Hamann F., 2000, ApJ, 539, 166
- [\citeauthoryearRudy2007] Rudy R. J., Lynch D. K., Russell R. W., Woodward C. E., 2007, IAU Circ., 8884
- [\citeauthoryearRudy2002] Rudy R. J., Lynch D. K., Mazuk S., Venturini C. C., Puetter R. C., perry R. B., 2002, BAAS, 34, 1162
- [\citeauthoryearShen2009] Shen K. J., Idan I., Bildsten L., 2009, ApJ, 705, 693
- [\citeauthoryearShore2013] Shore S. N., 2013, A&A, 559, L7
- [\citeauthoryearStorey1995] Storey P. J., Hummer D. G., 1995, MNRAS, 292, 41
- [\citeauthoryearStrope2010] Strope R. J., Schaefer B. E., Henden A. A., 2010, AJ, 140, 34
- [\citeauthoryearTanaka2011] Tanaka J., Nogami D., Fujii M, Ayani K., Kato T., Maehara H., Kiyota S., Nakajima K., 2011, PASJ, 63, 911.
- [\citeauthoryearTerzan1970] Terzan A., 1970, POHP, 10, 167.
- [\citeauthoryearWagner1996] Wagner R. M., Depoy D. L., 1996, 467, 860
- [\citeauthoryearWalter2012] Walter F. M., Battisti A., Towers S. E., Bond H. E., Stringfellow G. S., 2012, PASP, 124, 1057.
- [\citeauthoryearWarner2008] Warner, B., 1995, Cataclysmic Variable Stars. Cambridge Astrophysics Series, Cambridge Univ. Press, Cambridge, New York, p. 260
- [\citeauthoryearWilliams2008] Williams R.E., 1992, AJ, 104, 725
- [\citeauthoryearWilliams1992] Williams R.E., 2012, AJ, 144, 98