Could the Earth’s surface Ultraviolet irradiance be blamed for the global warming?(I)
——A new effect may exist
Abstract
Whether natural factors could interpret the rise of the Earth’s surface temperature is still controversial. Though numerous recent researches have reported apparent correlations between solar activity and the Earth’s climate, solar activity has encountered a big problem when describing the rapid global warming after 1970s. Our investigation shows the good positive correlations between the Earth’s surface Ultraviolet irradiance (280-400 nm) and the Earth’s surface temperature both in temporal and spatial variations by analyzing the global surface Ultraviolet irradiance (280-400 nm) and global surface temperature data from 1980-1999. The rise of CO2 cannot interpret the good positive correlations, and we could even get an opposite result to the good correlations when employing the rise of CO2 to describe the relation between them. Based on the good positive correlations, we suggest a new effect, named “Highly Excited Water Vapor” (HEWV) effect, which can interpret how the Sun influences the Earth’s surface temperature reasonably, including the rapid warming after 1970s.
I introduction
The debate on whether the Sun could influence global surface temperature variation has been argued for years since 1976 after Eddy Eddy (1976) indicated the relation between solar activity and Earth’s surface temperature. Many researchers have found apparent correlations between solar activity and the Earth’s surface temperature Reid (1987); Friis-Christensen and Lassen (1991); Lassen and Friis-Christensen (1995); Lean et al. (1995); Solanki and Fligge (1999) and some physical mechanisms have been suggested to interpret the possible way of solar activity influencing global surface temperature Cubasch and Voss (2000); Haigh (1994, 1996); Reid (2000); Haigh et al. (1996); Svensmark and Friis-Christensen (1997). Some researchers, however, have also found a decoupling between solar activity and the Earth’s surface temperature since roughly 1970: the surface temperature continued to rise rapidly, while the solar irradiance did not show a corresponding increase in the same time Thejll and Lassen (2000); Solanki and Fligge (1998); Lockwood and Fr?hlich (2008). Solanki and Krivova Lockwood and Fr?hlich (2008) compared the constructed total solar irradiance, UV irradiance and the cosmic rays with the atmosphere temperature respectively, and got a conclusion that since roughly 1970 he Sun cannot have contributed more than to the steep temperature increase.
We consider the decoupling problem between solar activity and the Earth’s surface temperature being caused by the decrease of the Earth’s ozone layer and cloud cover. As we all know, solar Ultraviolet irradiance could be influenced by ozone layerCutchis (1974) and the cloud coverCalbo et al. (2005). o we employ the Earth’s surface Ultraviolet irradiance (280-400 nm, the same hereinafter) as the index of their variations, and via comparing it with the surface temperature to investigate the relation between surface Ultraviolet irradiance and surface temperature. We could see good positive correlations between surface temperature and surface Ultraviolet irradiance in Sec. III. And the physical mechanics behind the good correlations is discussed in Sec. IV, one probable mechanics is the cloud cover, and another, is the new effect raised by Chen it et al., named as “Highly Excited Water Vapor” effect.
II data
Climatological distributions of the Earth’s surface-level Ultraviolet radiation data from 1980 to 1999 is obtained from Lee-Taylor et al. (2010), and this data is the monthly mean data, on S-N, W-E () from 1980 to 1999, divided into several parts based on the spectra band, such as UVA: 325-400 nm, UVB: 280-325 nm. Then we interpolated and averaged the monthly data to the yearly anomalies in the spectra band 280-400 nm (UVA data plus UVB data) in . The yearly surface temperature anomalies on S-N, W-E () from 1980 to 1999 are downloaded directly from Goddard Institute for Space Studies (GISS), National Aeronautics and Space Administration (NASA).
III results
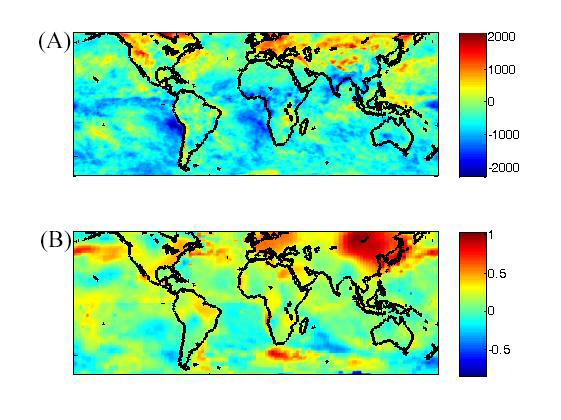
By taking investigation of the two datasets, we find the good correlation in spatial distribution (, ) between surface Ultraviolet irradiance and surface temperature in decadal variation. It is shown in Fig. 1. Surface Ultraviolet irradiance and surface temperature show large increase in latitude zone N-N, especially in Siberia, West Europe and North America.
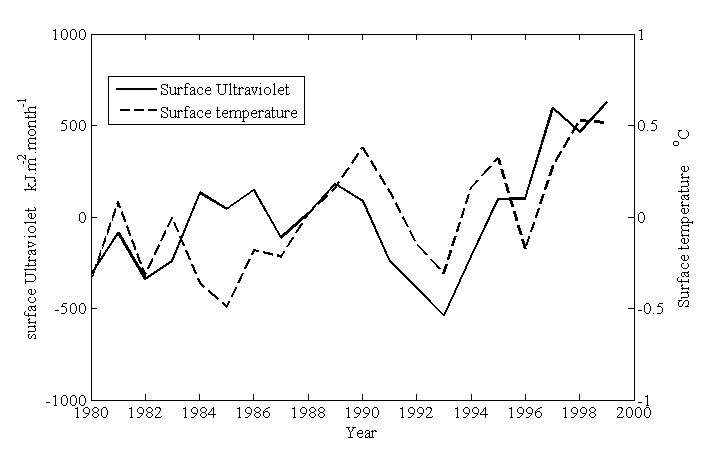
Because of the consistent largest increase between surface Ultraviolet irradiance and surface temperature in N-N, yearly zonal mean variation of them in this latitude region from 1980 to 1999 are calculated and compared. The result is shown in Fig. 2. We find that the surface Ultraviolet irradiance correlates with surface Ultraviolet irradiance very well (, ), except the years 1983-1984, 1989-1990 and 1997-1999, around El Niño appearance.
IV Discussion and suggestion
Because the Earth’s surface temperature is not considered in the process of the Earth’s surface ultraviolet irradiance calculation, and vice versa, so the good correlations are not caused by artificial calculation. That is, the good correlations indicate an exact physical relation between surface Ultraviolet irradiance and surface temperature. The rise of cannot be employed to describe the good correlations. Instead, it presents an opposite result, because based on the substantial hypothesis that in the warmer and moister CO2-rich atmosphere, cloud liquid water content will generally be larger and will increase the cloud’s albedo Somerville and Remer (1984), which will lead a decrease of the Ultraviolet irradiance. This leads to an opposite result to the good positive correlations.
IV.1 Could the cloud cover cause the good correlations?
Cloud cover, as a natural factor, may be a common factor to the good positive correlations between the Earth’s surface temperature and surface Ultraviolet irradiance, because cloud cover has influence on both ltraviolet irradiance Lee-Taylor et al. (2010) and global surface temperature Schneider (1972); Hartmann (1994). The decrease of the cloud could lead the increase of surface temperature and Ultraviolet irradiance at the same time, and cause the similarity between surface Ultraviolet irradiance and surface temperature. The International Satellite Cloud Climatology Project (ISCCP) did find the declining of the total cloud cover Schiffer and Rossow (1983), which gives us a positive motivation to research the effect of the cloud on the surface temperature variation.
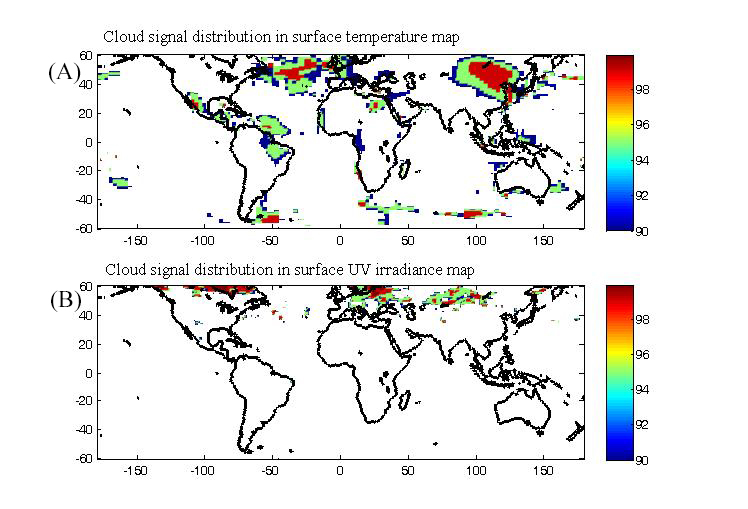
We test the cloud signal in the Earth’s surface temperature data and the Earth’s surface Ultraviolet irradiance data, respectively, by employing the total cloud coverage yearly variation from 1983 to 1999 Schiffer and Rossow (1983). We find both of the surface temperature and surface Ultraviolet irradiance data show their responses to the total cloud coverage signal, but the areas in the two data maps showing their responses to the cloud signal are very different (see Fig. 3). This could indicate that the cloud is not the main factor caused the good positive correlations between surface temperature and surface Ultraviolet irradiance, but more researches need to be done before we get the final conclusion.
IV.2 A new effect may exist
The good correlations between surface Ultraviolet irradiance and surface temperature could indicate a new effect: the surface Ultraviolet irradiance could have the ability to influence surface temperature variation directly. As we know, water vapor is the most important greenhouse gas, accounting for almost of the greenhouse effect Freidenreich and Ramaswamy (1993). Any change of it could lead a surface temperature change. Actually, water vapor has many properties that deserve to be paid more attention Bernath (2002), specifically its effects in highly excited vibrational states Zheng and Ding (2000). Here we concentrate on the effects of water vapor in highly vibrational states excited by Ultraviolet irradiance and propose a new suggestion as one of the paths that solar activity influences the Earth’s surface temperature variation.
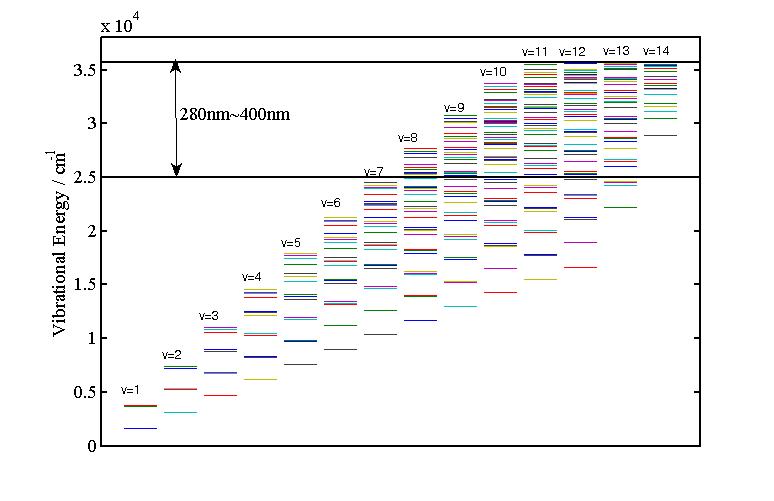
Figure 4 shows the vibrational energy states of a water molecule, which is calculated by Lie algebraic approach Zheng and Ding (2000); Iachello and Levine (1995). Water molecule at the low vibrational states can be excited by the Ultraviolet irradiance (280-400 nm) to a highly excited vibrational state region between the two bold-lines marked in Fig. 4, where there are more vibrational energy states and generate many new absorption lines and strengthen some absorption lines in infrared spectrum region.
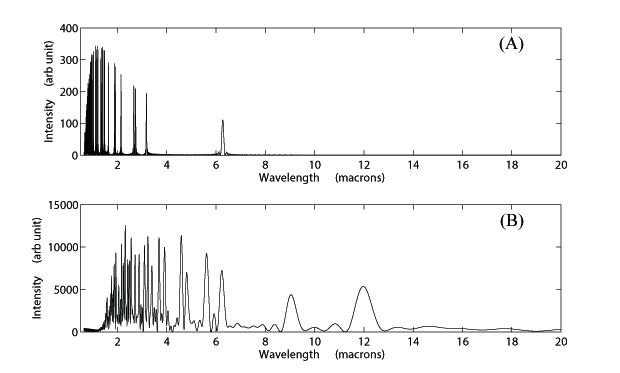
The water molecular spectroscopy calculation indicates that Ultraviolet irradiance changes water vapor’s infrared spectrum. The Infrared spectrum of water vapor in the highly excited vibrational states excited by the 380 nm Ultraviolet irradiance is shown in Fig. 5(B). By taking comparison with water vapor’s Infrared spectrum in low vibrational states (Fig. 5(A)), the spectra of water vapor in highly excited vibrational states shows many new absorption lines, such as absorption lines in , and . The and absorption lines are in the Earth’s atmospheric window, and the atmospheric window means this part of spectrum dose not be absorbed by the Earth’s atmosphere and just get through to the outer space. Also these two lines are in the spectra region that the Earth’s surface emits its maximum energy as a black body when its surface temperature is suggested as 288 K. This means we find more energy source for water vapor’s greenhouse effect, in other words, for the global warming.
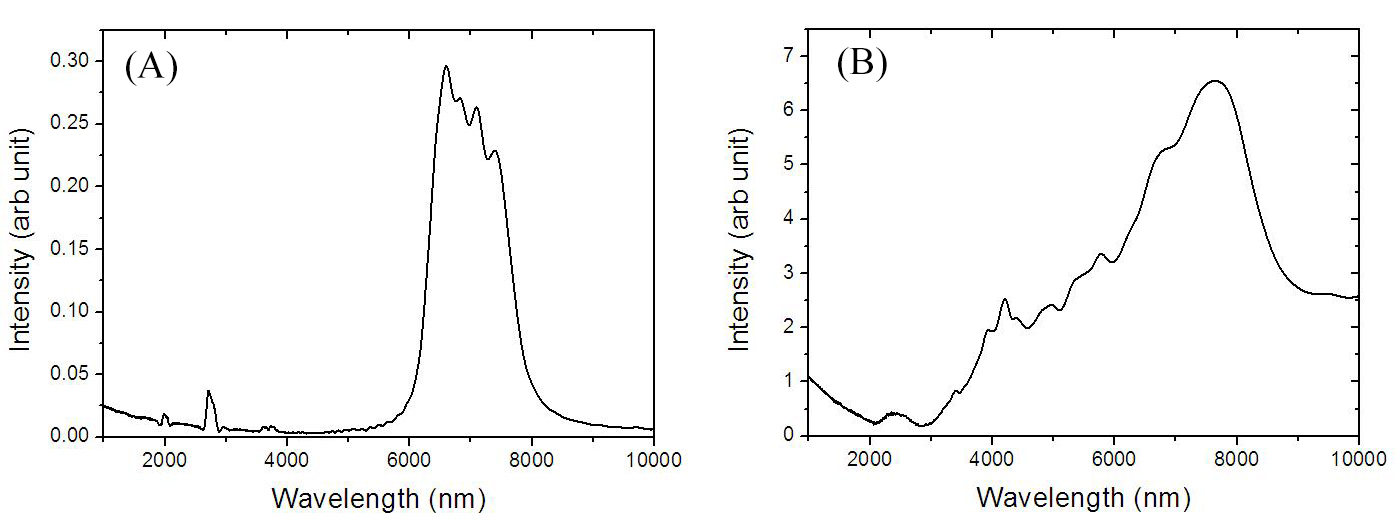
We calculate the highly excited water molecule’s photon absorption cross section, which is excited by the 380nm Ultraviolet irradiance, and compared with the low vibrational water molecule’s photon absorption cross section. We find that the photon absorption cross section of the highly excited water molecule is almost 20-100 times larger than that of the low energy state (see Fig. 6), which means the absorption ability of highly excited water molecule is much stronger than that of low vibrational energy water molecule.
The Ultraviolet irradiance in 380 nm is just one point of the 280-400 nm spectra band. We could also employ Ultraviolet irradiance in other wavelength to calculate highly excited water molecular spectroscopy, and could get other new absorption lines in water molecular and find more energy resource for the global warming.
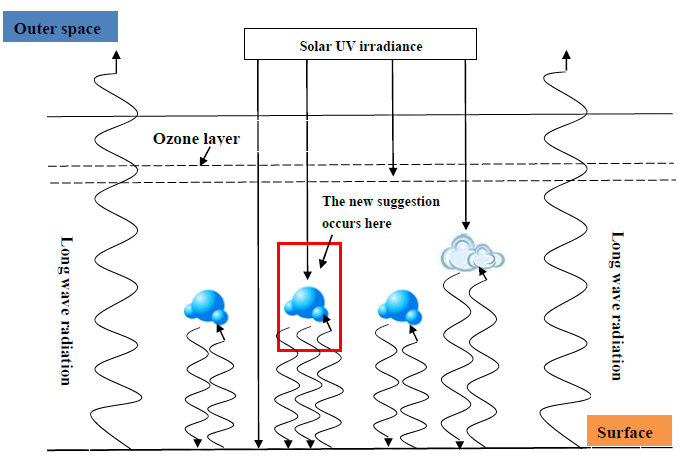
Based on the above analysis, we suggest that the Ultraviolet irradiance in the spectral band 280-400 nm in the Earth’s lower troposphere can be absorbed by water vapor, and then change water vapor’s infrared absorption spectrum, generating many new absorption lines. In other words, the Earth’s surface Ultraviolet irradiance enhances water vapor’s greenhouse effect and eventually influences the Earth’s surface temperature. The chart description of this physical process is shown in Fig. 7. We name this as “Highly Excited Water Vapor” (HEWV) effect.
The HEWV effect can highlight the importance of the solar activity in global surface temperature variation. Solar activity has the ability to influence global surface temperature variation through Ultraviolet irradiance in spectral band 280-400 nm. The role of ozone layer and cloud in this effect is like a thermostat, which absorbs or reflects Ultraviolet irradiance and tries to weaken the ability of solar activity influencing global surface temperature variation. After 1970s, the ozone layer and the cloud cover decrease, which makes the increase of the Earth’s surface Ultraviolet radiance and eventually leads the increase of global surface mean temperature.
Acknowledgements.
This work is supported by National Natural Science Foundation of China (Grant Nos. 11203004, 10978007, 11374191 and 91021009). The surface temperature data is from Goddard Institute for Space Studies (GISS), National Aeronautics and Space Administration (NASA). The total cloud coverage data is from the International Satellite Cloud Climatology Project (ISCCP) We are grateful to Julia Lee-Taylor for providing the surface Ultraviolet irradiance data, to Zi-Niu Xiao for discussion.References
- Eddy (1976) J. A. Eddy, Science 192, 1189 (1976).
- Reid (1987) G. C. Reid, Nature 329, 142 (1987).
- Friis-Christensen and Lassen (1991) E. Friis-Christensen and K. Lassen, Science 254, 698 (1991).
- Lassen and Friis-Christensen (1995) K. Lassen and E. Friis-Christensen, Journal of Atmospheric and Terrestrial Physics 57, 835 (1995).
- Lean et al. (1995) J. Lean, J. Beer, and R. Bradley, Geophysical Research Letters 22, 3195 (1995).
- Solanki and Fligge (1999) S. K. Solanki and M. Fligge, Geophysical Research Letters 26, 2465 (1999).
- Cubasch and Voss (2000) U. Cubasch and R. Voss, Space Science Reviews 94, 185 (2000).
- Haigh (1994) J. D. Haigh, Nature 370, 544 (1994).
- Haigh (1996) J. D. Haigh, Science 272, 981 (1996).
- Reid (2000) G. C. Reid, Space Science Reviews 94, 1 (2000), ISSN 0038-6308.
- Haigh et al. (1996) J. D. Haigh, A. R. Winning, R. Toumi, and J. W. Harder, Science 272, 981 (1996).
- Svensmark and Friis-Christensen (1997) H. Svensmark and E. Friis-Christensen, Journal of Atmospheric and Solar-Terrestrial Physics 59, 1225 (1997).
- Thejll and Lassen (2000) P. Thejll and K. Lassen, Journal of Atmospheric and Solar-Terrestrial Physics 62, 1207 (2000).
- Solanki and Fligge (1998) S. K. Solanki and M. Fligge, Geophysical Research Letters 25, 341 (1998).
- Lockwood and Fr?hlich (2008) M. Lockwood and C. Fr?hlich, Proceedings of the Royal Society A: Mathematical, Physical and Engineering Science 464, 1367 (2008).
- Cutchis (1974) P. Cutchis, Science 184, 13 (1974).
- Calbo et al. (2005) J. Calbo, D. Pages, and J.-A. Gonzalez, Reviews of Geophysics 43, n/a (2005), ISSN 1944-9208, URL http://dx.doi.org/10.1029/2004RG000155.
- Lee-Taylor et al. (2010) J. Lee-Taylor, S. Madronich, C. Fischer, and B. Mayer, in UV Radiation in Global Climate Change, edited by W. Gao, J. Slusser, and D. Schmoldt (Springer Berlin Heidelberg, 2010), pp. 1–20, ISBN 978-3-642-03312-4, URL http://dx.doi.org/10.1007/978-3-642-03313-1_1.
- Somerville and Remer (1984) R. C. J. Somerville and L. A. Remer, Journal of Geophysical Research: Atmospheres 89, 9668 (1984), ISSN 2156-2202, URL http://dx.doi.org/10.1029/JD089iD06p09668.
- Schneider (1972) S. H. Schneider, J. Atmos. Sci. 29, 1413 (1972).
- Hartmann (1994) D. Hartmann, Global Physical Climatology, International Geophysics (Elsevier Science, 1994), ISBN 9780080571638.
- Schiffer and Rossow (1983) R. Schiffer and W. Rossow, Bull. Amer. Meteorol. Soc. 64, 779 (1983).
- Freidenreich and Ramaswamy (1993) S. M. Freidenreich and V. Ramaswamy, Journal of Geophysical Research: Atmospheres 98, 7255 (1993), ISSN 2156-2202, URL http://dx.doi.org/10.1029/92JD02887.
- Bernath (2002) P. F. Bernath, Phys. Chem. Chem. Phys. 4, 1501 (2002), URL http://dx.doi.org/10.1039/B200372D.
- Zheng and Ding (2000) Y. Zheng and S. Ding, Journal of Molecular Spectroscopy 201, 109 (2000), ISSN 0022-2852, URL http://www.sciencedirect.com/science/article/pii/S0022285200980603.
- Iachello and Levine (1995) F. Iachello and R. D. Levine, Algebraic Theory of Molecules (Oxford University Press, New York, 1995).