The weak electronic correlations and absence of heavy Fermion state in KNi2Se2
Abstract
We have studied the low-lying electronic structure of a new ThCr2Si2-type superconductor KNi2Se2 with angle-resolved photoemission spectroscopy. Three bands intersect the Fermi level, forming complicated Fermi surface topology, which is sharply different from its isostructural superconductor KxFe2-ySe2. The Fermi surface shows weak variation along the direction, indicating its quasi-two-dimensional nature. Further comparison with the density functional theory calculations demonstrates that there exist relatively weak correlations and substantial hybridization of the Ni 3 and the Se 4 orbitals in the low-lying electronic structure. Our results indicate that the large density of states at the Fermi energy leads to the reported mass enhancement based on the specific heat measurements. Moreover, no anomaly is observed in the spectra when entering the fluctuating charge density wave state reported earlier.
pacs:
74.25.Jb, 74.70.-b, 79.60.-i, 71.20.-bI introduction
The iron-chalcogenide superconductors AxFe2-ySe2 (A=K, Rb, etc.) with superconducting transition temperature () up to 33 K have aroused a great deal of research interests KFeSe discovery ; KFeSe AFM insulator ; TlFeSe ; KFeSe high TN ; KFeSe phase diagram ; Neutron ; KFeSe review . Compared with the iron pnictide superconductors, AxFe2-ySe2 exhibits some unique properties, such as the antiferromagnetically ordered insulator parent compound with Fe vacancy order KFeSe AFM insulator ; KFeSe high TN ; KFeSe phase diagram ; Neutron . Particularly, angle-resolved photoemission spectroscopy (ARPES) revealed that the Fermi surface of the superconducting phase is consisted of electron pockets only, raising a serious challenge to the prevalent Fermi surface nesting mechanism for the superconductivity in iron-based superconductors KFeSe ARPES1 ; KFeSe ARPES2 .
Recently, another chalcogenide superconductor KNi2Se2 was reportedKNiSe polycrystal , which shares the same crystal structure and almost the same lattice constants with KxFe2-ySe2, except that there are no vacancies in KNi2Se2 KNiSe single crystal . However, previous experiments indicated that KNi2Se2 displays a rich but sharply different phase diagram from that of KxFe2-ySe2. Based on the specific heat measurements and neutron pair-distribution-function analysis, KNi2Se2 was suggested to show a local charge density wave (CDW) fluctuating state above 20 K, which then enters a coherent heavy-Fermion state at lower temperatures. Eventually, it becomes superconducting below 0.8 K KNiSe polycrystal . The large linear specific heat coefficient (or Sommerfeld coefficient, ) was proposed to be due to the strong electron correlation and heavy Fermion behavior in KNi2Se2. More specifically, mix valency of the Ni atoms was proposed to induce the heavy effective band mass . On the other hand, we note that the band renormalization factor of BaNi2As2 (a superconductor with 0.7 K) is merely 1.66, in the weak-interaction regime, and thus the conventional electron-phonon interaction mechanism was suggested to be the cause of the superconductivity therein BaNi2As2 . In an ionic picture, the Ni orbital configuration is 3 for BaNi2As2, and 3 for KNi2Se2. Consequently, the Hund’s rule coupling and electron correlations should be weakened with the increasing number of electrons in the latter compound ZirongPRX , which is inconsistent with the proposed heavy Fermion scenario in KNi2Se2. To resolve this controversy and understand the unique properties of KNi2Se2, it is critical to study its electronic structure.
In this article, we have systematically studied the electronic structure of the single-crystalline KNi2Se2 with ARPES. There are two electron pockets around the point, a hole-like square pocket surrounding the point, and a hole-like narrow race-track pocket surrounding the point, respectively. The electronic structure of KNi2Se2 shows relatively weak dependence, indicative of its two-dimensional (2D) character. Further comparison between the density functional theory (DFT) band calculations and ARPES data gives a renormalization factor of about 1.54, which indicates that the electron correlations are weak. The coherent bands are present at high temperatures, and there is no incoherent-weight-to-coherent-band transition at low temperatures as in heavy Fermion materials. Instead, we find that the Fermi velocities of several bands are relatively small and thus enhance the density of states (DOS) at the Fermi energy (). Our quantitative analysis shows that the large of KNi2Se2 together with those of BaNi2As2 and KFe2As2 (which has even larger ), can be well accounted by the multiple large Fermi surfaces and relatively small Fermi velocities in these systems without invoking any heavy Fermion physics.
II experimental
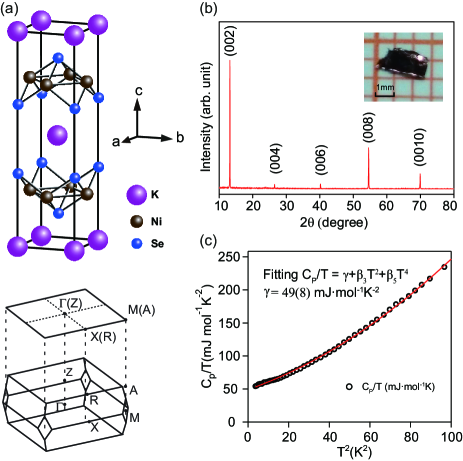
High quality single crystals of KNi2Se2 were grown by self-flux method with nominal composition K:Ni:Se = 1:2:2. The mixture was loaded into the alumina crucible and then sealed in an argon-filled iron crucible. The entire assembly was kept at 1273 K for 3 hours, and then cooled down to 873 K slowly at a rate of 4 K/h before shutting off the power. The samples are crystallized in the tetragonal ThCr2Si2-type structure with the space group , as shown in Fig. 1(a)KNiSe crystal structure . The as-grown single crystals with a typical dimension of 2.51.00.1 mm3 show flat shiny surface of pink color after cleavage [the inset of Fig. 1(b)]. The electron probe micro analysis (EPMA) measurements across samples with more than 10 points indicate that the composition is quite homogeneous, and the averaged stoichiometric ratio is determined to be KNi2.06Se2.01. Since this determined composition is close to the stoichiometry, we will still designate the samples as KNi2Se2 for convenience hereafter. In Fig. 1(b), X-ray diffraction measurements show that only the series of () narrow reflection peaks appear, suggestive of the good crystalline quality. The low-temperature specific heat [Fig. 1(c)] can be well fitted by the formula in the temperature range from 1.8 K to 10 K, and the resulting large Sommerfield coefficient [=49.8 mJ mol-1 K-2] is in good agreement with previous reports KNiSe polycrystal ; KNiSe single crystal . For comparison, we note that the corresponding is about 13.2 mJ mol-1 K-2 for BaNi2As2 BaNiAs HC , and about 94.3 mJ mol-1 K-2 for KFe2As2 KFeAs HC .
ARPES measurements were performed at (1) Beamline 7U of the UVSOR synchrotron facility with a MBS A-1 electron analyzer, (2) Beamline 28A of Photon Factory (PF), KEK, Tsukuba, with a Scienta SES-2002 analyzer, and (3) the in-house system equipped with an SPECS UVLS helium discharging lamp and VG Scienta R4000 electron analyzer. The overall energy resolution was set to 15-30 meV depending on the photon energy, and the typical angular resolution was 0.3∘. Samples were cleaved in situ and then measured under ultrahigh vacuum better than 610-11 mbar. The sample surfaces were stable and did not show any sign of degradation during the measurements.
The first-principles calculations were implemented in the VASP code VASP . The plane wave basis method and the Perdew-Burke-Ernzerhof PBE exchange correlation potential have been used. Throughout the calculations, a eV cutoff in the plane wave expansion and a Monkhorst-Pack grid were chosen to ensure the calculation with an accuracy of eV. In our calculations, the crystal structure and lattice constants were taken from the experimental valuesKNiSe polycrystal ; KNiSe crystal structure .
III Experimental results
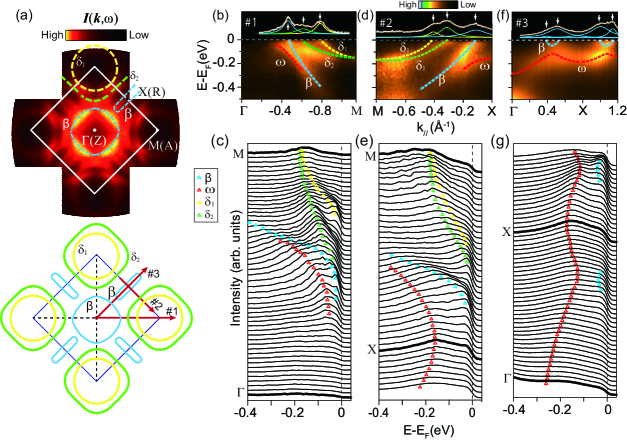
The photoemission intensity map of KNi2Se2 at 15 K is shown in Fig. 2(a), which is overlaid on the projected 2D Brillouin zone. The resulting Fermi surface (FS) consists of one square-like Fermi pocket around the zone center, two Fermi pockets around zone corner, and one narrow race-track pocket extending to the middle of zone boundaries, as highlighted by the colored dashed lines. This complicated FS is a direct evidence of the multi-band behavior in this compound, consistent with previous Hall effect measurement KNiSe single crystal and theoretical calculations KNiSe band calculation1 ; KNiSe band calculation2 . Although this multi-band character is similar to iron-based superconductors, the detailed FS topology of KNi2Se2 is distinct from that of KxFe2-ySe2, which only exhibits circular electron-like pockets around the zone cornerKFeSe ARPES1 ; KFeSe ARPES2 .
Now we examine the band dispersions of KNi2Se2 along several high-symmetry directions as indicated in the lower panel of Fig. 2(a). We chose 75 eV photons to probe the band structure near the XM plane of KNi2Se2 considering an inner potential of 15 eV as discussed below. Along - [cut #1 in Fig. 2(b)], three Fermi crossings can be identified by fitting the corresponding momentum distribution curve (MDC) at . Moreover, the corresponding band dispersions can be tracked with the peaks in the energy distribution curves (EDCs) [Fig. 2(c)], and they are assigned as , , and , respectively. Among them, the hole-like band encloses the point, forming the square-shaped Fermi pocket; while, the and bands seem to be degenerate at the point with the band bottoms at 180 meV, developing two electron pockets around the zone corner. Besides, there is another weak feature () around the point, whose band top is about 50 meV below . Along - [ cut #2 in Fig. 2(d)], three bands cross as well, which are further confirmed by the peaks in the corresponding MDC fitting and EDCs [Fig. 2(e)]. Taking into account the bottom positions of these bands, we can infer that these two electron-like bands around are the and bands, respectively. Based on the band calculations presented in Fig. 4 later, the band near (marked by blue dashed lines) is .
Along - , data in Figs. 2(f) and 2(g) show a shallow electron-like band (blue dashed line). Based on the analysis presented in Fig. 4 later, this feature is actually contributed mostly by the band. Such a shallow electron-like band is due to a pronounced hybridization between and shown here. However, it does not develop into a closed electron pocket. Instead, it forms the narrow race-track hole-like Fermi pocket () surrounding .
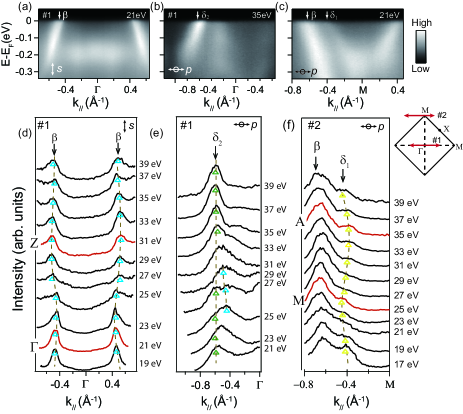
To fully reveal the Fermi surface topology in the three-dimensional Brillouin zone, we have performed detailed photon energy dependent ARPES measurements. Along cut #1, only band shows up in the polarization [Fig. 3(a)]. The Fermi momenta (’s) of are determined by peak positions in MDCs in [Fig. 3(d)]. Taking the inner potential of 15 eV to estimate the ’s for different photon energies, we notice that ’s of move periodically from (probed with 21 eV photons) to (probed with 31 eV photons). Our data could cover more than half of the Brillouin zone along the direction. On the other hand, is clearly resolved in the polarization [Fig. 3(b)], which shows negligible dispersion as shown in Fig. 3(e). Along cut #2, and band show up in the polarization [Fig. 3(c)]. As shown in Fig. 3(f), there is some dispersion along for the band. In general, the dispersions of these bands are not strong, manifesting the 2D nature of KNi2Se2. Our result is consistent with the previous theoretical calculations except for the hole-like pocket centered at the point, which was suggested to be more three-dimensional-likeKNiSe band calculation1 ; KNiSe band calculation2 . This discrepancy might be partially attributed to the poor resolution in ARPES experiments.
IV Discussions and Conclusions
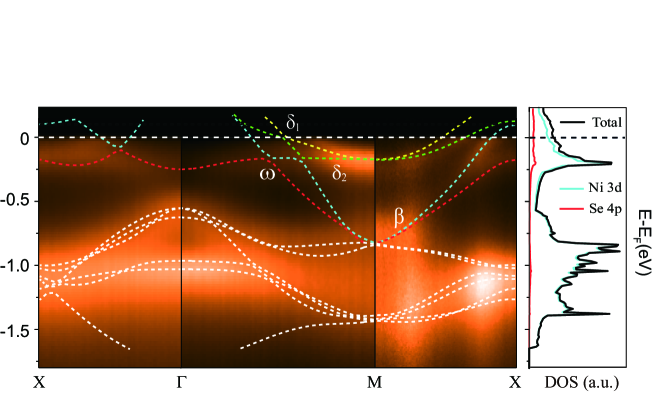
The measured quasi-2D electronic structure of KNi2Se2 is compared with the band structure obtained from our first-principles calculations. In Fig. 4, the calculated band (dashed lines) are scaled and appended onto the photoemission intensity plots along the three high symmetry directions. Here, a renormalization factor of about 1.54 to the calculations leads to a remarkable agreement with the experimental data. Almost all characteristic dispersions, even the small electron-like feature along - direction, can be reproduced well by the calculations. This relatively small renormalization factor demonstrates that the electron correlations in this system are rather weak. Furthermore, we present the calculated total DOS and the projected DOS of KNi2Se2 in the right panel of Fig. 4. Near , there are some contribution from the Se 4 orbitals in addition to the dominating contribution from Ni 3 orbitals.
The small renormalization factor found here for KNi2Se2 is similar to that of BaNi2As2 (1.66) BaNi2As2 , which suggests that electron correlations are weak in both systems. This is consistent with their Ni orbital configurations, i.e. 3 for BaNi2As2, and 3 for KNi2Se2. Hund’s rule coupling is the main source of correlations in these materials, and it has been shown recently that the correlations are reduced dramatically from 3 to 3 with electron doping, and superconductivity diminishes with weakened correlations ZirongPRX . Therefore, compared with the iron-based superconductors, the even higher 3 occupation and weaker correlations in these Ni-based compound suggest that the superconductivity is most likely due to the electron-phonon coupling, similar to that in the multi-band superconductor MgB2 1MgB2 ; 2MgB2 .
One of the most intriguing aspects of KNi2Se2 is the possible heavy electronic state existing below 20 K (), with an enhanced effective electronic band mass. However, this is not consistent with the well-defined bands observed at 15 K and the weakly correlated electronic structure. To understand the origin of the large Sommerfield coefficient in KNi2Se2, we compare its specific heat and electronic structure with those of BaNi2As2 and KFe2As2. The latter has a Fe 3 orbital configuration, which fosters stronger Hund’s rule coupling and higher electron correlations (renormalization factor ) KFeAs ARPES , leading to higher (94.3 mJ mol-1 K-2) KFeAs HC . Meanwhile, the is 49.8 mJ mol-1 K-2 for of KNi2Se2, and 13.2 mJ mol-1 K-2 for BaNi2As2 BaNiAs HC .
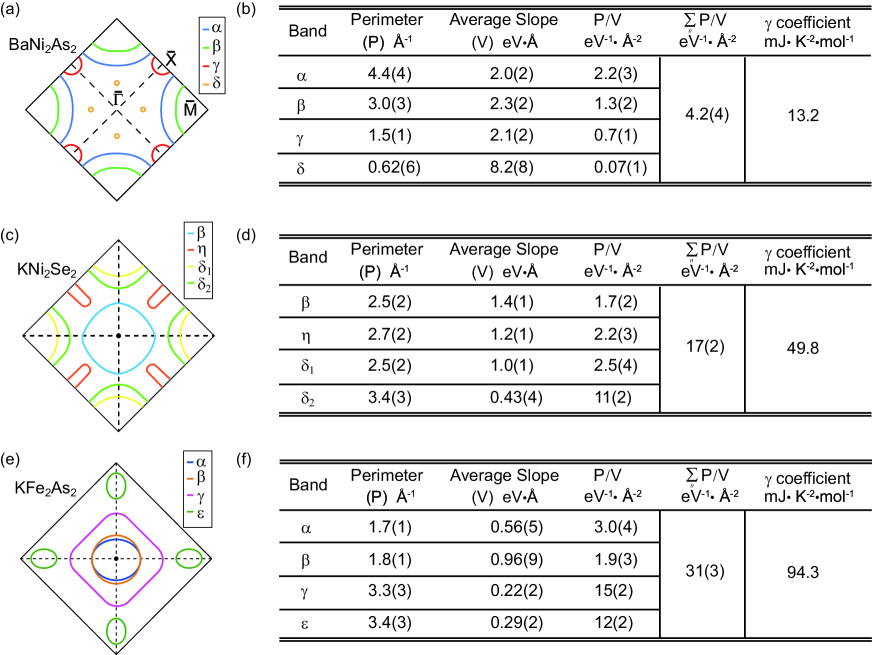
As the electronic specific heat coefficient is proportional to the DOS at , which can be further estimated by the formula , where is the band index, is the mean velocity of an electron at . For a 2D system, the formula can be simplified through: the perimeter of Fermi surface, and the Fermi velocity or the band slope at . Thus we can roughly evaluate the DOS at of these systems, as shown in Fig. 5.
By estimation, we notice that the total Fermi surface perimeters are similar for all three systems [Figs. 5(a), 5(c), and 5(e)]. However, the average Fermi velocity decreases rapidly in the order of BaNi2As2, KNi2Se2 and KFe2As2 [Figs. 5(b), 5(d), and 5(f)]. Consequently, the estimated DOS value in KNi2Se2 is 4.0(6) times of that of BaNi2As2 , which is generally consistent with the corresponding ratio (3.8) of their coefficients. Similarly, both the estimated DOS and of KFe2As2 are about 1.81.9 times of those of KNi2Se2. Therefore, our data suggest that the large in KNi2Se2 is due to the relatively flat bands (especially ) in combination with the large Fermi surface perimeters, instead of the heavy Fermion state. These are confirmed by our DFT calculations, which gives flat and . Our results also suggest that the large in KFe2As2 is not due to heavy Fermion physics, but due to strong correlations or Hund’s rule coupling there as well. Furthermore, the remarkably good agreement between the estimated DOS at and the measured for all three systems with different levels of correlation strength shows that this new way of quantitative analysis can provide valuable insight for understanding the thermal dynamical properties of these multi-band materials.
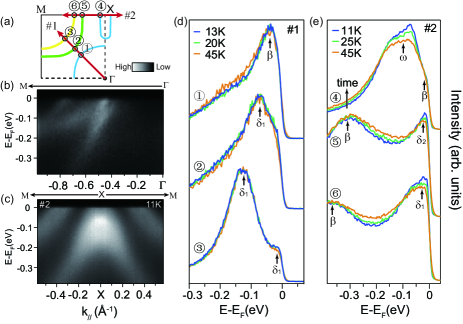
The neutron pair-distribution-function analysis revealed that the local CDW fluctuation occurs at and disappears upon further cooling KFeSe discovery . Temperature evolution of the electronic structure is shown in Fig. 6. The photoemission intensity along - M (cut #1) was displayed in Fig. 6(b), we found that there is no evident spectral weight change with temperature within our energy resolution, except for some thermal broadening effects [Fig. 6(d)]. Along M - X (cut #2), as shown in Fig. 6(c), there is a spectral weight suppression with increasing temperature for , , and , as indicated by the up arrows in Fig. 6(e). However, the spectral weight suppression rate do not alter noticeably across . Similar spectral weight change was observed in Sr2CuO2Cl2 and BaTi2As2O, which is explained by strong coupling between electrons and magnons or phonons SrCuOCl ; BaTiAsO . For BaTi2As2O, a change of the spectral weight evolution rate was observed at the CDW ordering temperature. The absence of anomaly at here is likely due to the fact that the CDW fluctuation in KNi2Se2 was reported to be dynamic and/or entirely uncorrelated between unit cells within the plane, in contrast to the coherent CDWs observed in structurally related compounds such as NbSe2 Dawei . Nevertheless, since we observed spectral weight supression at nested Fermi surface sections, it may indicate that the enhanced electron-phonon interactions in these sectors may be responsible for the local CDW fluctuations.
To summarize, we have systematically studied the electronic structure of KNi2Se2 by high-resolution ARPES. There are three bands intersecting the Fermi level, which form two electron-like pockets, one square-like and one elongated elliptical hole-like pockets surrounding the M, and X points, respectively. Furthermore, the electronic structure of this multi-orbital superconductor shows relatively weak dependence, indicative of its 2D nature. Further comparison with the DFT band calculations suggests that the electron correlations therein are relatively weak. Our results clearly indicate that it is not the heavy Fermion behavior advocated before, but the relative small Fermi velocities of bands in combination with large Fermi surfaces that lead to the large DOS and electronic specific heat coefficient in KNi2Se2. We also practiced a new way to quantitatively estimate DOS from ARPES data, which would provide valuable insight for understanding the thermal dynamic properties. Moreover, we observed intriguing temperature dependence of the electronic structure in the nested Fermi surface sectors, although we did not observe evident anomaly across . This may be consistent with the local fluctuating CDW in KNi2Se2.
V acknowledgement
We gratefully acknowledge the helpful discussions with Prof. Xiangang Wan. This work was supported by National Basic Research Program of China (973 Program) under the grant Nos. 2011CBA00106, 2011CBA00112, 2012CB927401, and the National Science Foundation of China under Grant Nos. 11104304, 11227902 and 11274332. M. Y. Li and D. W. Shen are also supported by the Strategic Priority Research Program (B)” of the Chinese Academy of Sciences (Grant No. XDB04040300).
References
- (1) J. G. Guo, S. F. Jin, G. Wang, S. C. Wang, K. X. Zhu, T. T. Zhou, M. He, and X. L. Chen, Phys. Rev. B 82, 180520 (R) (2010).
- (2) H. D. Wang, C. H. Dong, Z. J. Li, S. S. Zhu, Q. H. Mao, C. M. Feng, H. Q. Yuan and M. H. Fang, Europhys. Lett. 93, 47004 (2011).
- (3) M. H. Fang, H. D. Wang, C. H. Dong, Z. J. Li, C. M. Feng, J. Chen, and H. Q. Yuan, Europhys. Lett. 94, 27009 (2011).
- (4) W. Bao, Q. Huang, G. F. Chen, M. A. Green, D. M. Wang, J. B. He, X. Q. Wang, and Y. Qiu, Chin. Phys. Lett. 28, 086104 (2011).
- (5) F. Ye, S. Chi, W. Bao, X. F. Wang, J. J. Ying, X. H. Chen, H. D. Wang, C. H. Dong and M. H. Fang, Phys. Rev. Lett. 107, 137003 (2011).
- (6) Y. J. Yan, M. Zhang, A. F. Wang, J. J. Ying, Z. Y. Li, W. Qin, X. G. Luo, J.Q. Li, J. P. Hu, and X. H. Chen, Scientific Reports, 2, 212 (2012).
- (7) H. H. Wen, Rep. Prog. Phys. 75, 112501 (2012).
- (8) T. Qian, X. P. Wang, W. C. Jin, P. Zhang, P. Richard, G. Xu, X. Dai, Z. Fang, J. G. Guo, X. L. Chen, and H. Ding, Phys. Rev. Lett. 106, 187001 (2011).
- (9) Y. Zhang, L. X. Yang, M. Xu, Z. R. Ye, F. Chen, C. He, H. C. Xu, J. Jiang, B. P. Xie, J. J. Ying, X. F.Wang, X. H. Chen, J. P. Hu, M. Matsunami, S. Kimura, and D. L. Feng, Nat. Matt. 10, 273 (2011).
- (10) J. R. Neilson, A. Llobet, A. V. Stier, L. Wu, J. J. Wen, J. Tao, Y. M. Zhu, Z. B. Tesanovic, N. P. Armitage, and T. M. McQueen, Phys. Rev. B 86, 054512 (2012).
- (11) H. C. Lei, M. Abeykoon, K. F. Wang, E. S. Bozin, H. Ryu, D. Graf, J. B. Warren, and C. Petrovic, J. Phys.: Condens. Matter. 26, 015701 (2014).
- (12) B. Zhou, M. Xu, Y. Zhang, G. Xu, C. He, L. X. Yang, F. Chen, B. P. Xie, X. Y. Cui, M. Arita, K. Shimada, H. Namatame, M. Taniguchi, X. Dai, and D. L. Feng, Phys. Rev. B 83, 035110 (2011).
- (13) Z. R. Ye, Y. Zhang, F. Chen, M. Xu, J. Jiang, X. H. Niu, C. H. P. Wen, L. Y. Xing, X. C. Wang, C. Q. Jin, B. P. Xie, and D. L. Feng, Phys. Rev. X 4, 031041 (2014).
- (14) J. R. Neilson and T. M. McQueen, J. Am. Chem. Soc. 134, 7750 (2012).
- (15) A. S. Sefat, M. A. McGuire, R. Y. Jin, B. C. Sales, D. Mandrus, F. Ronning, E. D. Bauer, and Y. Mozharivskyj, Phys. Rev. B 79, 094508 (2009).
- (16) T. Sato, K. Nakayama, Y. Sekiba, P. Richard, Y.-M. Xu, S. Souma, T. Takahashi, G. F. Chen, J. L. Luo, N. L. Wang, and H. Ding, Phys. Rev. Lett. 103, 047002 (2009).
- (17) M. A. Hafiez, S. Aswartham, S. Wurmehl, V. Grinenko, C. Hess, S. L. Drechsler, S. Johnston, A. U. B. Wolter, B. Bchner, H. Rosner, and L. Boeri, Phys. Rev. B 85, 134533 (2012).
- (18) G. Kresse and J. Furthmuller, Phys. Rev. B 54, 11169 (1996).
- (19) J. P. Perdew, K. Burke, and M. Ernzerhof, Phys. Rev. Lett. 77, 3865 (1996).
- (20) F. Lu, J. Z. Zhao, and W. H. Wang, J. Phys.: Condens. Matter 24, 495501 (2012).
- (21) V. V. Bannikov, A. L. Ivanovskii, Physica B 418, 76 (2013).
- (22) We estimated the values according to the free-electron final-state model, where the inner potential of 15 eV was used.
- (23) C. Kim, F. Ronning, A. Damascelli, D. L. Feng, Z. X. Shen, B. O. Wells, Y. J. Kim, R. J. Birgeneau, M. A. Kastner, L. L. Miller, H. Eisaki, and S. Uchida, Phys. Rev. B 65, 174516 (2002).
- (24) H. C. Xu, M. Xu, R. Peng, Y. Zhang, Q. Q. Ge, F. Qin, M. Xia, J. J. Ying, X. H. Chen, X. L. Yu, L. J. Zou, M. Arita, K. Shimada, M. Taniguchi, D. H. Lu, B. P. Xie, and D. L. Feng, Phys. Rev. B 89, 155108 (2014).
- (25) D.W. Shen, B. P. Xie, J. F. Zhao, L. X. Yang, L. Fang, J. Shi, R. H. He, D. H. Lu, H. H. Wen, and D. L. Feng, Phys. Rev. Lett. 99, 216404 (2007).
- (26) I. I. Mazin, O. K. Andersen, O. Jepsen, O.V. Dolgov, J. Kortus, A. A. Golubov, A. B. Kuz? menko, and D. van der Marel, Phys. Rev. Lett. 89, 107002 (2002).
- (27) H. Uchiyama, K. M. Shen, S. Lee, A. Damascelli, D. H. Lu, D. L. Feng, Z.-X. Shen, and S. Tajima, Phys. Rev. Lett. 88, 157002 (2002).