Probing Mass Segregation in the Globular Cluster NGC 6397
Abstract
In this study, we present a detailed study of mass segregation in the globular cluster NGC 6397. First, we carry out a photometric analysis of projected ESO-VLT data (between 1 and 10 arcmin from the cluster centre), presenting the luminosity function corrected by completeness. The luminosity function shows a higher density of bright stars near the central region of the data, with respect to the outer region. We calculate a deprojected model (covering the whole cluster) estimating a total number of stars of 193 00019 000. The shapes of the surface brightness and density-number profiles versus the radial coordinate r (instead of the projected coordinate R) lead to a decreasing luminosity for an average star, and thus of mass, up to 1 arcmin, quantifying the mass segregation. The deprojected model does not show evidence of mass segregation outside this region.
keywords:
globular cluster, NGC 6397, mass segregation, deprojection.1 Introduction
Globular clusters (GCs) are among the oldest structures in the Milky Way. Their fundamental parameters (e.g. age, metallicity, mass, spatial distribution) constitute a valuable source of basic information on the early stages of Galactic formation (e.g. Gratton et al., 2003). In addition, they can be used as unique test-beds of star formation and stellar evolution models (e.g. Heyl et al., 2012).
One of the most interesting aspects of GCs is their dynamical evolution. At high stellar densities, binary encounters may be frequent and, over time, tend to establish a state of equal energy among the member stars. On average, more massive stars transfer orbital energy to the less-massive ones in the encounters. In this context, heavier stars tend to clump in the cluster centre while the lighter ones orbit the outskirts, with some fraction even escaping the system and populating the Milky Way stellar field (e.g. McLaughlin & Fall, 2008; van Putten, 2012). This dynamical process is called mass segregation. Eventually, the accumulation of massive stars in the cluster centre may collapse, thus leading to the core collapse phase (e.g. Djorgovski & King, 1986; Trager et al., 1995).
Observationally, mass segregation can be characterized by a mass function with a systematic radial variation (Andreuzzi et al., 2004) expected to depend on the prior dynamical evolution of the cluster (Hurley et al., 2008).
Because of its relative proximity, NGC 6397 has been the focus of several observational and theoretical studies, as well as N-body simulations (Hurley et al., 2008). At a distance from the Sun of kpc (Heyl et al., 2012), NGC 6397 is one of the nearest GCs, which makes its faint stars more accessible than in other more distant GCs. Besides, NGC 6397 has a very-low metallicity, (Carretta et al., 2009), which indicates that it was formed from primordial clouds in the Milky Way, or elsewhere.
Regarding mass segregation in NGC 6397, previous works present conflicting results, with some showing evidence of mass segregation (e.g. King et al., 1995; Andreuzzi et al., 2004), while others do not (e.g. Drukier, 1993).
In this work we present a photometric analysis of NGC 6397 to quantify mass segregation. The paper is structured as follows: in Sect. 2 we present previous and relevant information on NGC 6397 regarding mass segregation; in Sect. 3 we describe the observational data reduction; in Sect. 4, we present the preliminary analysis of projected data; in Sect. 5 we build the deprojected profiles; in Sect. 6 we discuss the results and present our concluding remarks.
2 Previous analysis on NGC 6397
NGC 6397 is located at and (J2000), at a distance from the Galactic centre of = 6 kpc [Harris (1996) (2010 edition)]. Its galactocentric coordinates are and , which explains the relatively low contamination by field stars. Its absolute distance modulus is (m-M)0 = 12.07 0.06 (Richer et al., 2013), AV = 0.56 (Heyl et al., 2012) using RV = 0.31, according Cardelli et al. (1989). Despite its proximity, the innermost part of the cluster is relatively hard to observe due to the high stellar density. Indeed, NGC 6397 is classified as a core collapse cluster, which has been confirmed by observations (Trager et al., 1995; Djorgovski & King, 1986). Using Hubble Space Telescope (HST) data, Sosin (1997) estimates an angular size of arcsec for the collapsed core of NGC 6397, which agrees with Cohn et al. (2010), but somewhat larger than 3 arcsec found by Harris (1996).
Using the observed proper motion of main-sequence stars, Heyl et al. (2012) estimated the kinematic mass of the cluster as . They show (fig. 7), through of the mean projected radius of main sequence stars, an apparent mass segregation up to 5 arcmin. They estimated that NGC 6397 has about 200 000 stars, with per cent of binaries, and visible white dwarfs with masses between 0.5 and 0.6 (Richer et al., 2013). Drukier (1993) used models of surface brightness profiles (SBP) to find a total mass and tidal radius of 39.1 pc.
King et al. (1995), imaging the highly-concentrated core of NGC 6397, found that mass segregation effects were very large, compared with the small degree of segregation determined by Drukier et al. (1993). King et al. (1995) observed with the Wide Field Planetary Camera 2 (WFPC2) a field taken 4.5 arcsec from the cluster centre. Adjusting a King model to the projected data, they fitted a proper dynamical model of the cluster to verify the amount of segregation.
Cool et al. (1998) suggested that the strong concentration of cataclysmic variables and a new class of faint UV stars towards the cluster centre is inconsistent with mass segregation related to the two-body relaxation alone seen by King et al. (1995).
Andreuzzi et al. (2004) built completeness-corrected colour-magnitude diagrams (CMDs) and luminosity functions (LFs) for main-sequence (MS) stars extracted from two fields extending from a region near the centre of the cluster out to arcmin. They found that the LFs follow exponential laws with different slopes, being flatter near the centre than otherwise. This is consistent with the presence of different mass distributions at two different radial distances, a clear indication of mass segregation.
The internal dynamics of NGC 6397 was addressed by Heyl et al. (2012) by means of proper motion measurements obtained with HST’s Advanced Camera for Surveys, revealing an agreement with the features of a mass-segregated, lowered isothermal distribution of stars, especially for the selected MS subsamples.
Goldsbury et al. (2013) quantified mass segregation in 54 Milky Way GCs, including NGC 6397, by fitting models to cumulative projected star count distributions. The work expands a database of structural and dynamical properties for 153 spatially resolved star clusters presented by McLaughlin & van der Marel (2005), where the structural and dynamical parameters were derived from fitting three different models. The results were compiled in Harris (1996) (2010 edition). Goldsbury et al. (2013) calculated the projected density distribution for various boundary conditions and found that fitting star counts rather than surface brightness profiles produce results that differ significantly due to the presence of mass segregation.
3 Observational data and reduction
The images of NGC 6397 used in this work are part of the program ID 083.D-0653(A) and were taken in 2009 July 27-28, with the ESO-VLT-UT1 telescope (Very Large Telescope), using FORS2 (FOcal Reducer and low dispersion Spectrograph) imager. The bands, filters and time exposures are described in Table 1. We obtained one image for each filter and exposure time. The FORS2 imager is composed by two CCDs (CCD1 and CCD2) of pixels and scale /pixel. The usable portion of the images contains pixels.
| Band | Filter | Exposure time (s) |
|---|---|---|
| B | B_HIGH | 1, 10, 120, 300 |
| V | V_HIGH | 1, 10, 120, 300 |
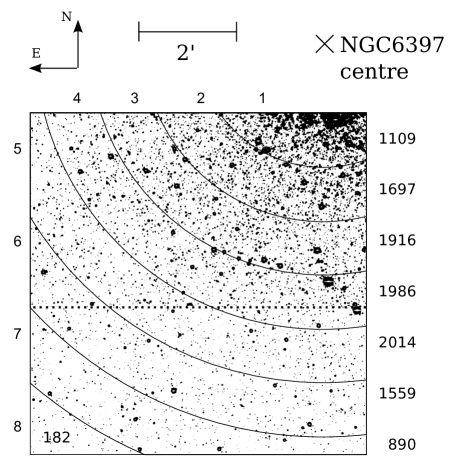
CCD1 and CCD2 cover fields of arcmin and arcmin, respectively, amounting to a total field of arcmin, without any gap between them. The images were centred at and (J2000) as shown in Fig. 1, corresponding to arcmin from the cluster centre to the upper right corner of CCD1.
Data reduction for our ESO-VLT images were carried out with iraf routines, with tasks daofind, phot and allstar, applying standard PSF photometric procedures. The best-fitting PSF function among those available in iraf was the elliptical Moffat with coefficient . The precise description of the PSF is important, for instance, for the insertion procedure of artificial stars (Sect. 4.3). Objects brighter than V 19 were saturated in the 300 s images, thus both data sets were combined to avoid superposition. We detected 12 793 sources in CCD1 and 6 528 in CCD2, totalling 19 321 detections. The photometric uncertainties were computed automatically by iraf.
4 Preliminary analysis
The first step in our study of mass segregation is to build the LF with our ESO-VLT data. We observed the LF difference between the region closest to the cluster centre and the outer region. It is necessary to make completeness analysis, being a crowded cluster, to determine whether this difference is observed only due to completeness effects of the data or it is the effect of real mass segregation.
4.1 Colour-magnitude Filter
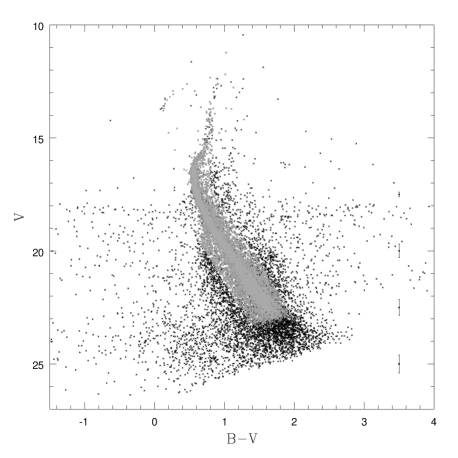
To exclude obvious non-member sources (mainly field stars), we use a colour-magnitude filter applied to the CMD built with the ESO-VLT data (Fig. 2), taking the photometric uncertainties into account. Obviously, this procedure also eliminates some stars that belong to the cluster (e.g. white dwarfs), but these are practically negligible for our purposes. This procedure eliminated 25 per cent of the stars originally present in the CMD of NGC 6397.
4.2 Image Slicing
In order to investigate the spatial dependence of properties such as the luminosity function and mass segregation, the ESO-VLT images were sliced into 8 radial concentric sections with the same width, centred at the cluster centre (Fig. 1). Hereafter, these surfaces are referred to as rings.
The rings are numbered from 1 to 8, from near the cluster centre outwards. The first ring is placed at arcmin = 0.72 pc from the cluster centre, with a radial width of 0.74 pc, using the distance to the cluster given by Richer et al. (2013). The number of probable-member stars in each ring is shown in the right side of Fig. 1.
4.3 Completeness Correction
Before investigating the spatial dependence of the LFs, we first study the photometric and spatial completeness of our data by means of artificial star simulations. In summary, we insert, just in the 300 s V-filter images, grids of identical artificial stars (equally spaced and with the same magnitude at each time). This V magnitude ranges from 13 to 26, with increments of 0.5 magnitude. The grids of artificial stars for CCD1 and CCD2 contain 1 008 and 756 stars, respectively, which corresponds to 10 per cent of the total number of observed stars in the images. These numbers are expected high enough to produce statistically significant completeness profiles for each ring without leading to excessive crowding.

The artificial stars were created using the same PSF from the data reduction (Sect. 3) through the task imexpr from iraf. Then, they were added to the actual images (task imarith) and reduced, to select and measure the position and magnitude of the stars, following the same procedures as for the original images (Sect. 3). We define completeness as the fraction of stars recovered with maximum deviation of 0.25 magnitudes relative to the inserted value (brightness test), and with maximum deviation of one pixel in position (positional test). Thus, we can estimate the completeness as a function for magnitude for each ring.

In the simulations the grids of artificial stars were placed at five different positions, shifting the stars in and pixels from the initial position. After obtaining the completeness for all grid positios, we computed the average completeness and its variance (taken as the uncertainty). The completeness as function of magnitude (and uncertainties) for each ring are shown in Fig. 3.
4.4 Luminosity Function
The LF is an important information source on several features of a GC, especially those related to the dynamical state and evolution. In particular, a radial dependence of the LF might imply mass segregation (Ferraro et al., 1997).
We built the LF of NGC 6397 by dividing the selected stars from its CMD (Fig. 2) into bins of 0.5 mag wide in V magnitude, both before (Fig. 4) and after (Fig. 5) the completeness correction. The LF is expressed in terms of the number of stars per magnitude bin. In this case, normalized by the highest bin. Interestingly, the LFs show systematic differences consistent with mass segregation (especially the increasing presence of bright stars towards the inner rings) before completeness correction.

After completeness correction, the resulting LFs (Fig. 5) confirm the presence of a higher density of brightness (V 18), thus more massive stars, towards the central region of the cluster, which is consistent with mass segregation. At the same time, there is a marked deficiency of bright stars in the outermost 8th ring.
However, projection effects may be affecting the observed profiles. For instance, a bright star (V 18) detected in the central region may, in fact, be an outsider projected therein, thus masking mass segregation. To investigate this point, we study the mass profile by means of deprojecting the luminosity and density profiles.
5 Deprojection Profiles
The rings discussed in the previous section correspond to on-the-sky projections of a three-dimensional structure. In this sense, the projected LFs of a given ring are contaminated by stars from the outer shells, in fractions that depend on the intrinsic (stellar or brightness) density distribution and the ring width.
Thus, before performing the final analysis of mass segregation in NGC 6397, we will proceed to deproject both the surface brightness profile (SBP) and the stellar radial density profile (RDP). Here, we define R as the projected distance from the cluster centre (in arcsec) as seen by the viewer, and r as the real distance (non-projected) from a three-dimensional coordinate to the cluster centre.
Since our observations are spatially restricted, not including the central region and outskirts of the cluster, we complement them with data available in the literature, combining CCD and photographic observations.
5.1 Surface brightness profile
We compared three SBPs of NGC 6397: the profile proposed with a King profile (King, 1962, 1966), the data observed by Trager et al. (1995) and by Noyola & Gebhardt (2006). However, as it is shown in Fig. 6, the SBP of NGC 6397 does not follow a King profile, especially for R 1 arcmin. We do not use the ESO-VLT data for the SBP because our data correspond to less than a quarter of surface rings, covering from 1 arcmin out to 10 arcmin.
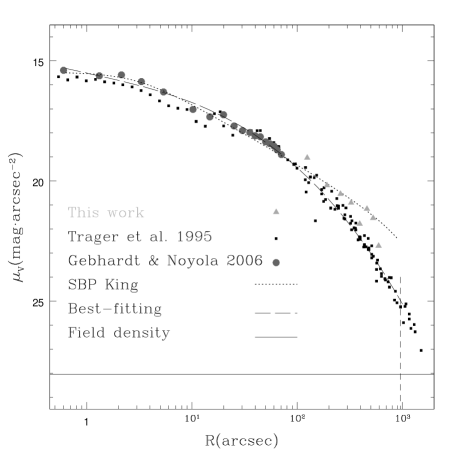
The data of Trager et al. (1995) cover the entire cluster in the V filter (Fig. 6), reaching out to 16 arcmin from the cluster centre, while Noyola & Gebhardt (2006) cover the centre to 100 arcsec in converted V magnitude (using WFPC2/HST images in F555W, F606W and F814W). The latter SBP diverges somewhat from that of Trager et al. (1995) only in the cluster centre (probably improvement due to CCD images). These more recent data (out to 100 arcsec) and Trager et al. (1995)’s data (from 100 arcsec out to the tidal radius) are used to fit the SBP in this work using Chebyshev polynomials according to
| (1) |
where (R/arcsec) and is the n-degree Chebyshev polynomial, evaluated within the range . The behaviour of the proposed functions is shown in Fig. 6. Chebyshev polynomials are used together with the King profile fitted to the RDP to determine the average luminosity radial function.
We use TRILEGAL (Girardi et al., 2005) to estimate the luminosity and density of Milky Way field stars in the direction of NGC 6397, obtaining a V surface brightness of 28.05 (arcsec-2), and a contamination by Galactic stars of 0.04 stars arcsec-2. These values are lower than those reached at the outermost RDP (Fig. 7) and SBP (Fig. 6) bins. The extended function SPB (Trager et al., 1995) reaches the Milky Way luminosity density at 950 arcsec, the value we adopted for the tidal radius.
5.2 Radial density profile
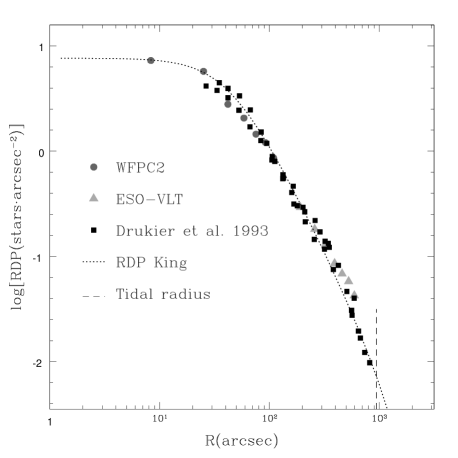
The RDP (Fig. 7) corresponds to the merging of three different data sets: Drukier et al. (1993) data covering the whole extent of the cluster, the WFPC2/HST images of the public file of the Hubble Legacy Archive that cover the central region ( arcsec) and our ESO-VLT (Sect. 3) for the outer parts ( arcsec arcsec).
First, we matched the outermost point (950 arcsec) in the Drukier et al. (1993) RDP to the background density predicted by TRILEGAL, assuming that missing stars (fainter than the observational data) form a constant distribution in the field, multiplying the image stars by a constant factor. Then, we matched the profiles smoothly under the constraint that the total amount of stars corresponds to a mass equal to (Heyl et al., 2012).
We find that the total number of stars in the cluster is about 193 00019 000 down to the limit of hydrogen burning. Heyl et al. (2012) suggest a cluster with more than 150 000 stars. Hurley et al. (2008) performed a model N-body of star cluster evolution starting with 100 000 stars (due to computational limitation) and suggest to perform with twice the number of stars to be more realistic.
The resulting RDP follows quite closely the King profile (King, 1962):
| (2) |
By fitting this function to the model by Drukier et al. (1993) to the ESO-VLT and WFPC2 RDP (Fig. 7) and using as constraint the total mass [ (Heyl et al., 2012)] as well as the SBP, we obtained the values (starsarcsec-2) for the field-star density, (starsarcsec-2) for the density in the cluster centre, arcsec for the core radius-density and arcsec and for the tidal radius-density.
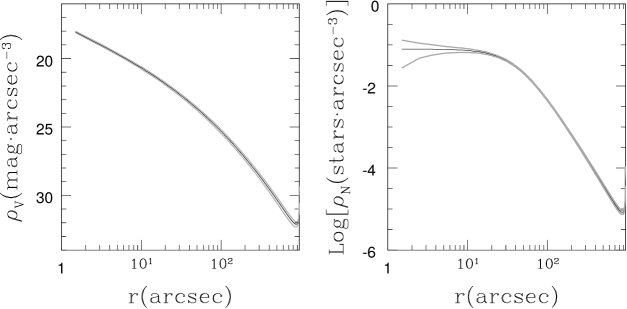
We use the units for the deprojected luminosity density and the density-number (the ratio between the magnitude and the number of stars by a volume) equal to one V magnitudearcsec-3 and starsarcsec-3, respectively.
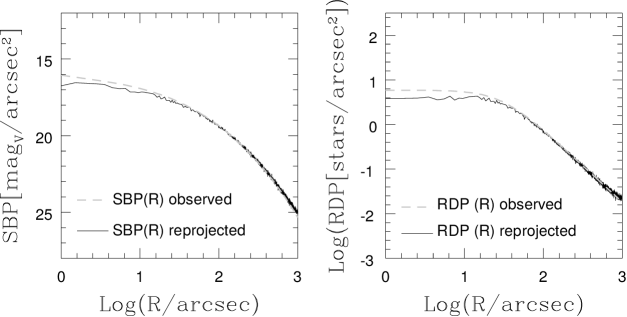
To determine the deprojected number-density of cluster stars [ in Fig. 8], we calculate the volume of the outermost ring (geometrically) and its number-density (from observational data), computing this amount for the outermost shell. Thereafter, we calculate the number of stars within the immediate inner ring and its volume. Subtracting the quantity in density of the outer rings, we estimate the density of the ring by dividing the remainder number of stars by its calculated volume. Thus, the density for each shell is computed from the values of the densities of the outer shells. The same procedure is used for the brightness density [ in Fig. 8]. We use a 1 arcsec step for the ring width. We employed geometrical deprojections instead of an inverse Abel transform because the former method can be used with discrete data (stars). Geometrical deprojection was suitable for our purposes and reprojection agrees with observational data (Fig. 9).
Subsequently, we projected the cluster stars assuming a radial symmetry in their distribution. In order to test it, we compared the reprojected data to the observed profiles in Fig. 9, showing the original projected profiles SBP (from Fig. 6) and RDP (Sec.2) in dashed blue lines. Both functions fit quite well the reprojected data (solid black lines) from the tidal radius down to the cluster centre.
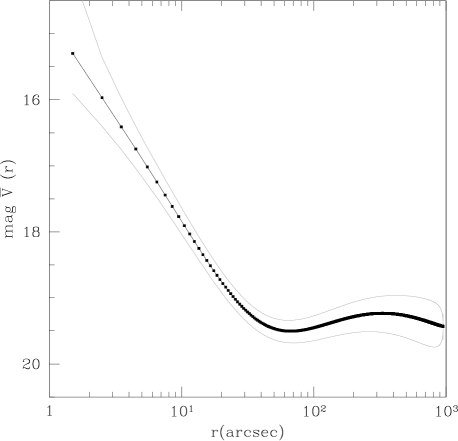
Calculating the ratio between the radial deprojected luminosity density (Fig. 8, left panel) by the radial deprojected density-number (Fig. 8, right panel), we established the averaged luminosity radial function (magnitude in Fig. 10) of the stars.
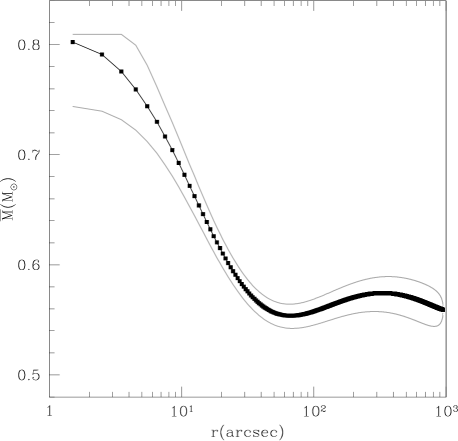
To convert luminosity (Fig. 10) to mass (Fig. 11), we used the best fitting multichromatic isochrone. The parameters were obtained by a statistical method comparing the mean ridge line from CMDs using multiple colours from the grid of isochrones from the Dartmouth Stellar Evolution Database (Dotter et al., 2008). The best-fitting parameters for NGC 6397 are an age of 12.00.5 Gyr, [Fe/H] = - 1.8 0.1, E(B-V) = 0.12 0.01 magnitudes and distance modulus (m-M)0 = 12.04 0.01 magnitudes.
6 Summary and discussions
The completeness-corrected projected luminosity function built with our ESO-VLT photometry suggests the presence of mass segregation in NGC 6397. Indeed Fig. 5 clearly shows a higher density of brighter stars near the projected central region of the cluster with respect to the outer parts. This apparent evidence may be due to contamination by outer shell stars.
Because of projection effects, mass segregation may not be directly detected on-the-sky luminosity functions. In this sense, geometrical deprojection appears to be a better approach. The analysis of a non-segregated cluster may show a crowded projected central field where the fainter stars are not detected, unlike what happens near the tidal radius.
To confirm the presence (or not) of mass segregation, we deprojected both the surface brightness and radial density profiles of NGC 6397. The SBP was built with data by Trager et al. (1995) and Noyola & Gebhardt (2006) (Fig. 6). For the radial density profile, we used a merging of three different data sets: Drukier et al. (1993), WFPC2/HST and ESO-VLT data (Fig. 7). We obtained then, the deprojected SBP and RDP, using their respective profiles (Fig. 9) and deprojecting both these functions.
Finally, computing the ratio between the deprojected radial luminosity density by the deprojected radial number-density (Fig. 8), we obtained the averaged radial luminosity function (Fig. 10). We also determined the cluster radial mass function.
Figure 11 shows that the mass segregation occurs basically in the centre of the cluster reaching up to a radius of 1 arcmin. In other words, we confirm the presence of mass segregation using deprojected data. Other authors (e.g. King et al., 1995; Cool et al., 1998; Andreuzzi et al., 2004; Heyl et al., 2012) evinced mass segregation to different radius using just projected data.
Even though the projected data in Figs. 4 and 5 and the literature [e.g. fig 7 Heyl et al. (2012)] show evidence of mass segregation beyond 1 arcmin, the deprojected profiles (Figs. 10 and 11) do not. The reason is that deprojection considers the contribution of the outer regions to the inner ones, thus, we compute the individual uncertainty for each ring by means of error propagation, as are shown in Figs. 8, 10 and 11. The segregation in the centre of mass is well established. So, the projected functions (RDP and SBP) are still accurate, showing that there is no mass segregation evidence in the deprojected profiles beyond 1 arcmin.
We also observed a soft depression around 0.55 M⊙ (radius equal to 1 arcmin) in Fig. 11. The decrease in this region can be explained by molecular absorption in the stellar atmospheres, also observed in the luminosity function (Richer et al., 2008). They explain that the mass-brightness relation is modified by molecular absorption in such a way that a moderate range in stellar mass creates a small range in luminosity so that the stars accumulate at this luminosity.
The conversion of luminosity into mass shows a degenerescence between white dwarf masses [ 0.55 ] and main sequence star masses [ 0.15 ] for the same luminosity (V 24). The white dwarf stars were neglected in this approach, being the main error source for the determination of mass, although the number of white dwarfs should be smaller than in main sequence stars.
In the present study, we found a way to determine the total number of stars in the cluster using the estimated mass as an input parameter. These are important results for theoretical studies, as well as N-body simulations.
The presence of dust is negligible and the luminous mass of the cluster is enough to explain the gravitational energy of the most distant stars, although mass percentage (uncertain) could be due to non-luminous mass. On the other hand, assumptions about dark matter (large amounts as in the galaxies) in the case of NGC 6397 are irrelevant (e.g. Shin et al., 2013).
Acknowledgments
We thank the referee for important comments and suggestions. We thank the ESO-VLT support team for help with the data acquisition. We acknowledge financial support from the Brazilian Institution CNPq and CAPES.
References
- Andreuzzi et al. (2004) Andreuzzi, G., Testa, V., Marconi, G., Alcaino, G., Alvarado, F., Buonanno, R. 2004, A&A, 425, 509
- Binney & Tremaine (1987) Binney, J., & Tremaine, S. 1987, Galactic Dynamics (Princeton University Press)
- Cardelli et al. (1989) Cardelli, J. A., Clayton, G. C., & Mathis, J. S. 1989, ApJ, 345, 245
- Carretta et al. (2009) Carretta, E., Bragaglia, A., Gratton, R., D’Orazi, V., & Lucatello, S. 2009, A&A, 508, 695
- Cohn et al. (2010) Cohn, Haldan N., Lugger, Phyllis M., Couch, Sean M., Anderson, Jay, Cool, Adrienne M., van den Berg, Maureen, Bogdanov, Slavko, Heinke, Craig O., Grindlay, Jonathan E. 2010, ApJ, 722, 20
- Cool et al. (1998) Cool, A. M., Grindlay, J. E., Cohn, H. N., Lugger, P. M., & Bailyn, C. D. 1998, ApJL, 508, L75
- da Costa (1982) da Costa, G. S. 1982, AJ, 87, 990
- Djorgovski & King (1986) Djorgovski, S., & King, I. R. 1986, ApJL, 305, L61
- Dotter et al. (2008) Dotter, Aaron, Chaboyer, Brian, Jevremovic, Darko, Kostov, Veselin, Baron, E., Ferguson, Jason W. 2008, ApJS, 178, 89
- Drukier et al. (1993) Drukier, G. A., Fahlman, G. G., Richer, H. B., Searle, L., & Thompson, I. 1993, AJ, 106, 2335
- Drukier (1993) Drukier, G. A. 1993, MNRAS, 265, 773
- Ferraro et al. (1997) Ferraro, F. R., Carretta, E., Bragaglia, A., Renzini, A., & Ortolani, S. 1997, MNRAS, 286, 1012
- Gebhardt et al. (1996) Gebhardt, K., Richstone, D., Ajhar, E. A., et al. 1996, AJ, 112, 105
- Girardi et al. (2005) Girardi, L., Groenewegen, M. A. T., Hatziminaoglou, E., & da Costa, L. 2005, A&A, 436, 895
- Goldsbury et al. (2010) Goldsbury, R., Richer, H. B., Anderson, J., et al. 2010, AJ, 140, 1830
- Goldsbury et al. (2013) Goldsbury, R., Heyl, J., & Richer, H. 2013, ApJ, 778, 57
- Gratton et al. (2003) Gratton, R. G., Bragaglia, A., Carretta, E., Clementini, G., Desidera, S., Grundahl, F., Lucatello, S. 2003, A&A, 408, 529
- Harris (1996) Harris, W. E. 1996, AJ, 112, 1487
- Heyl et al. (2012) Heyl, J. S., Richer, H., Anderson, J., Fahlman, G., Dotter, A., Hurley, J., Kalirai, J., Rich, R. M., et al. 2012, AJ, 761, 51
- Hurley et al. (2008) Hurley, Jarrod R., Shara, Michael M., Richer, Harvey B., King, Ivan R., Saul Davis, D., Kalirai, Jason S., Hansen, Brad M. S., Dotter, Aaron, et al. 2008, AJ, 135, 2129
- King (1962) King, I. 1962, AJ, 67, 471
- King (1966) King, I. R. 1966, AJ, 71, 64
- King et al. (1995) King, I. R., Sosin, C., & Cool, A. M. 1995, ApJL, 452, L33
- King et al. (1998) King, I. R., Anderson, J., Cool, A. M., & Piotto, G. 1998, ApJL, 492, L37
- McLaughlin & van der Marel (2005) McLaughlin, D. E., & van der Marel, R. P. 2005, ApJS, 161, 304
- McLaughlin & Fall (2008) McLaughlin, D. E., & Fall, S. M. 2008, ApJ, 679, 1272
- Noyola & Gebhardt (2006) Noyola, E., Gebhardt, K. 2006, AJ, 132, 447
- Paresce et al. (1995) Paresce, F., de Marchi, G., & Romaniello, M. 1995, ApJ, 440, 216
- Pieres et al. (2014) Pieres, A., S. O. Kepler, Bonatto, C., Martinazzi, E., Costa, J. E. S. et al. (in preparation)
- Pryor et al. (1986) Pryor, C., Smith, G. H., & McClure, R. D. 1986, AJ, 92, 1358
- Richer et al. (2008) Richer, Harvey B., Dotter, Aaron, Hurley, Jarrod, Anderson, Jay, King, Ivan, Davis, Saul, Fahlman, Gregory G., Hansen, Brad M. S., et al. 2008, AJ, 135, 2141
- Richer et al. (2013) Richer, Harvey B., Goldsbury, Ryan, Heyl, Jeremy, Hurley, Jarrod, Dotter, Aaron, Kalirai, Jason S., Woodley, Kristin A., Fahlman, Gregory G., et al. 2013, ApJ, 778, 104
- Sarajedini et al. (2007) Sarajedini, A., Bedin, L. R., Chaboyer, B., et al. 2007, AJ, 133, 1658
- Shin et al. (2013) Shin, J., Kim, S. S., & Lee, Y.-W. 2013, Journal of Korean Astronomical Society, 46, 173
- Sosin (1997) Sosin, C. 1997, AJ, 114, 1517
- Trager et al. (1995) Trager, S. C., King, I. R., & Djorgovski, S. 1995, AJ, 109, 218
- van Putten (2012) van Putten, M. H. P. M. 2012, New Astronomy, 17, 411
- Winget et al. (2009) Winget, D. E., Kepler, S. O., Campos, F., et al. 2009, ApJL, 693, L6